Wage Theft Statistics 2026: Back Wages Recovered and How Much Workers Lose
By ClauseAudit Research · 6 sources ·
What do the latest wage theft statistics show?
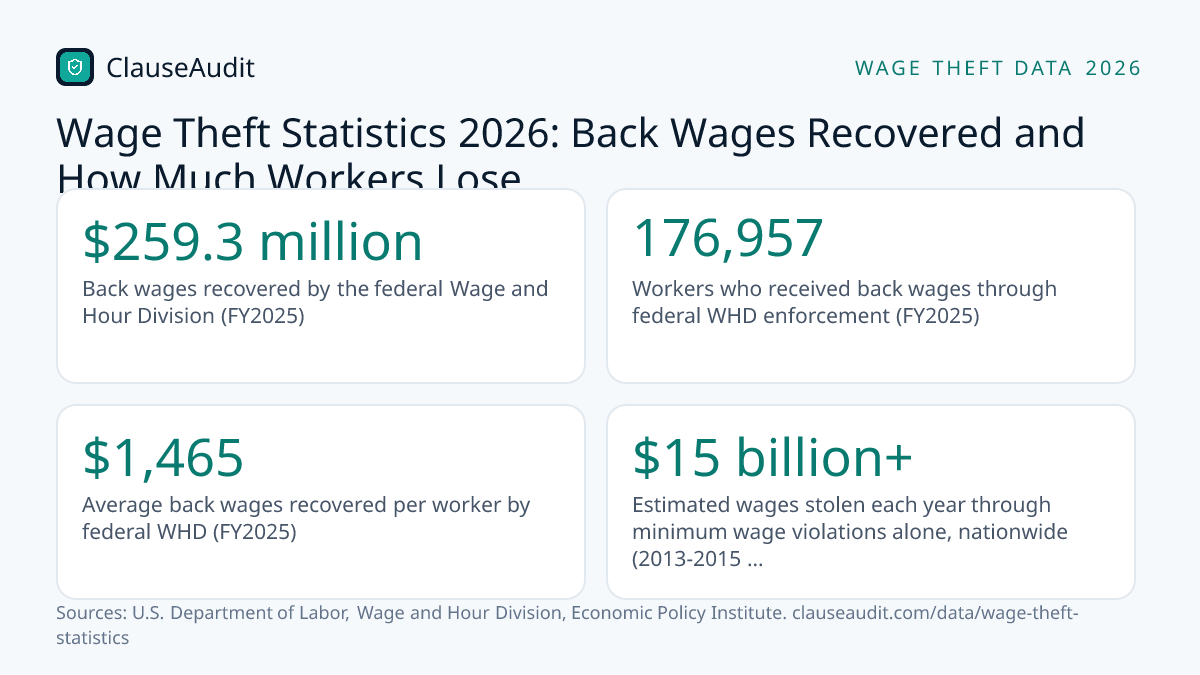
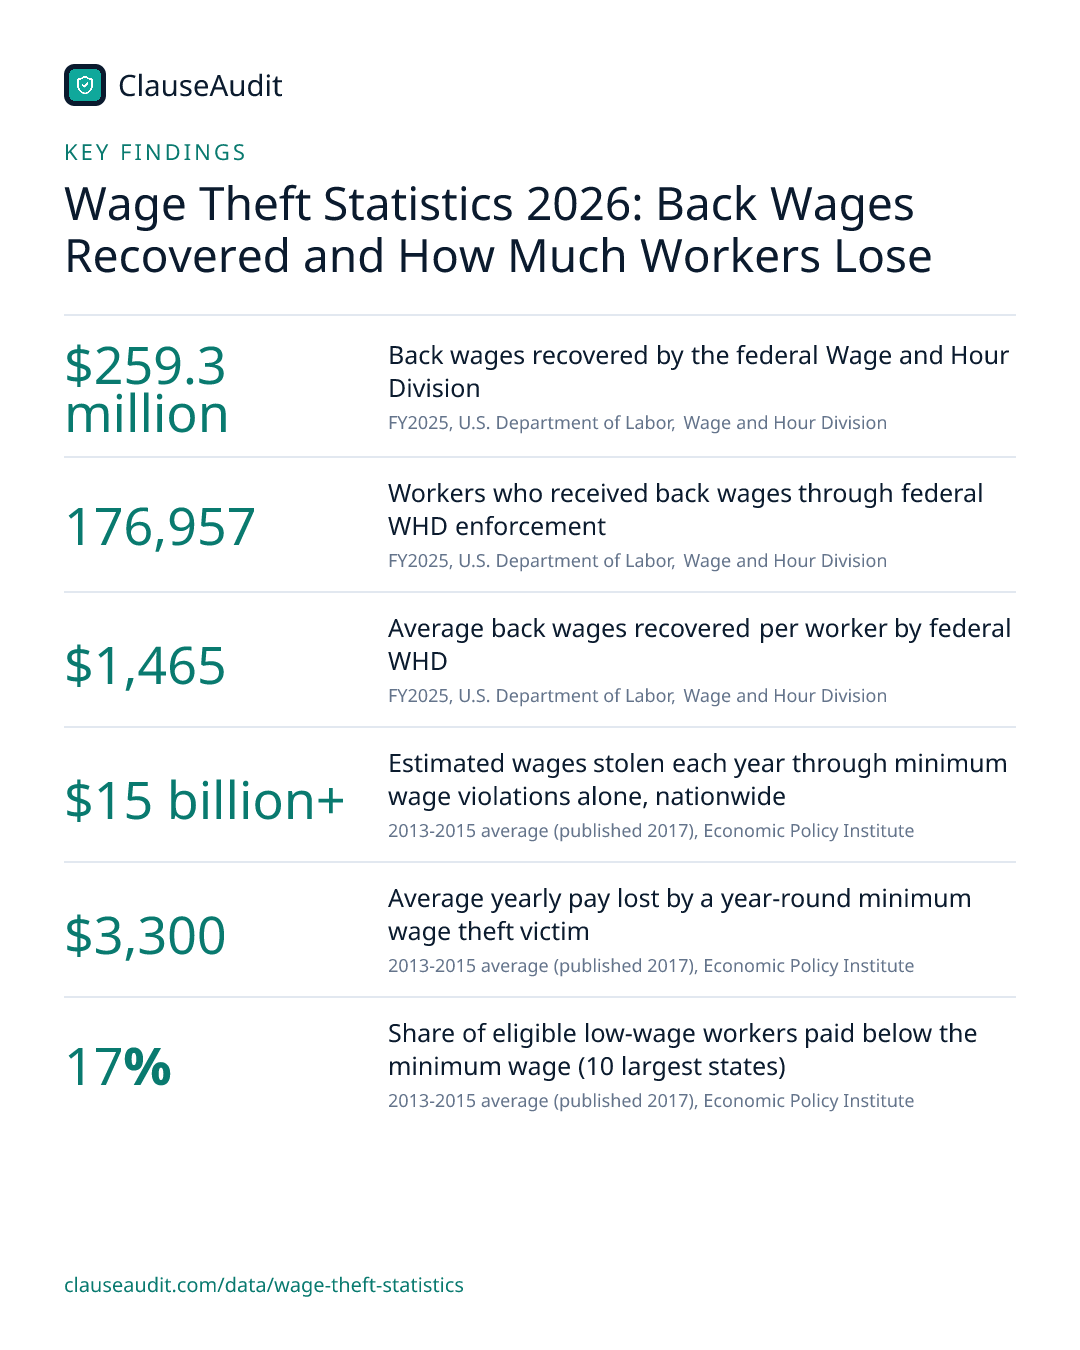
Wage theft is common, and most of it is never paid back. The federal Wage and Hour Division recovered $259.3 million for 176,957 workers in FY2025, about $1,465 each. Minimum wage violations alone were estimated to cost workers more than $15 billion a year, based on 2013-2015 data.

- Back wages recovered by the federal Wage and Hour Division (FY2025, U.S. Department of Labor, Wage and Hour Division)
- $259.3 million
- Workers who received back wages through federal WHD enforcement (FY2025, U.S. Department of Labor, Wage and Hour Division)
- 176,957
- Average back wages recovered per worker by federal WHD (FY2025, U.S. Department of Labor, Wage and Hour Division)
- $1,465
- Estimated wages stolen each year through minimum wage violations alone, nationwide (2013-2015 average (published 2017), Economic Policy Institute)
- $15 billion+
- Average yearly pay lost by a year-round minimum wage theft victim (2013-2015 average (published 2017), Economic Policy Institute)
- $3,300
- Share of eligible low-wage workers paid below the minimum wage (10 largest states) (2013-2015 average (published 2017), Economic Policy Institute)
- 17%
- Stolen wages recovered 2021-2023 by DOL, states and class actions combined (2021-2023 (published December 20, 2024), Economic Policy Institute)
- $1.5 billion+
- Stolen wages recovered 2017-2020 by DOL, states and class actions combined (earlier EPI edition) (2017-2020, Economic Policy Institute)
- $3.24 billion
- FLSA back wages recovered for overtime violations (FY2025, U.S. Department of Labor, Wage and Hour Division)
- $146.4 million
Wage theft is any pay you earned but never got: unpaid overtime, hours worked off the clock, tips the boss kept, or a final check that never arrived. It rarely looks like a crime. It looks like a payroll "mistake" that keeps happening.
This page pulls together the latest federal enforcement numbers and the best estimates of the total loss. The short version: the federal government recovers a few hundred million dollars a year, while the money lost runs into the billions.
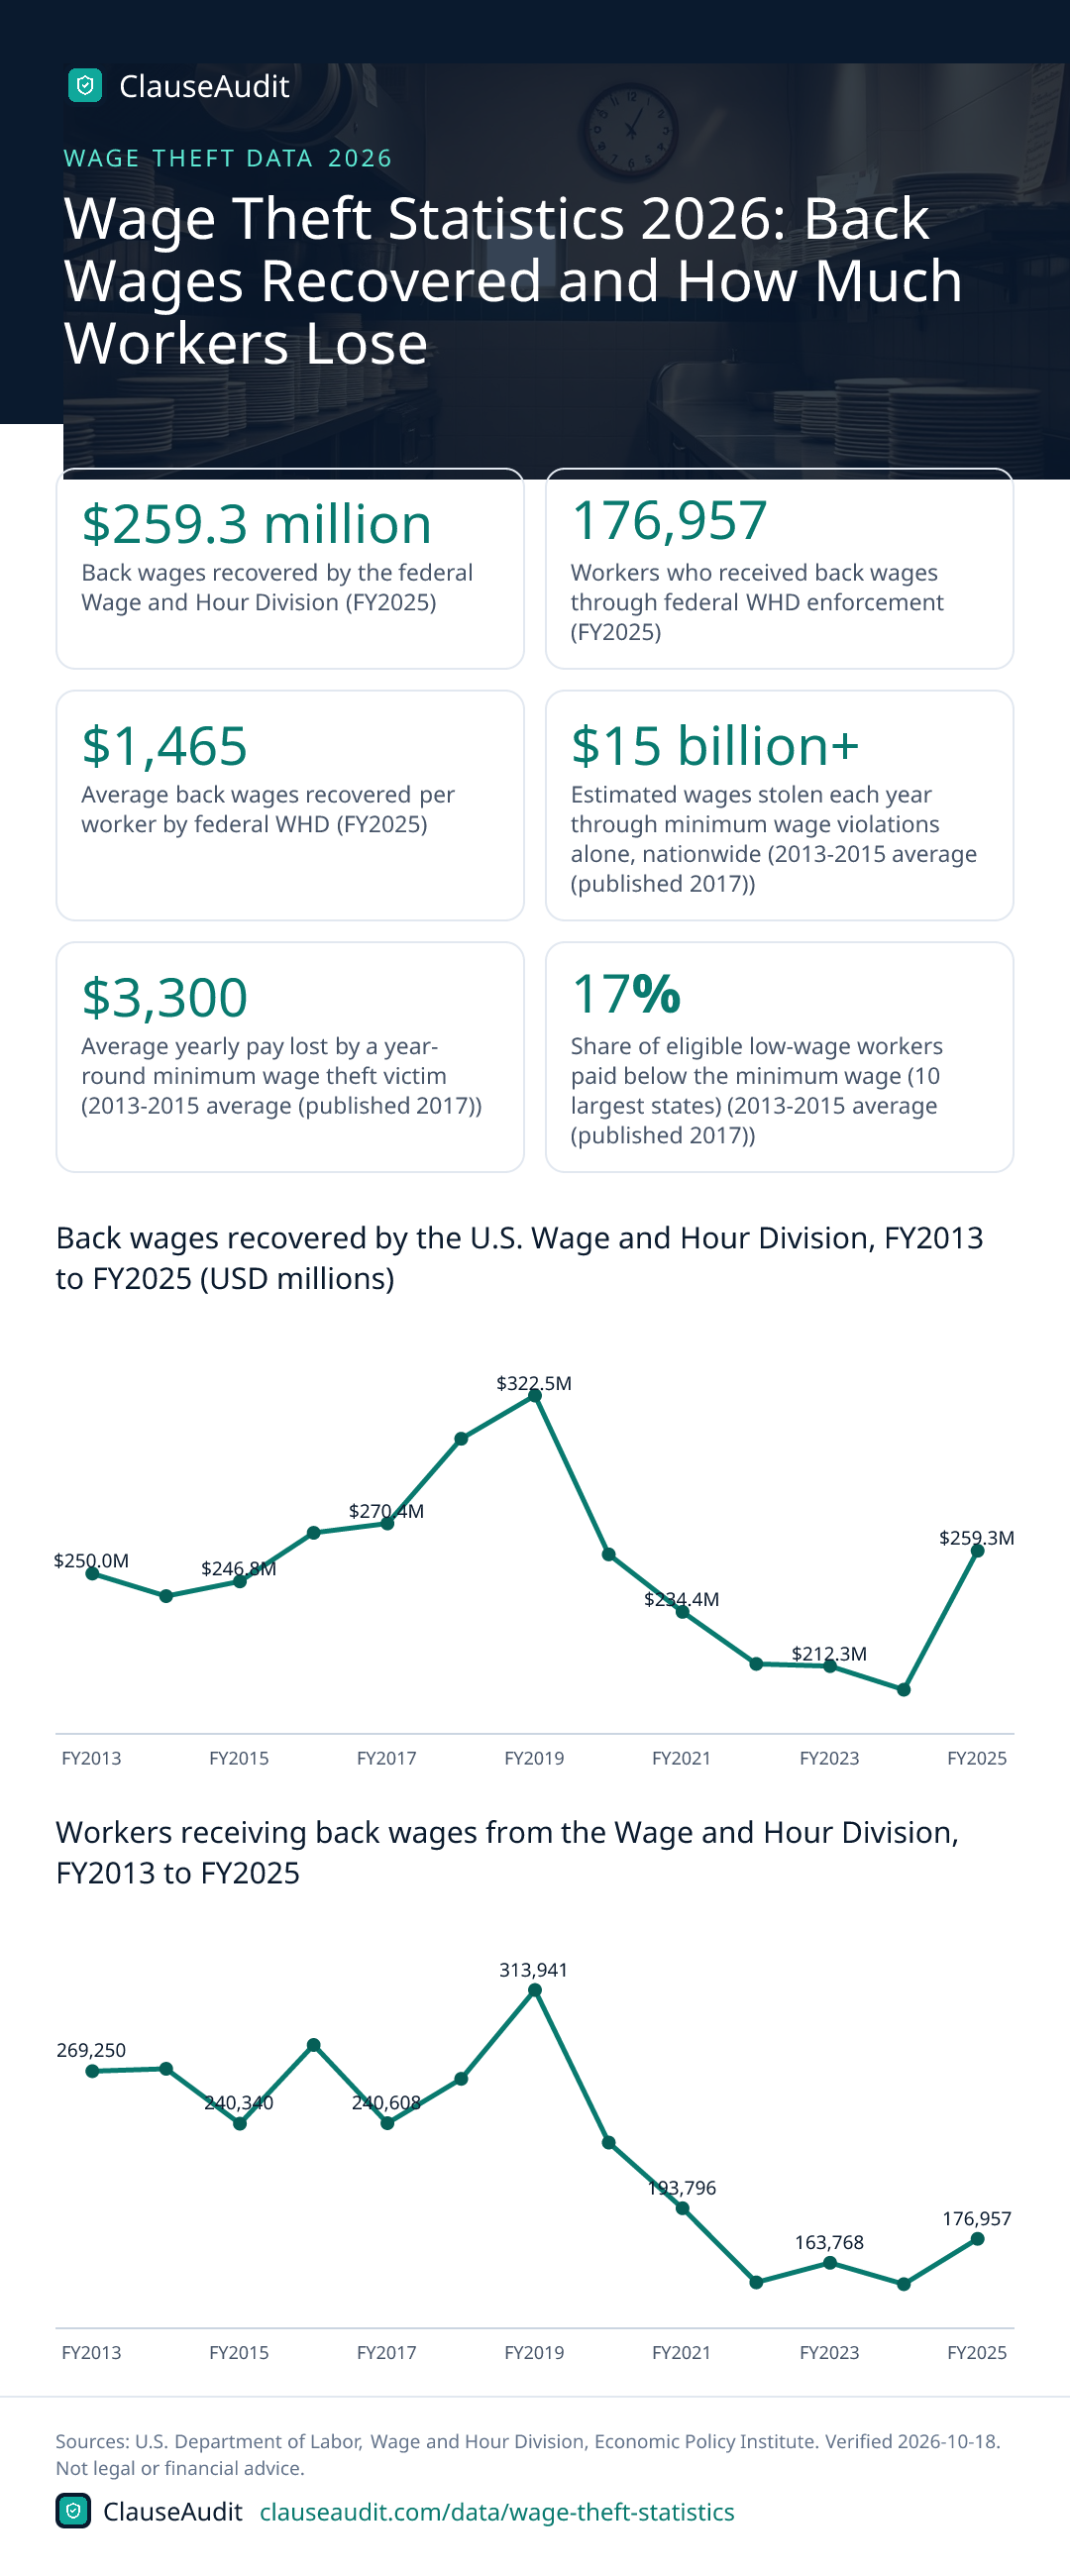
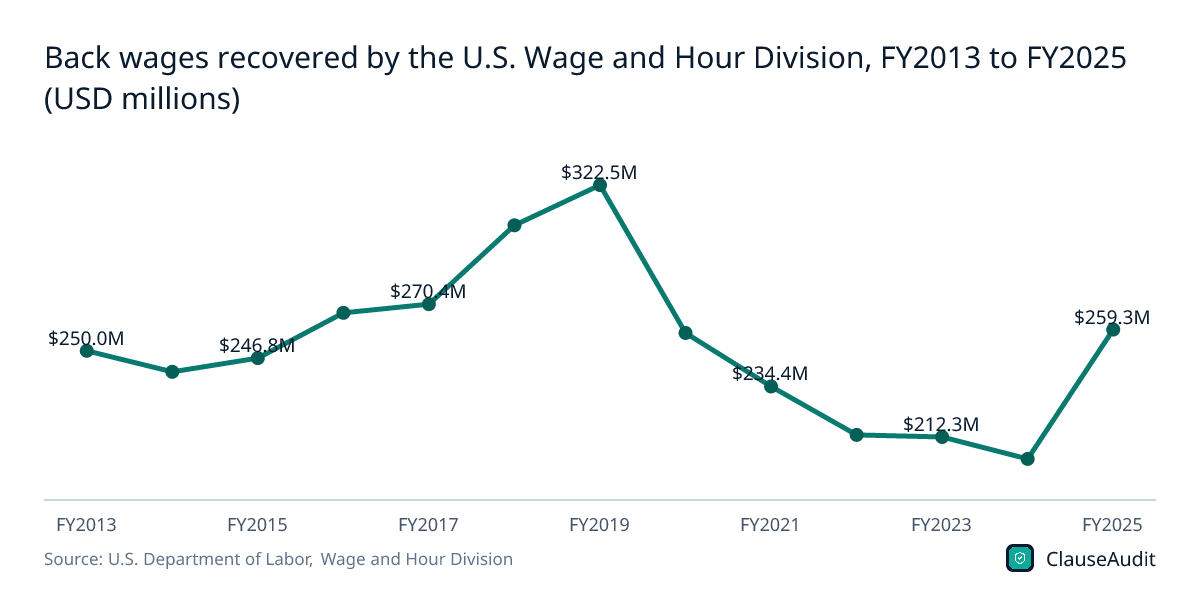
Back wages recovered by the U.S. Wage and Hour Division, FY2013 to FY2025 (USD millions)
Chart data
| Label | Value (USD millions) |
|---|---|
| FY2013 | $250.0M |
| FY2014 | $240.8M |
| FY2015 | $246.8M |
| FY2016 | $266.6M |
| FY2017 | $270.4M |
| FY2018 | $304.9M |
| FY2019 | $322.5M |
| FY2020 | $257.8M |
| FY2021 | $234.4M |
| FY2022 | $213.2M |
| FY2023 | $212.3M |
| FY2024 | $202.7M |
| FY2025 | $259.3M |
Federal recoveries peaked at $322.5 million in FY2019, slid to $202.7 million in FY2024, then climbed back to $259.3 million in FY2025. These are only cases the Wage and Hour Division concluded, so the line tracks enforcement as much as the amount of theft.
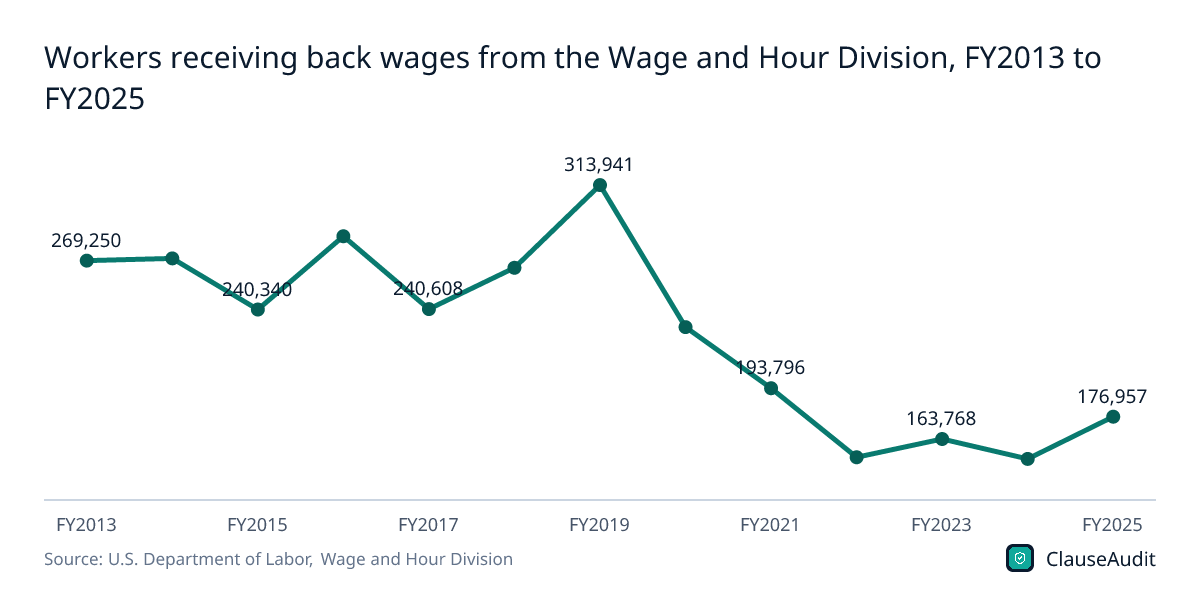
Download this chart (PNG)Workers receiving back wages from the Wage and Hour Division, FY2013 to FY2025
Chart data
| Label | Value |
|---|---|
| FY2013 | 269,250 |
| FY2014 | 270,570 |
| FY2015 | 240,340 |
| FY2016 | 283,677 |
| FY2017 | 240,608 |
| FY2018 | 265,027 |
| FY2019 | 313,941 |
| FY2020 | 229,934 |
| FY2021 | 193,796 |
| FY2022 | 152,970 |
| FY2023 | 163,768 |
| FY2024 | 151,989 |
| FY2025 | 176,957 |
The number of workers paid back fell from 313,941 in FY2019 to 151,989 in FY2024 before rising to 176,957 in FY2025. Back wages fell less sharply than the worker count, so the average recovery per person went up.
Download this chart (PNG)FLSA back wages by violation type, FY2025 (USD millions)
Chart data
| Label | Value |
|---|---|
| Overtime | $146.4M |
| Minimum wage | $27.5M |
| Tip-related | $10.0M |
| Retaliation | $0.48M |
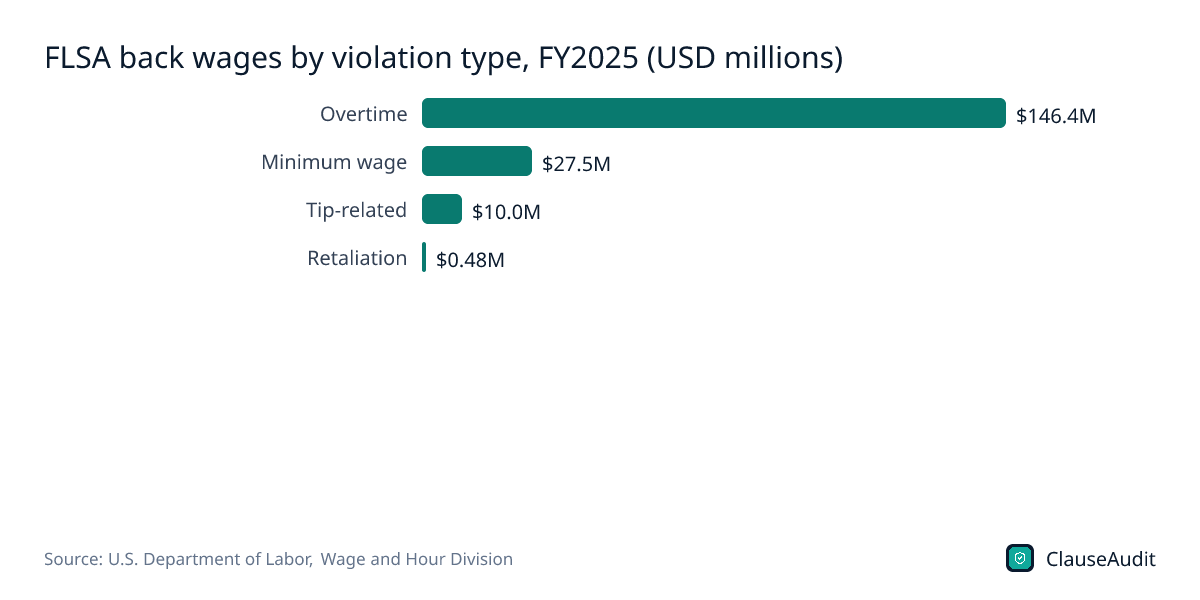
Overtime dwarfs everything else: $146.4 million for 110,551 employees, against $27.5 million for minimum wage violations. If you work more than a standard week, your overtime math is the first thing to check.
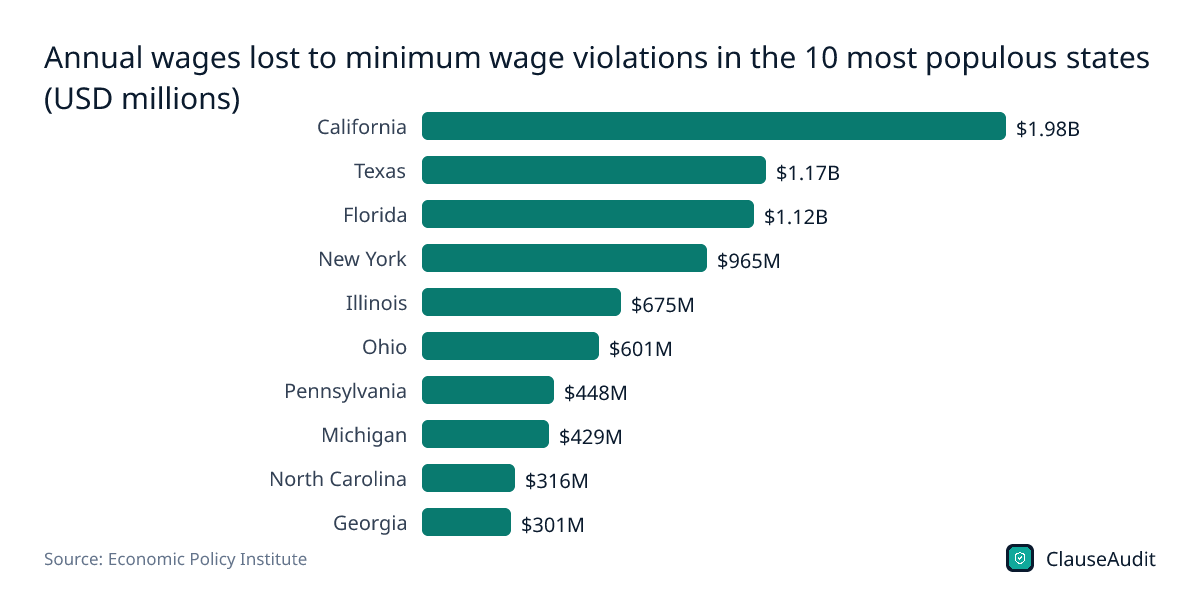
Download this chart (PNG)Annual wages lost to minimum wage violations in the 10 most populous states (USD millions)
Chart data
| Label | Value |
|---|---|
| California | $1.98B |
| Texas | $1.17B |
| Florida | $1.12B |
| New York | $965M |
| Illinois | $675M |
| Ohio | $601M |
| Pennsylvania | $448M |
| Michigan | $429M |
| North Carolina | $316M |
| Georgia | $301M |
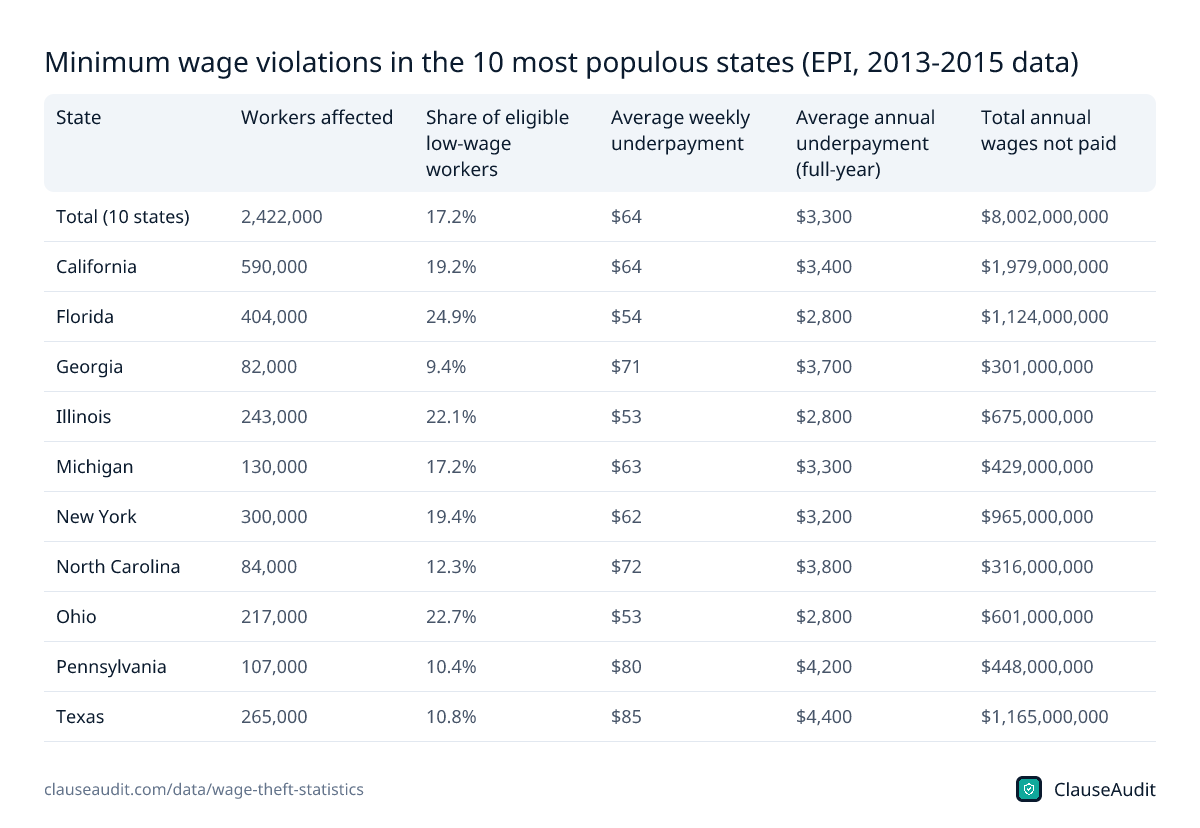
California tops the list at $1.98 billion a year, but bigger states naturally post bigger totals. Look at the table for the share of workers affected, which reached 24.9% in Florida.
Download this chart (PNG)Stolen wages recovered by channel, 2021 to 2023 (USD millions)
Chart data
| Label | Value (USD millions) |
|---|---|
| U.S. Department of Labor (FY2021-FY2023) | $659.8M |
| Top 10 class action settlements (2021 only) | $641.3M |
| State labor departments and AGs (34 states + DC, 2021-2023) | $201.4M |
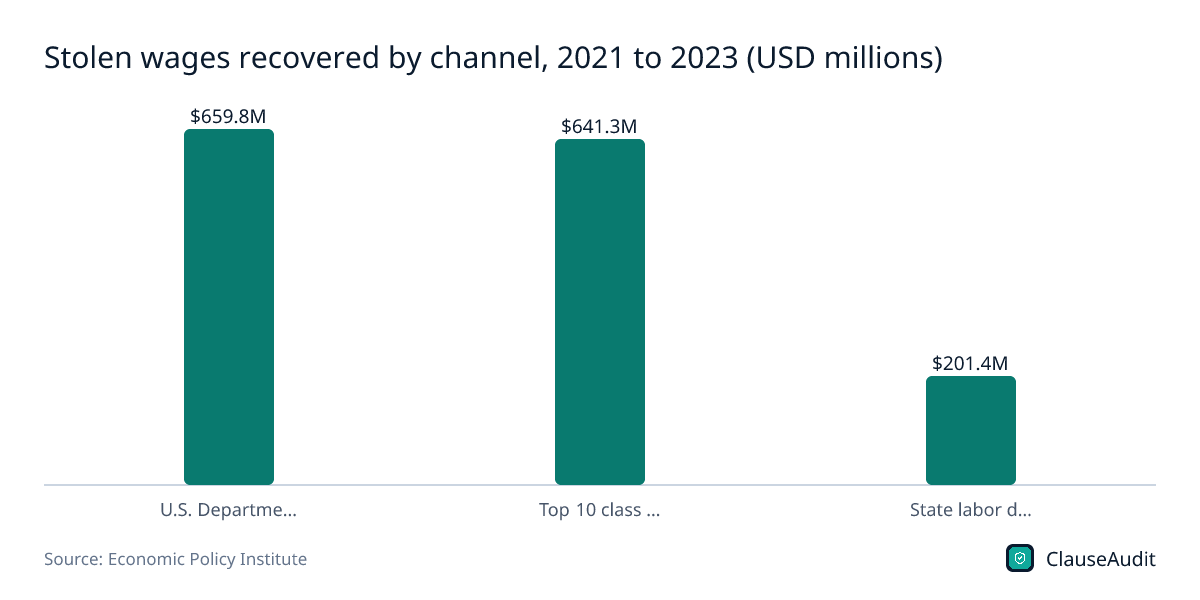
The Department of Labor recovered $659.8 million over FY2021 to FY2023, and the largest class action settlements added $641.3 million in 2021 alone. State agencies reported $201.4 million, with 16 states missing from the count.
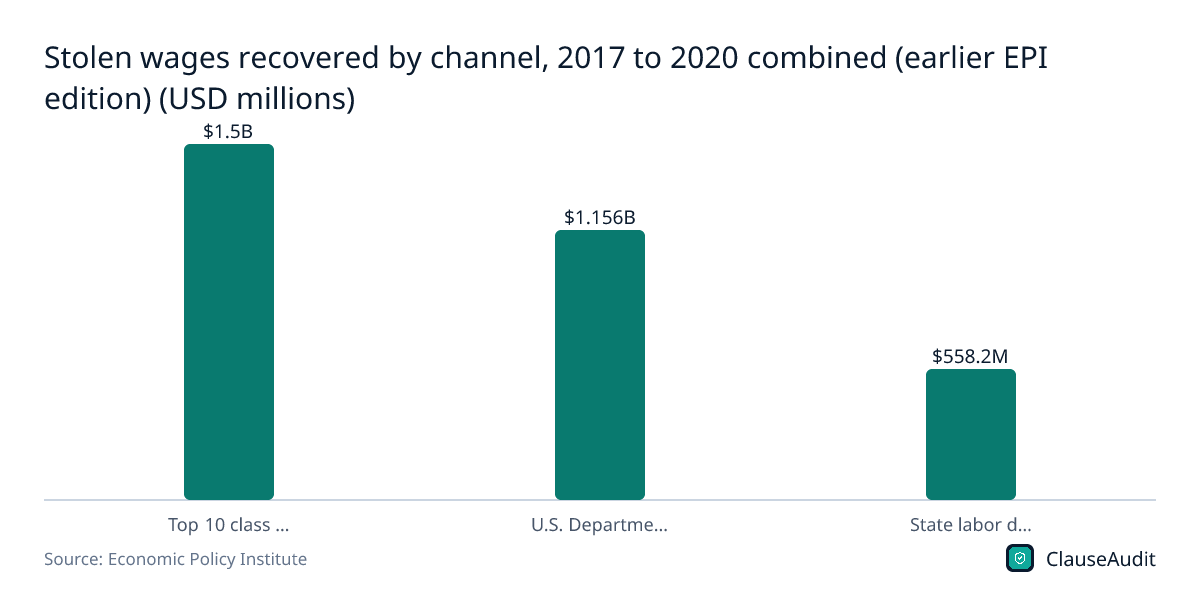
Download this chart (PNG)Stolen wages recovered by channel, 2017 to 2020 combined (earlier EPI edition) (USD millions)
Chart data
| Label | Value (USD millions) |
|---|---|
| Top 10 class action settlements | $1.5B |
| U.S. Department of Labor | $1.156B |
| State labor departments and AGs (41 states + DC) | $558.2M |
In the earlier period, class action settlements recovered more than any agency. This edition covers different years and more states, so compare it with the 2021 to 2023 chart only loosely.
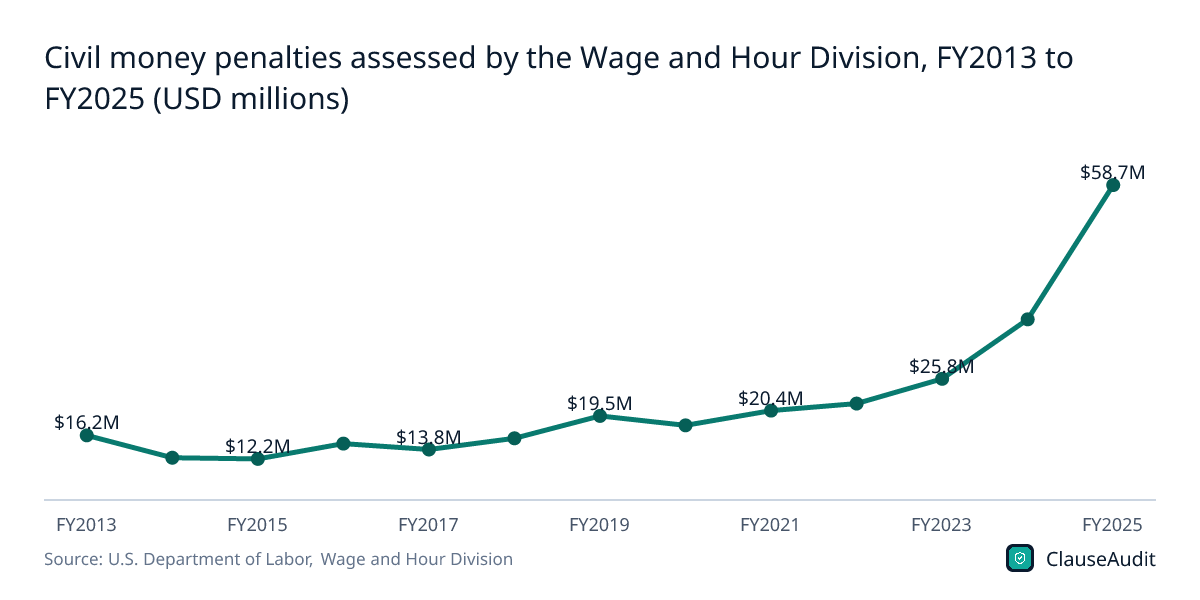
Download this chart (PNG)Civil money penalties assessed by the Wage and Hour Division, FY2013 to FY2025 (USD millions)
Chart data
| Label | Value (USD millions) |
|---|---|
| FY2013 | $16.2M |
| FY2014 | $12.4M |
| FY2015 | $12.2M |
| FY2016 | $14.8M |
| FY2017 | $13.8M |
| FY2018 | $15.7M |
| FY2019 | $19.5M |
| FY2020 | $17.9M |
| FY2021 | $20.4M |
| FY2022 | $21.6M |
| FY2023 | $25.8M |
| FY2024 | $35.9M |
| FY2025 | $58.7M |
Civil money penalties rose to $58.7 million in FY2025 from $35.9 million in FY2024. That money goes to the government, not to the workers who were shorted.
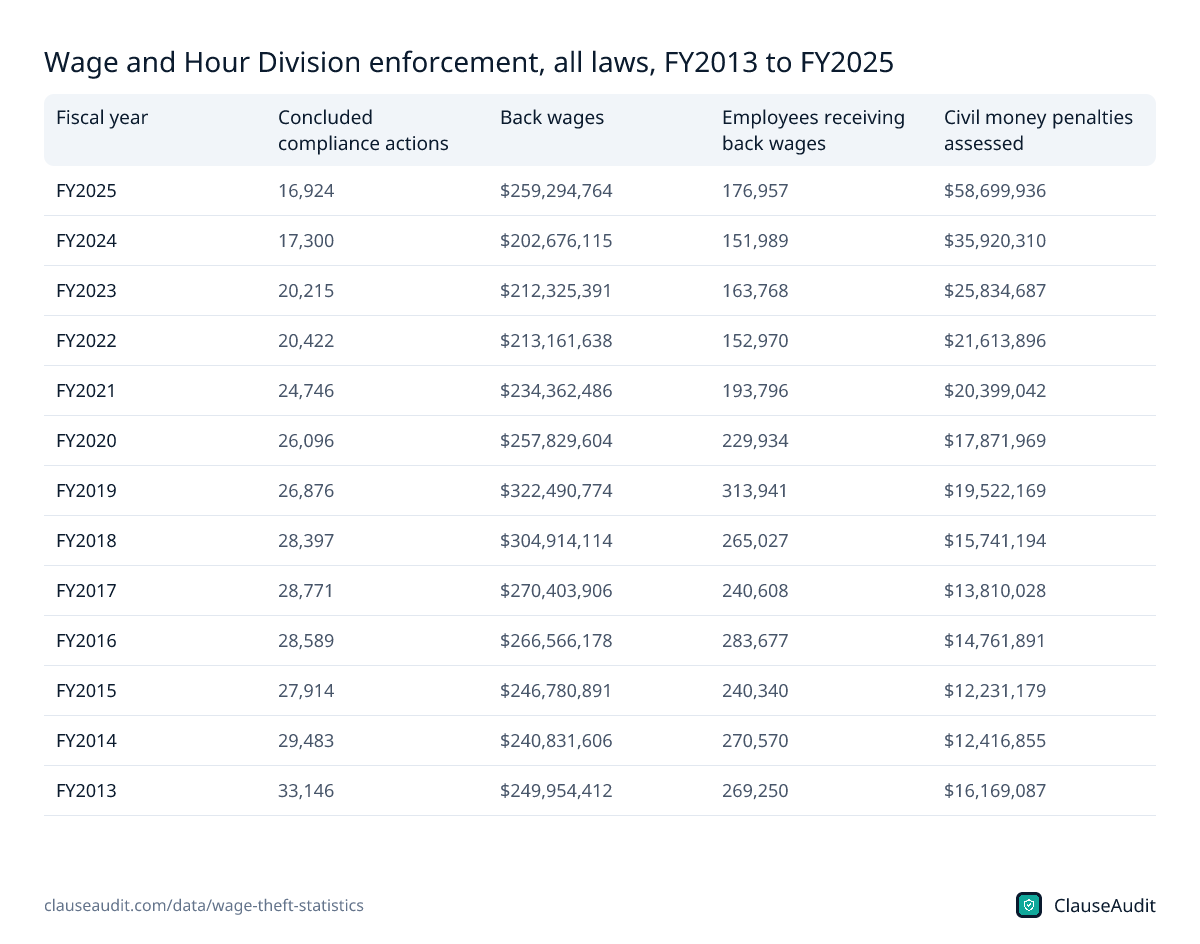
Download this chart (PNG)Wage and Hour Division enforcement, all laws, FY2013 to FY2025
| Fiscal year | Concluded compliance actions | Back wages | Employees receiving back wages | Civil money penalties assessed |
|---|---|---|---|---|
| FY2025 | 16,924 | $259,294,764 | 176,957 | $58,699,936 |
| FY2024 | 17,300 | $202,676,115 | 151,989 | $35,920,310 |
| FY2023 | 20,215 | $212,325,391 | 163,768 | $25,834,687 |
| FY2022 | 20,422 | $213,161,638 | 152,970 | $21,613,896 |
| FY2021 | 24,746 | $234,362,486 | 193,796 | $20,399,042 |
| FY2020 | 26,096 | $257,829,604 | 229,934 | $17,871,969 |
| FY2019 | 26,876 | $322,490,774 | 313,941 | $19,522,169 |
| FY2018 | 28,397 | $304,914,114 | 265,027 | $15,741,194 |
| FY2017 | 28,771 | $270,403,906 | 240,608 | $13,810,028 |
| FY2016 | 28,589 | $266,566,178 | 283,677 | $14,761,891 |
| FY2015 | 27,914 | $246,780,891 | 240,340 | $12,231,179 |
| FY2014 | 29,483 | $240,831,606 | 270,570 | $12,416,855 |
| FY2013 | 33,146 | $249,954,412 | 269,250 | $16,169,087 |
Source: U.S. Department of Labor, Wage and Hour Division, WHD Enforcement Statistics: All Acts (FY2013 to FY2025). Download as image
Minimum wage violations in the 10 most populous states (EPI, 2013-2015 data)
| State | Workers affected | Share of eligible low-wage workers | Average weekly underpayment | Average annual underpayment (full-year) | Total annual wages not paid |
|---|---|---|---|---|---|
| Total (10 states) | 2,422,000 | 17.2% | $64 | $3,300 | $8,002,000,000 |
| California | 590,000 | 19.2% | $64 | $3,400 | $1,979,000,000 |
| Florida | 404,000 | 24.9% | $54 | $2,800 | $1,124,000,000 |
| Georgia | 82,000 | 9.4% | $71 | $3,700 | $301,000,000 |
| Illinois | 243,000 | 22.1% | $53 | $2,800 | $675,000,000 |
| Michigan | 130,000 | 17.2% | $63 | $3,300 | $429,000,000 |
| New York | 300,000 | 19.4% | $62 | $3,200 | $965,000,000 |
| North Carolina | 84,000 | 12.3% | $72 | $3,800 | $316,000,000 |
| Ohio | 217,000 | 22.7% | $53 | $2,800 | $601,000,000 |
| Pennsylvania | 107,000 | 10.4% | $80 | $4,200 | $448,000,000 |
| Texas | 265,000 | 10.8% | $85 | $4,400 | $1,165,000,000 |
Source: Economic Policy Institute, Employers steal billions from workers' paychecks each year (Cooper and Kroeger). Download as image
How common is wage theft in the US?
More common than most people think. In the 10 most populous states, about 17% of eligible low-wage workers were paid below the minimum wage, according to the Economic Policy Institute's analysis of 2013-2015 survey data.
The amounts look small week to week. The average shortfall was $64 a week, nearly a quarter of what those workers earned. Over a full year it adds up to $3,300, which for a minimum wage worker can be the difference between making rent and falling behind.
Keep in mind that this estimate counts minimum wage violations only. It leaves out unpaid overtime, stolen tips, illegal deductions and unpaid final checks, so the true total is larger. The data is also old. It is still the most recent edition of that analysis.
Are federal wage theft recoveries going up or down?
Both, depending on the window you pick. The Wage and Hour Division recovered $322.5 million in FY2019, then dropped every year after that, bottoming out at $202.7 million in FY2024. FY2025 broke the slide at $259.3 million.
The bigger story is in the enforcement table. The division concluded 33,146 compliance actions in FY2013 and only 16,924 in FY2025. Fewer cases are being closed, yet each one is recovering more. In FY2025 the average worker who got money back received $1,465.
Penalties tell a similar story. They reached $58.7 million in FY2025, the highest on the chart. That signals tougher treatment of employers who get caught, but a penalty does nothing for your bank account. Only back wages go to workers.
What is the most common type of wage theft?
Unpaid overtime, by a wide margin. Of the federal Fair Labor Standards Act back wages recovered in FY2025, $146.4 million came from overtime violations. Minimum wage cases brought in $27.5 million and tip violations $10.0 million.
Overtime theft is easy to miss because your paycheck still looks normal. Say you work at a warehouse, get paid hourly and stay late three nights a week to finish loading. If those extra hours never reach your timesheet, you lose time and a half on every one of them, and nothing on your stub looks wrong. Here is how it usually shows up:
- You are told to clock out and then finish closing duties or answer emails.
- You are paid a flat salary and told it "covers all hours," even though your job does not meet the legal test for an exempt role.
- Your hours are averaged over two weeks so that a long week cancels out a short one. Overtime is owed week by week.
- You are paid as a contractor for work that looks exactly like an employee's job.
- Training, travel between job sites or required prep time is left off your timesheet.
How much stolen pay do workers actually get back?
Only a fraction. Put the estimates side by side. Minimum wage theft alone was pegged at more than $15 billion a year. Meanwhile, every recovery channel the Economic Policy Institute could count, including the Department of Labor, state agencies and the biggest class actions, added up to more than $1.5 billion over 2021 to 2023.
Those two figures cover different years and different violations, so they are not a precise ratio. But the gap is wide enough to make the point: most stolen wages stay with the employer.
Where does recovered money come from? Private lawsuits matter more than many workers realize. The top 10 wage and hour class action settlements produced $641.3 million in 2021 alone, close to the $659.8 million the Department of Labor recovered over FY2021 to FY2023. State labor departments and attorneys general reported $201.4 million, though 16 states did not provide data.
What should you do if your employer owes you wages?
Start before there is a dispute. The worker with records usually wins the argument, because the employer's own timesheets are often the very thing that is wrong. You do not need perfect evidence to file. You need enough detail for an investigator to see the pattern.
- Keep your own log of start times, end times and breaks. A phone note made the same day is better than memory.
- Save every pay stub and compare the hours and rate on it with your own log.
- Ask for the missing pay in writing, by email, so there is a dated record of the request.
- File a wage claim with your state labor department or the federal Wage and Hour Division. Both are free and you do not need a lawyer to start.
- Watch the deadline. Claims expire, and the window varies by state and by law.
- Do not sign a release or settlement for less than you are owed without understanding what you are giving up.
- Remember that firing or punishing you for complaining about pay is itself illegal.
What these numbers mean for freelancers and small businesses
If you work as a freelancer, minimum wage and overtime laws generally do not protect you. Your protection is the contract. A client who pays late or not at all is usually breaking the contract rather than wage laws, so your payment terms, late fees and kill fee are what you can enforce. A few places, such as New York State, also have freelance payment laws that require a written contract and timely pay.
There is one big exception. If a company treats you like an employee but pays you as a contractor, you may be misclassified, and then wage laws can apply after all. Check how the work is actually done, not just what the contract calls you.
For small business owners, the takeaway runs the other way. A case can mean back wages plus penalties, and penalties have been rising. Check how you classify each role, whether salaried staff truly qualify as exempt, and if your timekeeping captures all work, including the minutes before and after a shift. Fixing a policy now costs far less than paying it back later with penalties on top.
How ClauseAudit helps with unpaid wages
A lot of wage theft starts with a contract or offer letter that sets the stage: a salary described as covering all hours, a contractor label on a full-time role, or deductions you agreed to without noticing.
Upload your employment contract and the automated review flags the clauses that affect how and when you get paid, with plain English explanations and suggested changes you can raise before you sign.
- Pay rate, pay schedule and whether salary is described as covering all hours worked
- Exempt or non-exempt status and how overtime is calculated
- Contractor or employee classification compared with how the job actually works
- Deductions from pay for equipment, uniforms, shortages or training costs
- Final paycheck timing, unused PTO payout and repayment clauses when you leave
- Mandatory arbitration and class action waivers that limit how you can recover unpaid pay
Frequently asked questions
What counts as wage theft?
Wage theft is any failure to pay wages you are legally owed. Common forms include paying below minimum wage, skipping overtime, making you work off the clock, keeping tips, taking illegal deductions and withholding a final paycheck. It can also happen when an employer calls you a contractor to avoid wage laws while treating you like an employee.
How much money did the Department of Labor recover in back wages in FY2025?
The Wage and Hour Division recovered $259.3 million in back wages across all the laws it enforces in FY2025, paid to 176,957 workers. That was up from $202.7 million in FY2024 but below the FY2019 high of $322.5 million. These figures cover federal cases only, not state agencies or private lawsuits.
How much does the average wage theft victim lose?
In the Economic Policy Institute's study of the 10 most populous states, a year-round worker paid below minimum wage lost an average of $3,300 a year, or $64 a week. That was nearly a quarter of their earned pay. The figure covers minimum wage violations only, so workers also shorted on overtime may lose more.
How much does the average worker get back in a federal wage case?
In FY2025, back wages recovered by the federal Wage and Hour Division averaged $1,465 per worker. Individual cases vary widely, from a few dollars of missed overtime to several years of unpaid hours, so treat the average as a rough guide rather than what your own claim is worth.
Which state has the most wage theft?
Among the 10 most populous states studied by the Economic Policy Institute, California had the largest annual loss from minimum wage violations at $1.98 billion. Florida had the highest share of eligible low-wage workers affected at 24.9%. The study used 2013-2015 data and did not cover smaller states.
Is unpaid overtime wage theft?
Yes, and it is the biggest category in federal enforcement. In FY2025 the Wage and Hour Division recovered $146.4 million in overtime back wages for 110,551 employees under the Fair Labor Standards Act. Being paid a salary does not automatically remove your right to overtime. Your duties and pay level decide if you are exempt.
How do I report wage theft?
You can file a complaint with your state labor department or with the U.S. Department of Labor's Wage and Hour Division. Both are free, and the Wage and Hour Division keeps your name and complaint confidential. Bring your pay stubs, your own record of hours and any written communication about pay. File soon, because wage claims have deadlines that vary by state and by law.
Can freelancers be victims of wage theft?
Usually not under wage laws, because those laws protect employees. A client who does not pay a freelancer is breaking the contract instead, so your remedy comes from the payment terms you agreed to. If you are really working as an employee under a contractor label, though, you may be misclassified and entitled to wage protections.
Can my employer fire me for reporting wage theft?
No. Federal and state wage laws prohibit retaliation against workers who complain about pay or file a claim. Retaliation is its own violation, and the Wage and Hour Division recovers back wages for it. If you are fired, demoted or have your hours cut after raising a pay issue, write down what happened and when, and include it in your claim.
Use this data
Every chart and card below is free to reuse under CC BY 4.0. Download what you need and link back to this page.
 Stat cards
 Key findings card
 Infographic
 Back wages recovered by the U.S. Wage and Hour Division, FY2013 to FY2025 (USD millions)
 Workers receiving back wages from the Wage and Hour Division, FY2013 to FY2025
 FLSA back wages by violation type, FY2025 (USD millions)
 Annual wages lost to minimum wage violations in the 10 most populous states (USD millions)
 Stolen wages recovered by channel, 2021 to 2023 (USD millions)
 Stolen wages recovered by channel, 2017 to 2020 combined (earlier EPI edition) (USD millions)
 Civil money penalties assessed by the Wage and Hour Division, FY2013 to FY2025 (USD millions)
 Wage and Hour Division enforcement, all laws, FY2013 to FY2025
 Minimum wage violations in the 10 most populous states (EPI, 2013-2015 data)
Embed the infographic
Free to share on your site, blog or slides under CC BY 4.0. Please keep the credit link.
Sources and method
Every number on this page comes from the sources below, each opened and read on or before October 18, 2026. A second, independent review checked every figure against its source and corrected anything that did not match. Figures that could not be confirmed were left out.
- U.S. Department of Labor, Wage and Hour Division, WHD Enforcement Statistics: All Acts (FY2013 to FY2025) (FY2025 data (fiscal year ended September 30, 2025))
- U.S. Department of Labor, Wage and Hour Division, WHD Enforcement Statistics: Fair Labor Standards Act (FY2013 to FY2025) (FY2025 data (fiscal year ended September 30, 2025))
- U.S. Department of Labor, Wage and Hour Division, WHD Data: Forging the Future, A Year of Progress Focused on the American Workforce (FY2025) (FY2025 edition)
- Economic Policy Institute, Employers steal billions from workers' paychecks each year (Cooper and Kroeger) (May 10, 2017 (CPS data averaged 2013 to 2015))
- Economic Policy Institute, More than $1.5 billion in stolen wages recovered for workers between 2021 and 2023 (Poydock and Zhang) (December 20, 2024)
- Economic Policy Institute, More than $3 billion in stolen wages recovered for workers between 2017 and 2020 (Mangundayao, McNicholas, Poydock and Sait) [earlier edition] (December 22, 2021)
Cite this page
ClauseAudit, “Wage Theft Statistics 2026: Back Wages Recovered and How Much Workers Lose”, updated October 18, 2026, https://clauseaudit.com/data/wage-theft-statistics. Free to reuse with a link back (CC BY 4.0).
This page summarises published data and law as checked on October 18, 2026. Figures are updated as new editions are released, and your own situation may differ. It is general information, not legal, tax or financial advice.