Small Business Statistics 2026: 160+ Numbers on Counts, Jobs, Survival, Cash Flow and Risk
By ClauseAudit Research · 166 statistics · 85 sources ·
What are the key small business statistics for 2026?
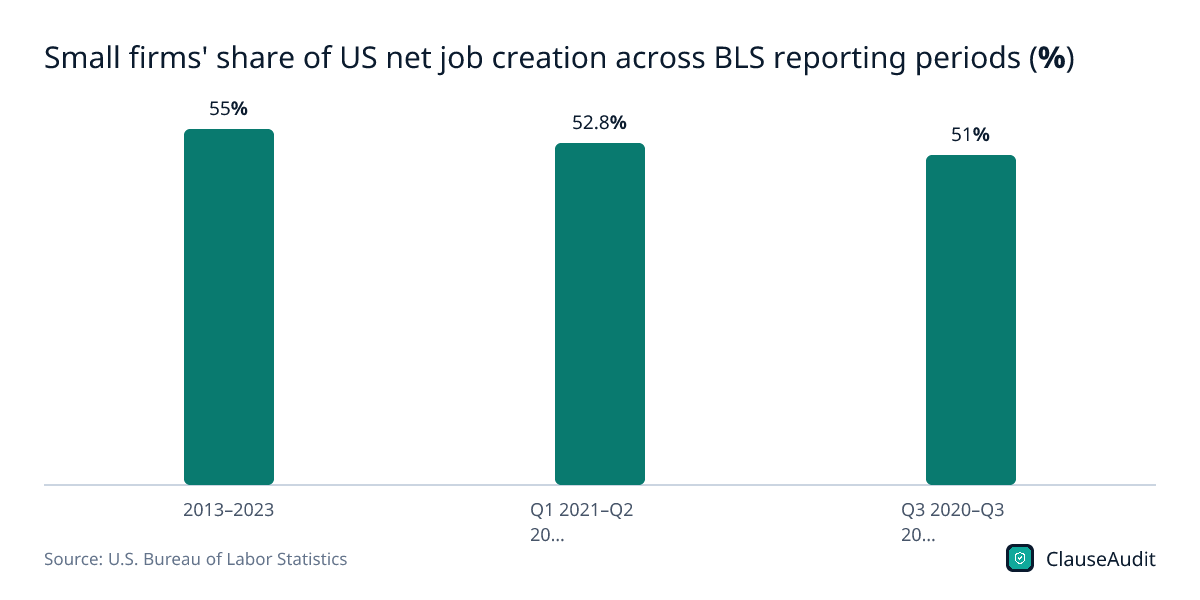
The SBA Office of Advocacy counts 36,207,130 US small businesses (2022 data), 99.9% of all firms, and 82.3% have no employees. Small firms produced 51% of net job creation from Q3 2020 to Q3 2025. Of establishments opened in the year to March 2020, 51.4% were still operating five years later, and 47% of small employer firms were profitable at the end of 2024.

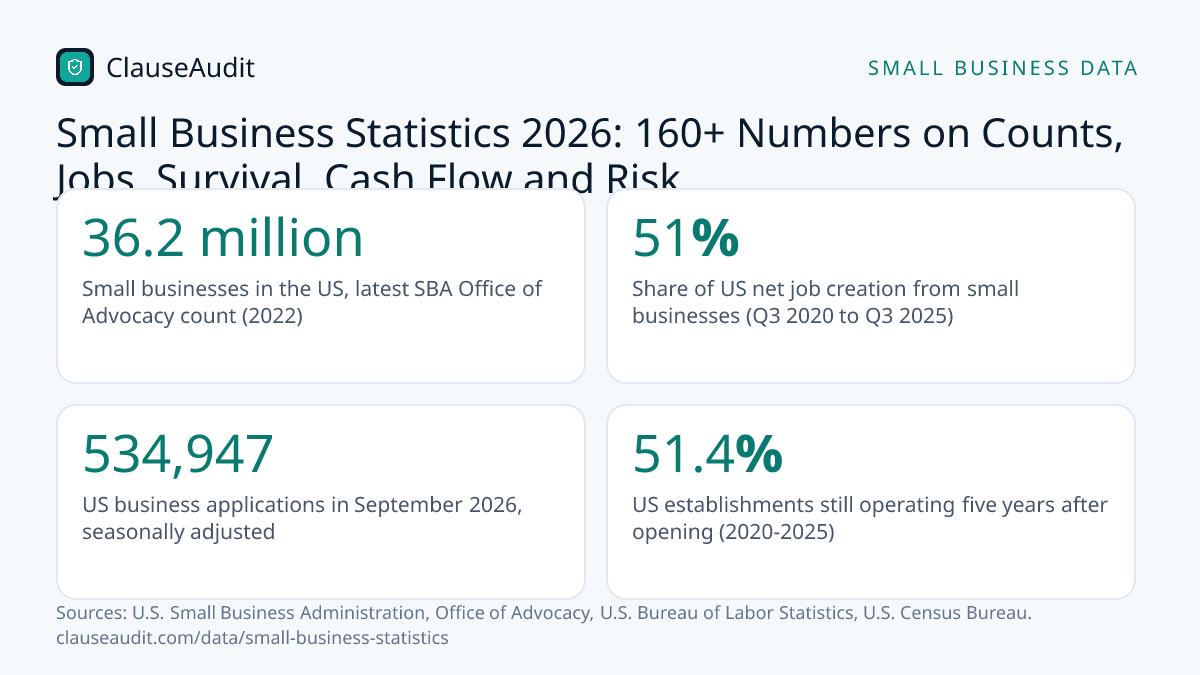
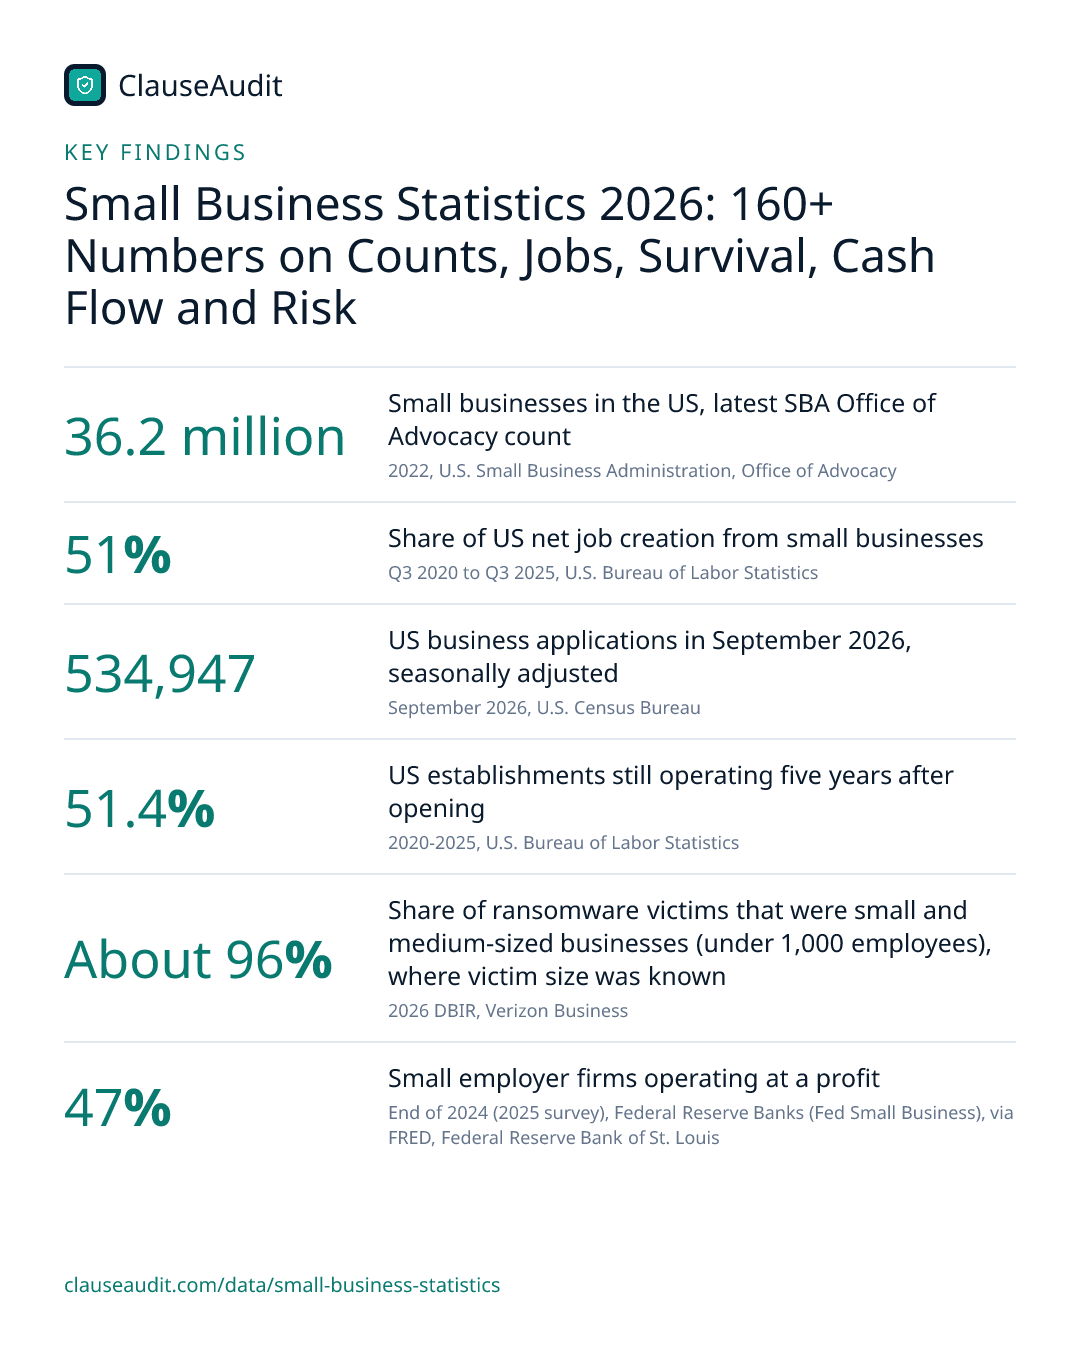
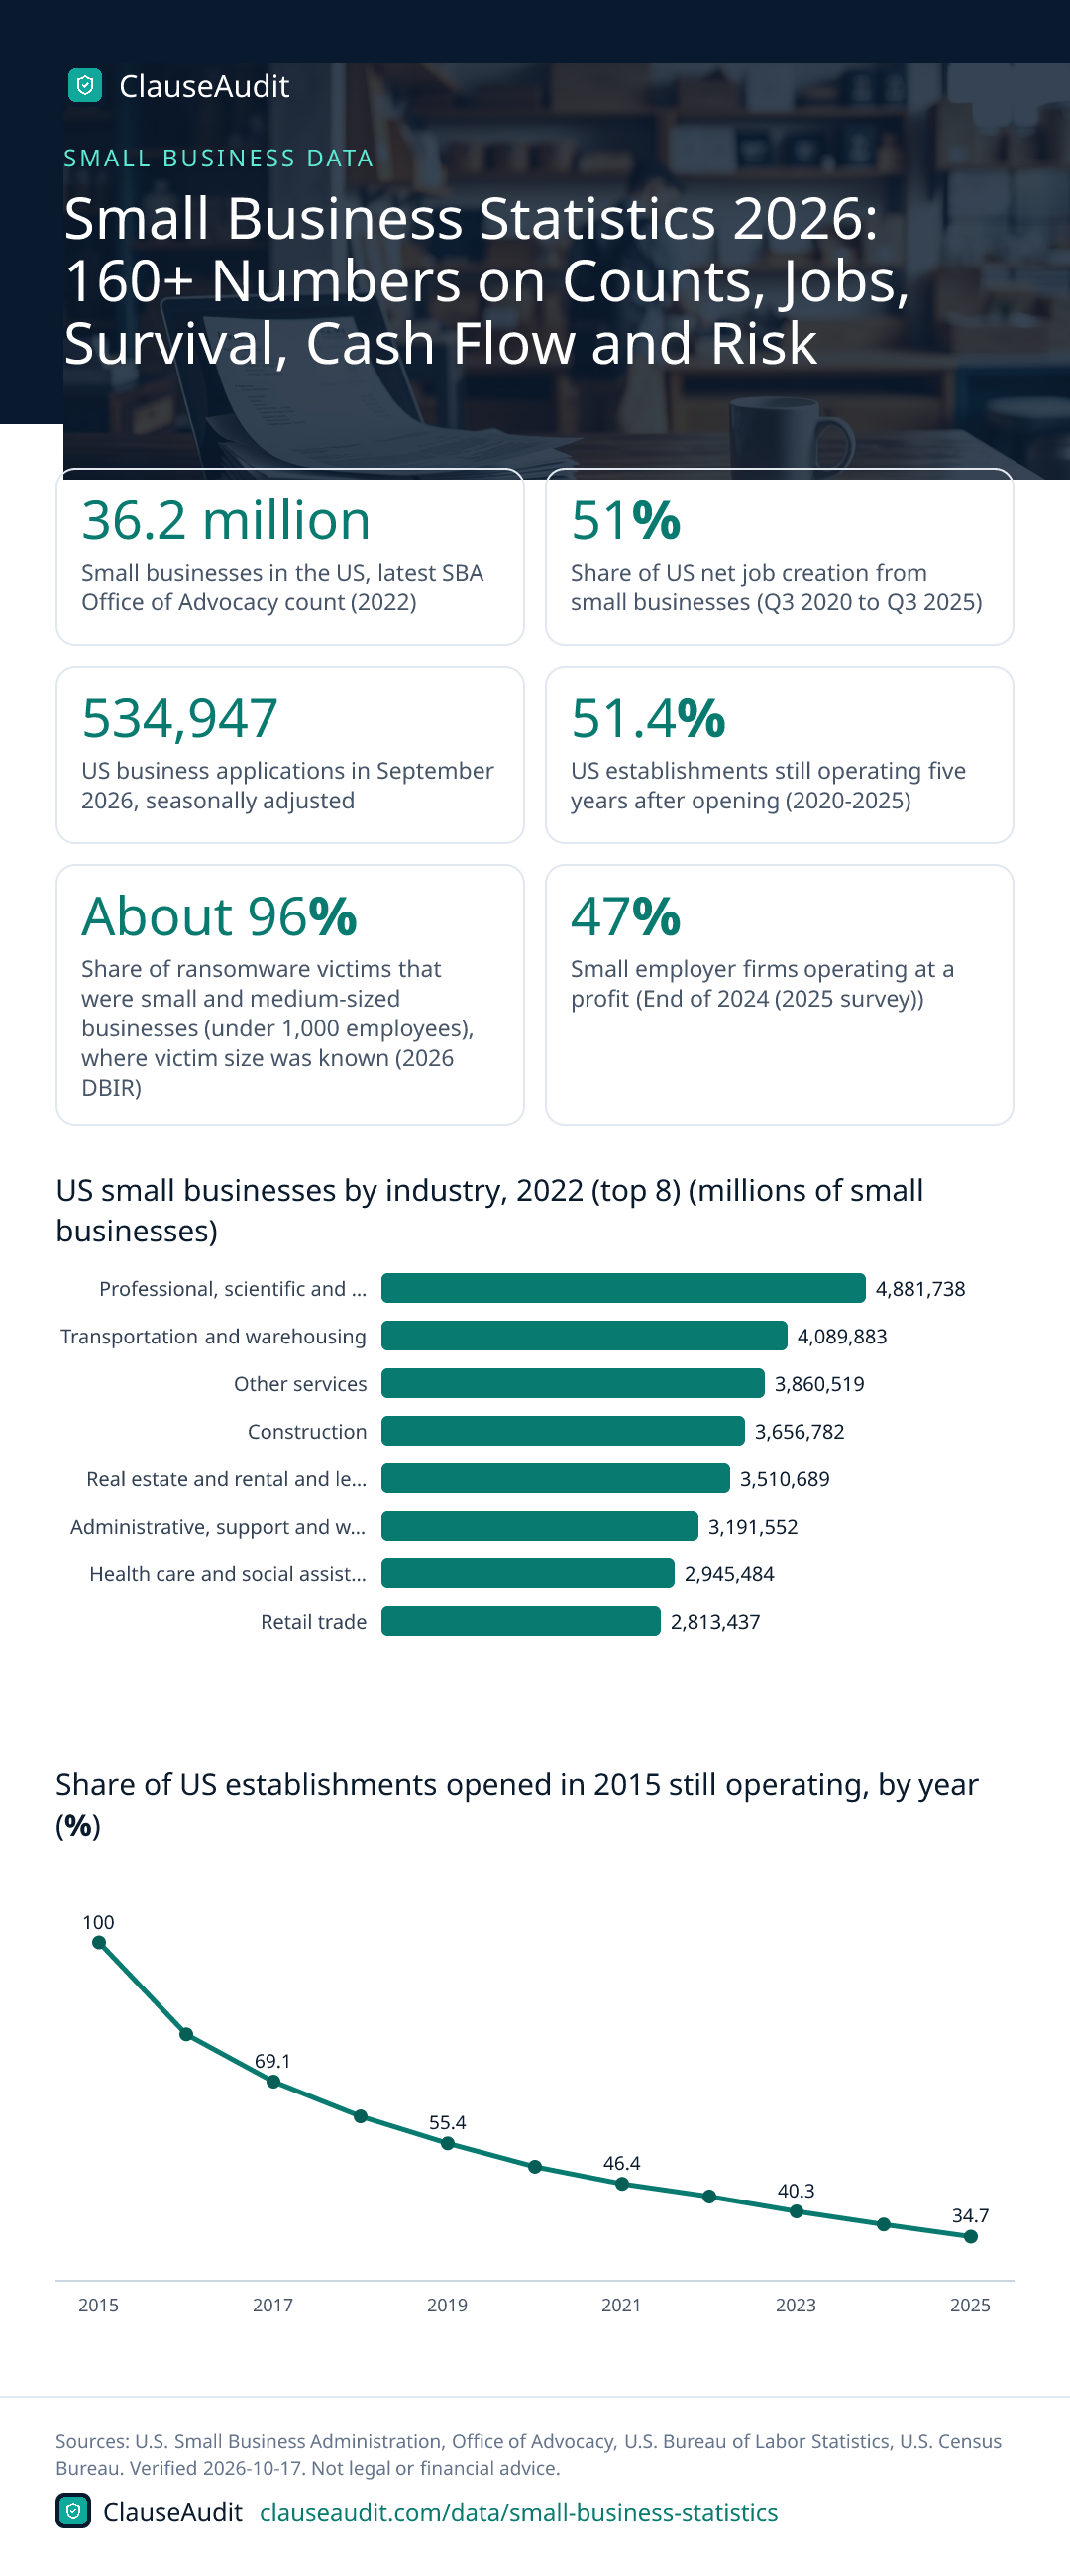
- Small businesses in the US, latest SBA Office of Advocacy count (2022, U.S. Small Business Administration, Office of Advocacy)
- 36.2 million
- Share of US net job creation from small businesses (Q3 2020 to Q3 2025, U.S. Bureau of Labor Statistics)
- 51%
- US business applications in September 2026, seasonally adjusted (September 2026, U.S. Census Bureau)
- 534,947
- US establishments still operating five years after opening (2020-2025, U.S. Bureau of Labor Statistics)
- 51.4%
- Share of ransomware victims that were small and medium-sized businesses (under 1,000 employees), where victim size was known (2026 DBIR, Verizon Business)
- About 96%
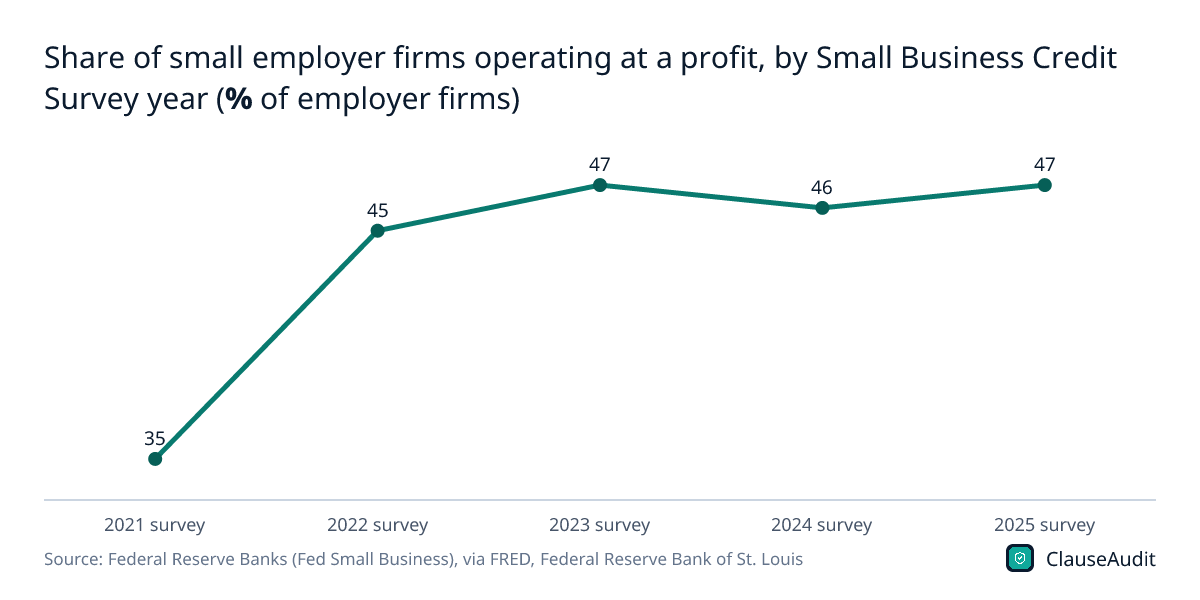
- Small employer firms operating at a profit (End of 2024 (2025 survey), Federal Reserve Banks (Fed Small Business), via FRED, Federal Reserve Bank of St. Louis)
- 47%
- Small employer firms citing uneven cash flow as a challenge (2025, Federal Reserve Banks)
- 50%
- US businesses using AI (Census BTOS national rate) (BTOS collection period ending May 3, 2026, U.S. Census Bureau)
- 19.8%
This page collects more than 160 small business statistics in twelve groups: how many small businesses exist, new business formation, jobs, survival and failure, revenue and profit, financing, cash flow and late payments, contracts and legal disputes, AI adoption, cybersecurity, owner demographics, and small firms outside the US, including India's MSME sector.
Most US figures come from the SBA Office of Advocacy, the Census Bureau, the Bureau of Labor Statistics, the Federal Reserve Banks' Small Business Credit Survey and the NFIB, with company and industry surveys labeled as such. Every number links to the page it came from, and the data was checked on October 17, 2026.
How Many Small Businesses Are There? US Small Business Count Statistics
Almost every US business is a small business under the SBA's research definition of fewer than 500 employees. These figures show how many there are, how many have staff, and which industries they cluster in.
- 36,207,130 small businesses operated in the US in 2022, the latest count in the SBA Office of Advocacy's February 2026 FAQ. (U.S. Small Business Administration, Office of Advocacy, Frequently Asked Questions About Small Business 2026, 2022)
- 99.9% of all US firms are small businesses, meaning independent businesses with fewer than 500 employees (2022 Census data). (U.S. Small Business Administration, Office of Advocacy, Frequently Asked Questions About Small Business 2026, 2022)
- 82.3% of US small businesses in 2022, or 29,811,495 firms, had no employees and were classed as nonemployer firms. (U.S. Small Business Administration, Office of Advocacy, Frequently Asked Questions About Small Business 2026, 2022)
- 6,395,635 US small businesses had paid employees in 2022, 17.7% of all small businesses. (U.S. Small Business Administration, Office of Advocacy, Frequently Asked Questions About Small Business 2026, 2022)
- 21,041 US businesses counted as large (500 or more employees) in 2022, against more than 36 million small ones. (U.S. Small Business Administration, Office of Advocacy, Frequently Asked Questions About Small Business 2026, 2022)
- Fewer than 500 employees is the SBA Office of Advocacy's research definition of a small business; program size standards vary by industry. (U.S. Small Business Administration, Office of Advocacy, Frequently Asked Questions About Small Business 2026, 2026)
- 36.4 million US employer and nonemployer businesses operated in 2023, with $50.0 trillion in combined receipts. (U.S. Census Bureau, Census Bureau Releases New Data on Business Owner Characteristics (2024 ABS and 2023 NES-D), 2023)
- 30.4 million US nonemployer businesses were counted in 2023, generating $1.8 trillion in receipts. (U.S. Census Bureau, Census Bureau Releases New Data on Business Owner Characteristics (2024 ABS and 2023 NES-D), 2023)
- 5.9 million US employer firms existed in reference year 2023, according to the Census Bureau's 2024 Annual Business Survey. (U.S. Census Bureau, Census Bureau Releases New Data on Business Owner Characteristics (2024 ABS and 2023 NES-D), 2023)
- 2.7% average annual growth in the number of US nonemployers from 2012 to 2023, versus 1.1% for employer businesses. (U.S. Census Bureau, Number of U.S. Nonemployers Grew Faster Than Employer Businesses Nearly Every Year From 2012 to 2023, 2012-2023)
- 31.1 million individual tax returns (31,125,909) reported nonfarm sole proprietorship activity in tax year 2023, up from 30,983,810 in tax year 2022. (Internal Revenue Service, Statistics of Income, Table 1. Nonfarm Sole Proprietorships: Business Receipts, Selected Deductions, Payroll, and Net Income, by Industrial Sectors, Tax Year 2023, Tax year 2023)
- 4.3 million small businesses operated in California in 2022, making up 99.8% of the state's businesses and employing 7.6 million people. (U.S. Small Business Administration, Office of Advocacy, 2025 Small Business Profile: California, 2022)
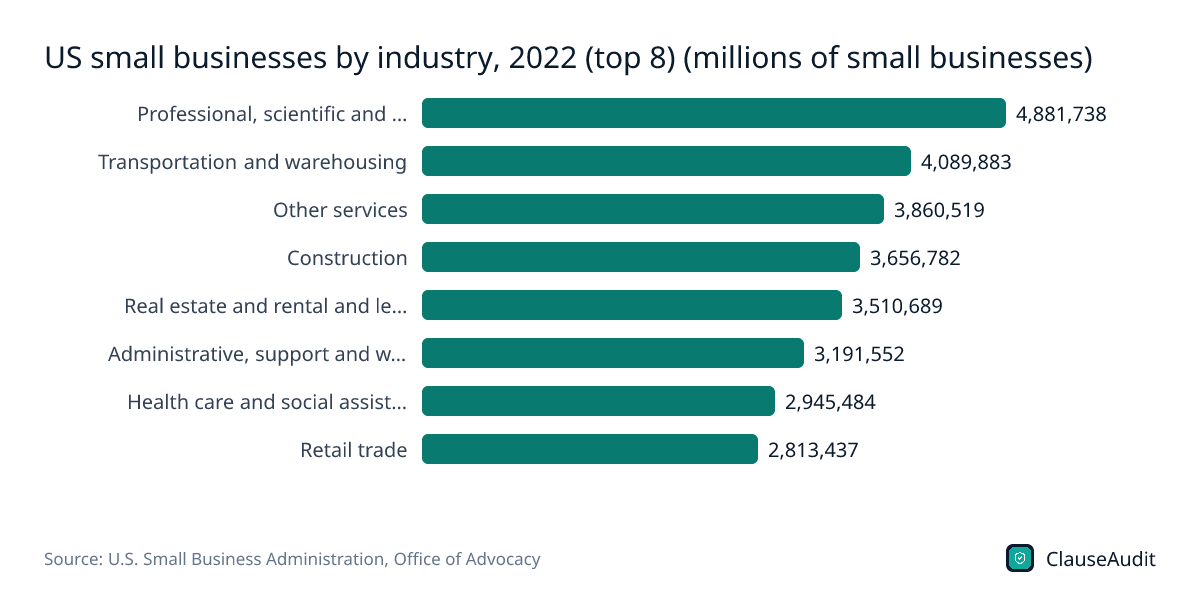
- 4,881,738 small businesses were in professional, scientific and technical services in 2022, the largest industry by small business count. (U.S. Small Business Administration, Office of Advocacy, 2025 Small Business Profile: United States, 2022)
Figure 1: US small businesses by industry, 2022 (top 8) (millions of small businesses)
Chart data
| Label | Value |
|---|---|
| Professional, scientific and technical services | 4,881,738 |
| Transportation and warehousing | 4,089,883 |
| Other services | 3,860,519 |
| Construction | 3,656,782 |
| Real estate and rental and leasing | 3,510,689 |
| Administrative, support and waste management | 3,191,552 |
| Health care and social assistance | 2,945,484 |
| Retail trade | 2,813,437 |
New Business Formation Statistics: Applications and Startups
Business applications filed with the IRS are the earliest signal of new firms. This section covers monthly and annual Census filings, startup rates and what new founders plan next.
- 534,947 seasonally adjusted US business applications were filed in September 2026, up 0.5% from August, according to Census Business Formation Statistics. (U.S. Census Bureau, Business Formation Statistics, September 2026 (Release CB26-163), September 2026)
- 147,331 high-propensity business applications, the filings most likely to turn into businesses with payroll, were submitted in September 2026, up 1.3% from August. (U.S. Census Bureau, Business Formation Statistics, September 2026 (Release CB26-163), September 2026)
- 35,786 business applications in September 2026 listed planned wages, a 4.3% rise from August that signals intent to hire employees. (U.S. Census Bureau, Business Formation Statistics, September 2026 (Release CB26-163), September 2026)
- 29,022 new employer startups are projected to form within four quarters from September 2026 applications, rising to 39,703 within eight quarters. (U.S. Census Bureau, Business Formation Statistics, September 2026 (Release CB26-163), September 2026 cohort)
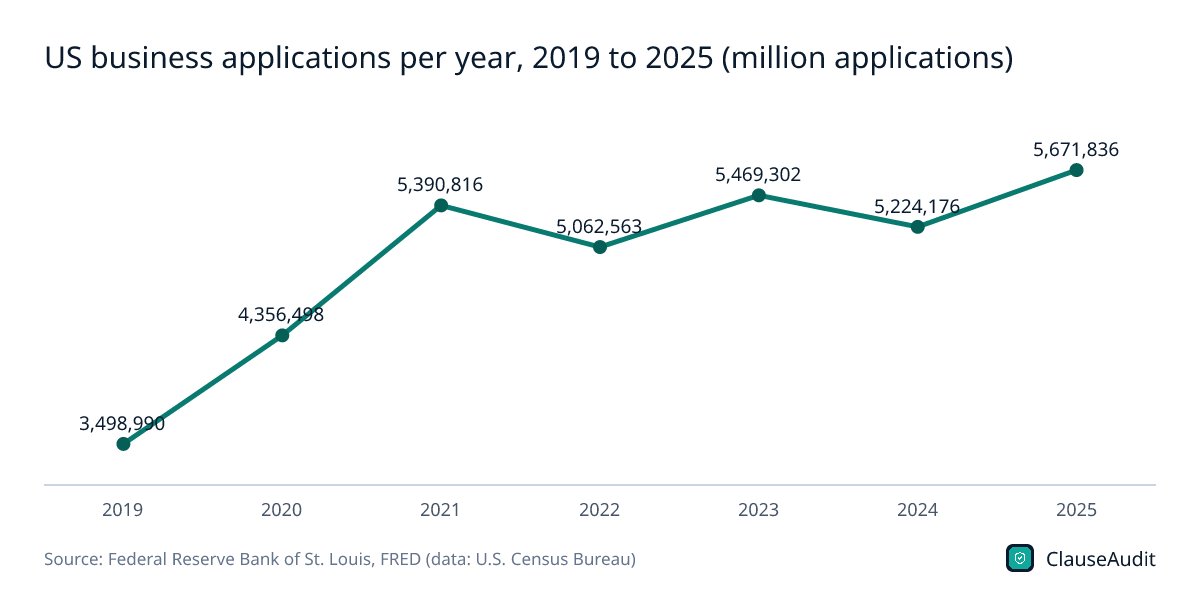
- 5,671,836 business applications were filed in the US in 2025, the highest annual total in the series since 2005 (sum of monthly, not seasonally adjusted counts). (Federal Reserve Bank of St. Louis, FRED (data: U.S. Census Bureau), Business Applications: Total for All NAICS in the United States (BABATOTALNSAUS), annual sum, 2025)
- 7.3 percent drop in seasonally adjusted business applications in December 2025 coincided with an IRS online EIN outage from December 30, 2025 to January 5, 2026. (U.S. Census Bureau, Business Formation Statistics, December 2025 (Release CB26-11), December 2025)
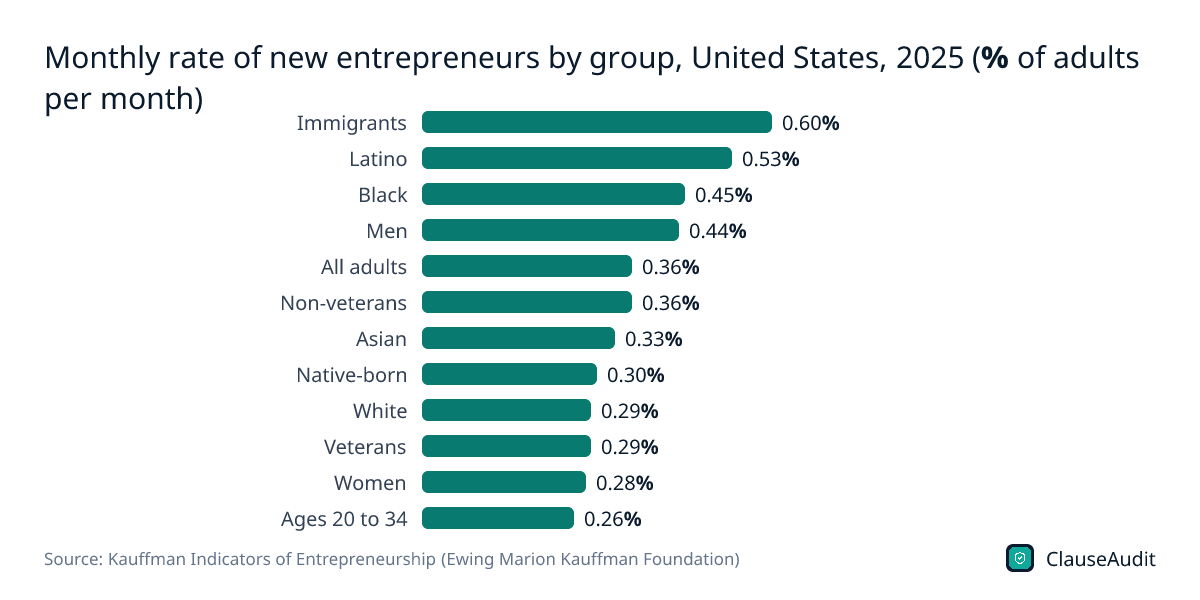
- 0.36 percent of US adults aged 20 to 64 who did not own a business started one in an average month of 2025, above pre-pandemic levels. (Kauffman Indicators of Entrepreneurship (Ewing Marion Kauffman Foundation), National Report on Early-Stage Entrepreneurship in the United States: 2025, 2025)
- 83.3 percent of new entrepreneurs in 2025 started by opportunity rather than after unemployment, up from 69.8% in 2020 but below 86.9% in 2019. (Kauffman Indicators of Entrepreneurship (Ewing Marion Kauffman Foundation), National Report on Early-Stage Entrepreneurship in the United States: 2025, 2025)
- 77.9 percent was the startup early survival rate in 2025, slightly lower than the previous year and below pre-pandemic levels. (Kauffman Indicators of Entrepreneurship (Ewing Marion Kauffman Foundation), National Report on Early-Stage Entrepreneurship in the United States: 2025, 2025)
- 5.3 jobs per 1,000 people were created by startups in their first year in 2025, unchanged from the previous year and above pre-pandemic levels. (Kauffman Indicators of Entrepreneurship (Ewing Marion Kauffman Foundation), National Report on Early-Stage Entrepreneurship in the United States: 2025, 2025)
- 338,000 private-sector establishment births occurred in the fourth quarter of 2025, accounting for 1,006,000 jobs. (U.S. Bureau of Labor Statistics, Business Employment Dynamics - Fourth Quarter 2025, Q4 2025)
- 78% of new business owners who launched in 2025 needed some form of startup financing, with personal savings the most common source. (Gusto, via PR Newswire, Gusto 2026 New Business Formation Report (press release), 2025 founders)
- 44% of new businesses plan to add employees in 2026, a three-year high in hiring plans among founders surveyed by Gusto. (Gusto, via PR Newswire, Gusto 2026 New Business Formation Report (press release), 2026 plans)
- 16.9% was the business entry rate in Australia in 2025-26, with 460,461 new entries, per the Australian Bureau of Statistics. (Australian Bureau of Statistics, Counts of Australian Businesses, including Entries and Exits, July 2022 - June 2026, 2025-26)
Figure 2: US business applications per year, 2019 to 2025 (million applications)
Chart data
| Label | Value (million applications) |
|---|---|
| 2019 | 3,498,990 |
| 2020 | 4,356,498 |
| 2021 | 5,390,816 |
| 2022 | 5,062,563 |
| 2023 | 5,469,302 |
| 2024 | 5,224,176 |
| 2025 | 5,671,836 |
Small Business Employment and Job Creation Statistics
Small firms hold slightly less than half of private employment but account for most of the churn in hiring and job losses. These numbers cover job creation, current hiring and labor shortages.
- 51% of total US net job creation from Q3 2020 to Q3 2025 came from small businesses with fewer than 250 employees. (U.S. Bureau of Labor Statistics, Small firms accounted for half of net job creation, third quarter 2020–third quarter 2025 (The Economics Daily), Q3 2020 to Q3 2025)
- 71% of gross job gains and gross job losses since 1993 have come from small businesses, even though they hold slightly less than half of private employment. (U.S. Bureau of Labor Statistics, Small firms accounted for half of net job creation, third quarter 2020–third quarter 2025 (The Economics Daily), 1993 to 2025)
- 52.8% of US net job creation between Q1 2021 and Q2 2024 came from firms with 249 or fewer employees, according to BLS. (U.S. Bureau of Labor Statistics, Small businesses continue to outpace large businesses in job creation (The Economics Daily), Q1 2021 to Q2 2024)
- 3 years of uninterrupted net employment gains were recorded by small firms, from June 2020 until the third quarter of 2023. (U.S. Bureau of Labor Statistics, Small businesses continue to outpace large businesses in job creation (The Economics Daily), June 2020 to Q3 2023)
- 98.5% of the 329,000 net US jobs added in the second quarter of 2022 came from small firms, which accounted for 324,000 of them. (U.S. Bureau of Labor Statistics, Small businesses continue to outpace large businesses in job creation (The Economics Daily), Q2 2022)
- 55% of the net jobs created in the US from 2013 to 2023 were added by small businesses with 249 or fewer employees. (U.S. Bureau of Labor Statistics, Small businesses contributed 55 percent of the total net job creation from 2013 to 2023 (The Economics Daily), 2013 to 2023)
- 46% of the covered US workforce was employed, on average, by small businesses (249 or fewer employees) over the ten years to 2023. (U.S. Bureau of Labor Statistics, Small businesses contributed 55 percent of the total net job creation from 2013 to 2023 (The Economics Daily), 2013 to 2023)
- 19% of net job gains in the post-pandemic recovery went to firms with fewer than ten employees, versus about 5% after the Great Recession. (Federal Reserve Bank of Chicago, Small business employment in the pandemic era and beyond (Chicago Fed Letter No. 509), 2020 to 2024)
- 1.95 employees was the average size of US firms with one to four employees in 2024, down from 2.15 in 1993. (Federal Reserve Bank of Chicago, Small business employment in the pandemic era and beyond (Chicago Fed Letter No. 509), 2024)
- 23,000 net private jobs were added by small establishments (1 to 49 employees) in September 2026, out of 90,000 total, per ADP. (ADP Research, ADP National Employment Report: Private-Sector Employment Increased by 90,000 Jobs in September, September 2026)
- 99.15 was the Paychex Small Business Jobs Index in September 2026, after the pace of job growth rose 0.02 percentage points. (Paychex, Small Business Employment Watch, September 2026, September 2026)
- 32% of small business owners reported job openings they could not fill in September 2026, 8 points above the historical average. (National Federation of Independent Business (NFIB), NFIB Small Business Economic Trends, September 2026, September 2026)
- 45% of small business owners (87% of those hiring) reported few or no qualified applicants for open positions in September 2026. (National Federation of Independent Business (NFIB), NFIB Small Business Economic Trends, September 2026, September 2026)
- 60 to 70% of employment worldwide comes from micro, small and medium-sized enterprises, which also make up about 50% of global GDP, per the United Nations. (United Nations, Micro-, Small and Medium-sized Enterprises Day, Current (UN MSME Day page))
- 54% of persons employed in the economic sectors covered by Germany's statistics office worked in small and medium-sized enterprises in 2024. (Federal Statistical Office of Germany (Destatis), Small and medium-sized enterprises, 2024)
Small Business Survival and Failure Rate Statistics
BLS follows each year's cohort of new private-sector establishments over time, which makes it the standard source on survival. This section covers one-, five- and ten-year survival, industry gaps, bankruptcies and comparisons with the UK, EU and Australia.
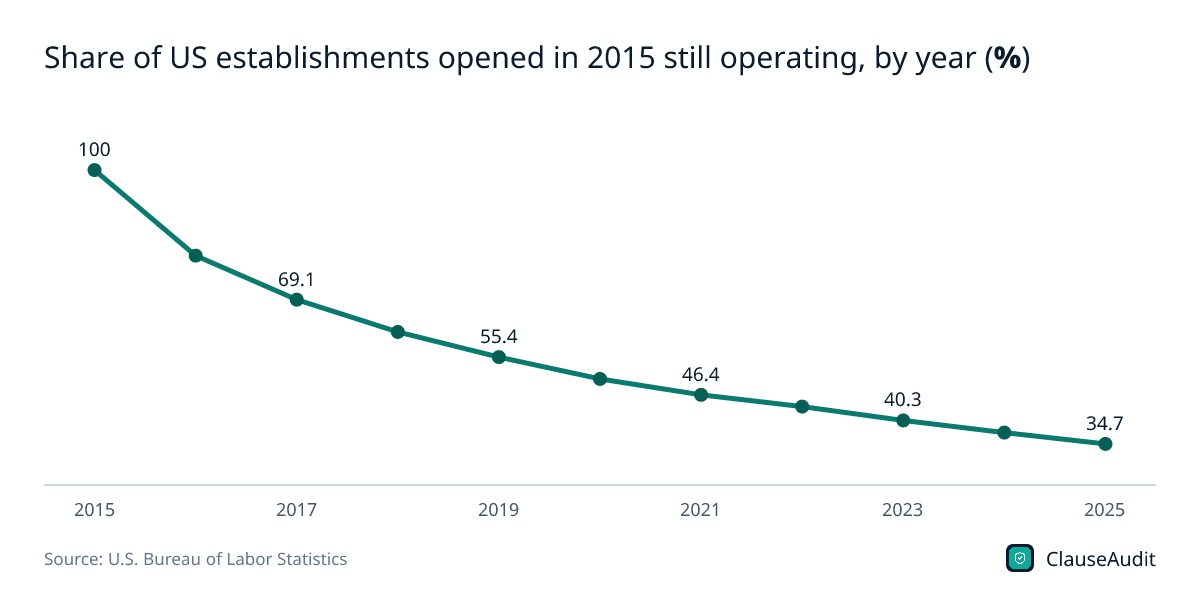
- 34.7% of US private-sector establishments opened in the year to March 2015 were still operating in March 2025. (U.S. Bureau of Labor Statistics, Business Employment Dynamics: Survival of private sector establishments by opening year (Table 7, total private), 2015-2025)
- 77.9% of US establishments opened in the year to March 2024 survived their first year to March 2025. (U.S. Bureau of Labor Statistics, Business Employment Dynamics: Survival of private sector establishments by opening year (Table 7, total private), 2024-2025)
- 51.4% of US establishments opened in the year to March 2020 were still operating five years later in March 2025. (U.S. Bureau of Labor Statistics, Business Employment Dynamics: Survival of private sector establishments by opening year (Table 7, total private), 2020-2025)
- 980,333 new US private-sector establishments opened in the year ended March 2025, per BLS Business Employment Dynamics. (U.S. Bureau of Labor Statistics, Business Employment Dynamics: Survival of private sector establishments by opening year (Table 7, total private), Year ended March 2025)
- 67.7% of new US employer establishments survived at least two years on average from 1994 to 2022, according to SBA Office of Advocacy analysis of BLS data. (U.S. Small Business Administration, Office of Advocacy, Frequently Asked Questions About Small Business 2026, 1994-2022)
- 49.2% average five-year survival rate for new US employer establishments from 1994 to 2022; the ten-year rate was 33.9%. (U.S. Small Business Administration, Office of Advocacy, Frequently Asked Questions About Small Business 2026, 1994-2022)
- 69.5% of US establishments that reach five years go on to reach ten, so survival odds improve with age (1994-2022 average). (U.S. Small Business Administration, Office of Advocacy, Frequently Asked Questions About Small Business 2026, 1994-2022)
- 53.0% of agriculture, forestry, fishing and hunting establishments that opened in the year ended March 2015 were still operating in March 2025, the highest 10-year survival rate of the 19 private-sector industry tables BLS publishes. (U.S. Bureau of Labor Statistics, Business Employment Dynamics: Survival of private sector establishments by opening year (Table 7, Agriculture, Forestry, Fishing and Hunting), 2015-2025)
- 24.5% of mining, quarrying, and oil and gas extraction establishments that opened in the year ended March 2015 were still operating in March 2025, the lowest 10-year survival rate of the 19 private-sector industry tables. (U.S. Bureau of Labor Statistics, Business Employment Dynamics: Survival of private sector establishments by opening year (Table 7, Mining, Quarrying, and Oil and Gas Extraction), 2015-2025)
- 26,941 US business bankruptcy filings in the 12 months ending June 30, 2026, up 16.9% from 23,043 a year earlier. (Administrative Office of the U.S. Courts, Bankruptcies Rise 12.2 Percent, Year ending June 30, 2026)
- 38.4% of UK businesses born in 2019 were still active in 2024, the ONS five-year survival rate. (Office for National Statistics (UK), Business demography, UK: 2024, 2019-2024)
- 280,000 UK business deaths in 2024, down from 310,000 in 2023, cutting the business death rate from 10.8% to 9.8%. (Office for National Statistics (UK), Business demography, UK: 2024, 2024)
- 9.2% preliminary EU enterprise death rate in 2024, against an enterprise birth rate of 10.4%. (Eurostat, Business demography statistics (Statistics Explained), 2024)
- 13.8% was the business exit rate in Australia in 2025-26, with 375,331 businesses ceasing to trade, per the Australian Bureau of Statistics. (Australian Bureau of Statistics, Counts of Australian Businesses, including Entries and Exits, July 2022 - June 2026, 2025-26)
Figure 4: Share of US establishments opened in 2015 still operating, by year (%)
Chart data
| Label | Value (%) |
|---|---|
| 2015 | 100 |
| 2016 | 79.6 |
| 2017 | 69.1 |
| 2018 | 61.4 |
| 2019 | 55.4 |
| 2020 | 50.2 |
| 2021 | 46.4 |
| 2022 | 43.6 |
| 2023 | 40.3 |
| 2024 | 37.4 |
| 2025 | 34.7 |
Small Business Revenue and Profitability Statistics
Profit and revenue figures come mostly from the Federal Reserve's Small Business Credit Survey and monthly owner surveys. They show a recovery since 2021 alongside pressure from input costs and tariffs.
- 47% of small employer firms were operating at a profit at the end of 2024, per the Fed's 2025 survey, up from 35% in the 2021 survey. (Federal Reserve Banks (Fed Small Business), via FRED, Federal Reserve Bank of St. Louis, Small Business Credit Survey: Operated at a Profit: Employer Firms (SBCSS7B0V0FRB), End of 2024 (2025 survey))
- 39 to 33 was the drop in the Fed's revenue expectations index between the 2024 and 2025 surveys, the lowest since the 2020 survey. (Federal Reserve Banks (Fed Small Business), 2026 Report on Employer Firms: Findings from the 2025 Small Business Credit Survey, 2025 survey)
- Forty-eight percent of small employer firms sourced at least some of their inputs from outside the United States in 2024, and 14% did so for over half. (Federal Reserve Banks (Fed Small Business), 2026 Report on Employer Firms: Findings from the 2025 Small Business Credit Survey, 2024)
- Seventy-six percent of firms facing higher input prices passed at least some of the increase on to customers, while 60% absorbed some of it. (Federal Reserve Banks (Fed Small Business), 2026 Report on Employer Firms: Findings from the 2025 Small Business Credit Survey, 2025 survey)
- 69% of retail small businesses cited tariff-related cost increases as a financial challenge, as did 62% of manufacturers. (Federal Reserve Banks (Fed Small Business), 2026 Report on Employer Firms: Findings from the 2025 Small Business Credit Survey, 2025 survey)
- net -20% was the seasonally adjusted net share of owners reporting positive profit trends in September 2026, down 1 point from August. (National Federation of Independent Business (NFIB), NFIB Small Business Economic Trends, September 2026, September 2026)
- 34% of owners reporting lower profits in September 2026 blamed weaker sales, and 24% cited rising material costs. (National Federation of Independent Business (NFIB), NFIB Small Business Economic Trends, September 2026, September 2026)
- net -8% was the seasonally adjusted net share of owners reporting higher nominal sales in the past three months in September 2026, up 1 point. (National Federation of Independent Business (NFIB), NFIB Small Business Economic Trends, September 2026, September 2026)
- 74% of US small and mid-sized business owners expected revenue to increase over the next 12 months in Bank of America's September 2025 survey. (Bank of America, 2025 Bank of America Business Owner Report (press release), September 2025 survey)
- 76% of US small business owners expected revenue growth in 2026, and 76% anticipated higher profits, in JPMorganChase's November 2025 survey. (JPMorganChase, 2026 Business Leaders Outlook (press release), November 2025 survey)
- 62% of small businesses expected increased revenue in the next year in Q3 2026, down from 66% the prior quarter and 69% a year earlier. (U.S. Chamber of Commerce, Q3 2026 Justworks & U.S. Chamber of Commerce Small Business Index: Key Findings, Q3 2026)
- 45% of small business CEOs projected higher profitability over the next 12 months in September 2026, while 16% projected lower profitability. (Vistage Worldwide, WSJ/Vistage Small Business CEO Survey, September 2026, September 2026)
- 61% of small businesses reported relatively unpredictable revenue or expense payments in the past six months in Chase's January 2026 survey. (Chase (JPMorganChase), Small Business Pulse: Profitability up, payroll growth down in January 2026, January 2026)
- 58% of self-employed US adults said their income varied from month to month in 2025, versus 28% of people who worked for someone else. (Board of Governors of the Federal Reserve System, Economic Well-Being of U.S. Households in 2025, October 2025 survey)
- Net 3% of euro area SMEs reported higher turnover in Q2 2026, up from a net -7% in the previous quarter, per the ECB's SAFE survey. (European Central Bank, Survey on the Access to Finance of Enterprises in the euro area, second quarter of 2026, Q2 2026)
Figure 5: Share of small employer firms operating at a profit, by Small Business Credit Survey year (% of employer firms)
Chart data
| Label | Value (% of employer firms) |
|---|---|
| 2021 survey | 35 |
| 2022 survey | 45 |
| 2023 survey | 47 |
| 2024 survey | 46 |
| 2025 survey | 47 |
Small Business Financing and Loan Approval Statistics
Most small employer firms look for some kind of financing each year. These figures cover application rates, approvals by lender type, SBA programs and current loan conditions.
- 60% of US small employer firms applied for financing of any kind in the 12 months before the 2025 Small Business Credit Survey. (Federal Reserve Banks, Small Business Credit Survey: 2026 Report on Employer Firms, 2025 survey)
- 42% of small business financing applicants received the full amount they sought, while 36% got some or most and 22% received nothing. (Federal Reserve Banks, Small Business Credit Survey: 2026 Report on Employer Firms, 2025 survey)
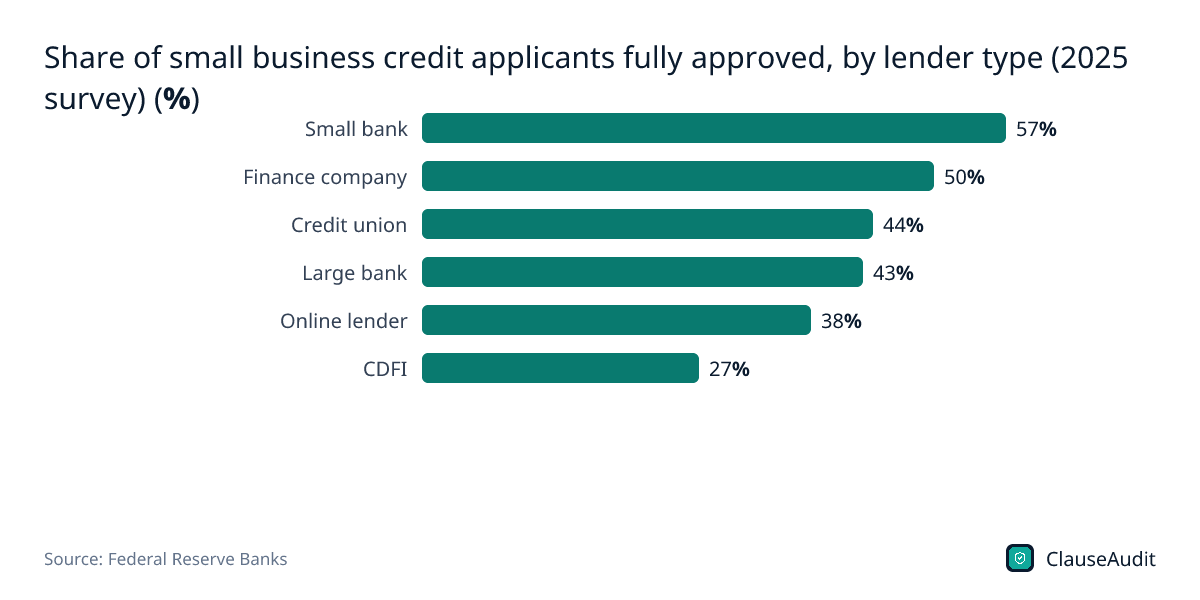
- 57% of loan, credit line or cash advance applicants at small banks were fully approved, the highest rate of any lender type. (Federal Reserve Banks, Small Business Credit Survey: 2026 Report on Employer Firms, 2025 survey)
- 29% of small business credit applicants sought financing at online fintech lenders in the 2025 survey, up from 17% in the 2020 survey. (Federal Reserve Banks, Small Business Credit Survey: 2026 Report on Employer Firms, 2025 survey)
- $44.8 billion in 7(a) and 504 loans was guaranteed by the SBA in fiscal 2025, across 84,400 small business loans. (U.S. Small Business Administration, SBA delivers record capital to small businesses in FY25 (News release 25-83), FY2025)
- $53 billion in combined private capital and SBA leverage was reached by the SBIC program in FY2025, up from $46 billion in FY2024. (U.S. Small Business Administration, SBA's SBIC program delivers record capital in FY25 (News release 26-07), FY2025)
- 8.5% year-over-year growth in total new small business loan balances was reported by banks in Q2 2026. (Federal Reserve Bank of Kansas City, Small Business Lending Survey, Q2 2026, Q2 2026)
- 8% of banks, on net, reported tightening credit standards for small business loans in Q2 2026. (Federal Reserve Bank of Kansas City, Small Business Lending Survey, Q2 2026, Q2 2026)
- 8.2% was the average interest rate small business owners paid on short-maturity loans in September 2026, near the 8.3% historical average. (National Federation of Independent Business (NFIB), NFIB Small Business Economic Trends, September 2026, September 2026)
- 22% of small business owners reported borrowing regularly in September 2026, below the historical average of 34%. (National Federation of Independent Business (NFIB), NFIB Small Business Economic Trends, September 2026, September 2026)
- About half of US banks were using or considering fintech in small business lending in the FDIC's 2022 survey, published in 2024. (Federal Deposit Insurance Corporation, FDIC Issues 2024 Small Business Lending Survey Report (press release), 2022 survey)
- Up to $10 of private investment is expected for every $1 of SSBCI Capital Program funding, part of Treasury's nearly $10 billion small business program. (U.S. Department of the Treasury, State Small Business Credit Initiative (SSBCI), Program launched 2021)
Figure 6: Share of small business credit applicants fully approved, by lender type (2025 survey) (%)
Chart data
| Label | Value |
|---|---|
| Small bank | 57% |
| Finance company | 50% |
| Credit union | 44% |
| Large bank | 43% |
| Online lender | 38% |
| CDFI | 27% |
Small Business Cash Flow and Late Payment Statistics
Cash flow is one of the most common financial problems small employers report, and slow-paying customers are a large part of it. This section covers payment times, overdue invoices and late-payment data from the US, UK and India.
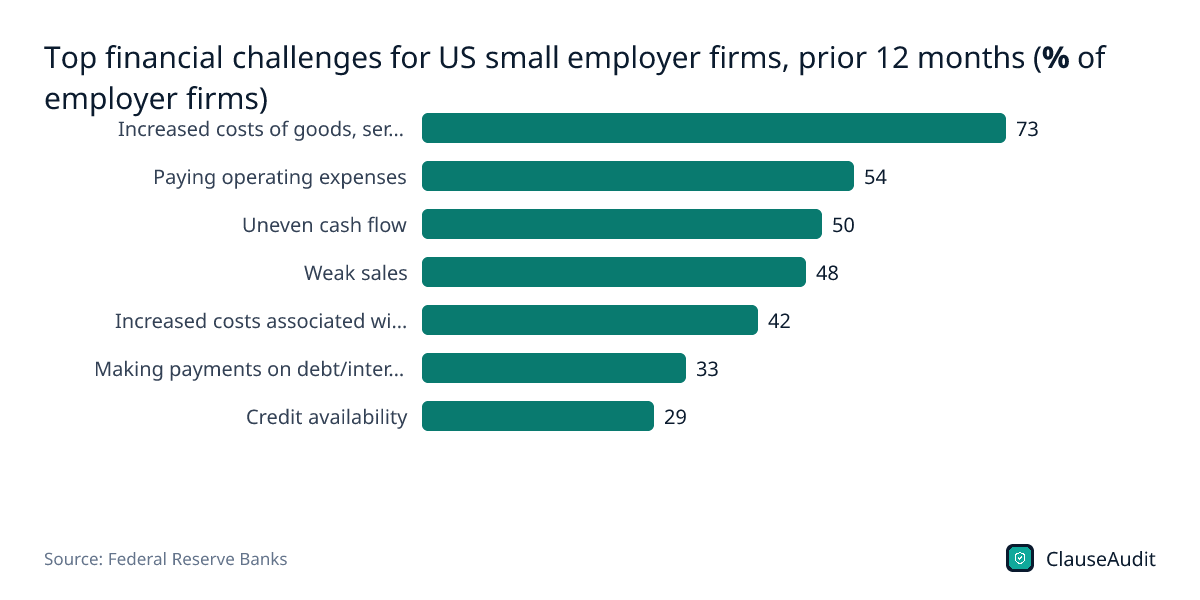
- 50% of US small employer firms reported uneven cash flow, including collecting on receivables, as a financial challenge in the prior 12 months. (Federal Reserve Banks, Small Business Credit Survey: 2026 Report on Employer Firms, 2025)
- 54% of US small employer firms said paying operating expenses such as payroll, rent and inventory was a financial challenge. (Federal Reserve Banks, Small Business Credit Survey: 2026 Report on Employer Firms, 2025)
- 24% of US small employer firms with financial challenges responded by making a late payment or not paying a bill. (Federal Reserve Banks, Small Business Credit Survey: 2026 Report on Employer Firms, 2025)
- 59% of US small businesses have at least some invoices overdue by 30 days or more, up from 47% a year earlier. (Intuit QuickBooks, 2026 Small Business Late Payments Report, 2026)
- $17.7K is the average amount owed to US small businesses that have unpaid invoices, roughly in line with $17.5K the year before. (Intuit QuickBooks, 2026 Small Business Late Payments Report, 2026)
- 38% of US small businesses with overdue invoices say they have grown more reliant on credit cards, versus 21% without overdue invoices. (Intuit QuickBooks, 2026 Small Business Late Payments Report, 2026)
- 29.3 days was the average wait for US small businesses to get invoices paid in the June 2026 quarter, up from 28.6 days. (Xero, Xero Small Business Insights: United States, June 2026 quarter, Q2 2026)
- 8.5 days was the average time US small business invoices were paid past their due date in the June 2026 quarter, an improvement of 0.5 days. (Xero, Xero Small Business Insights: United States, June 2026 quarter, Q2 2026)
- 22% of B2B receivables are affected by late payment on average among US companies surveyed by credit insurer Atradius. (Atradius, B2B payment practices trends in the US 2026, 2026)
- £11 billion is how much late payments cost the UK economy each year, according to the UK's Office of the Small Business Commissioner. (Office of the Small Business Commissioner (UK), Office of the Small Business Commissioner (home page), 2026)
- 15% of invoices were paid late by large UK businesses in 2025, down from 25% in 2018, per official payment practices statistics. (Office of the Small Business Commissioner (UK), Payment Times Are Improving As New Legislation Dawns, 2025)
- 2,56,892 delayed-payment applications have been filed by Indian micro and small enterprises on the government's MSME Samadhaan portal. (Ministry of Micro, Small and Medium Enterprises, Government of India, MSME Samadhaan: Delayed Payment Monitoring System dashboard, Cumulative to October 2026)
- Rs 31,720.61 crore is the amount payable in delayed-payment cases filed with India's MSE Facilitation Councils, across 1,13,259 cases. (Ministry of Micro, Small and Medium Enterprises, Government of India, MSME Samadhaan: Delayed Payment Monitoring System dashboard, Cumulative to October 2026)
Figure 7: Top financial challenges for US small employer firms, prior 12 months (% of employer firms)
Chart data
| Label | Value |
|---|---|
| Increased costs of goods, services and/or wages | 73 |
| Paying operating expenses | 54 |
| Uneven cash flow | 50 |
| Weak sales | 48 |
| Increased costs associated with tariffs | 42 |
| Making payments on debt/interest rates | 33 |
| Credit availability | 29 |
Small Business Contract, Legal Dispute and Compliance Statistics
Contracts, taxes and regulation take time and money away from running the business. These figures cover compliance burden, arbitration and court caseloads, and how often small businesses face legal problems.
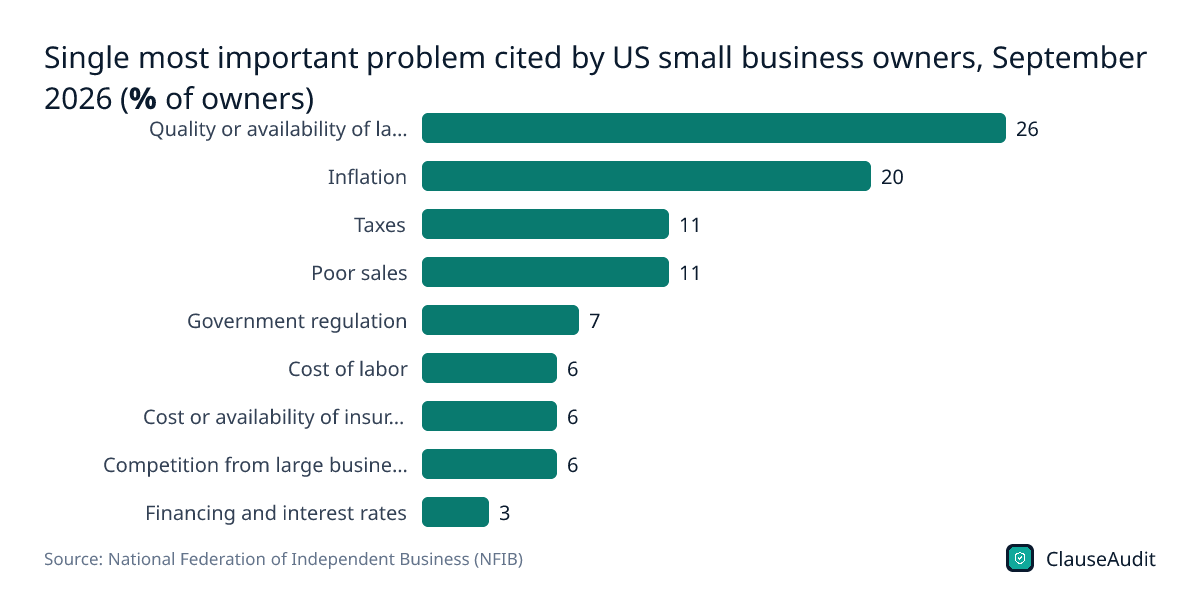
- 11% of small business owners named taxes their single most important problem in September 2026, down 5 points and the lowest since December 2022. (National Federation of Independent Business (NFIB), NFIB Small Business Economic Trends, September 2026, September 2026)
- 7% of small business owners named government regulations and red tape their top problem in September 2026, down 2 points from August. (National Federation of Independent Business (NFIB), NFIB Small Business Economic Trends, September 2026, September 2026)
- 40 hours a year is the IRS average tax compliance time for small taxable corporations, plus $3,900 out of pocket, versus 610 hours for large corporations. (Internal Revenue Service, Instructions for Form 1120 (2025): Estimates of Taxpayer Burden, 2025 returns)
- $5,200 is the average monetized tax compliance burden for small partnerships, which spend 50 hours and $3,300 out of pocket, per IRS estimates. (Internal Revenue Service, Instructions for Form 1120 (2025): Estimates of Taxpayer Burden, 2025 returns)
- 6,822 small business case filings were handled by the American Arbitration Association in 2024. (American Arbitration Association, Small Business Dispute Resolution, 2024)
- 5.1 months was the median time to an arbitration award for AAA cases with claims up to $100,000 in 2024, versus 31.6 months in U.S. District Court. (American Arbitration Association, Small Business Dispute Resolution, 2024)
- $29 billion in business-to-business claims and counterclaims were filed with the American Arbitration Association in 2025, out of 580,000 total cases. (American Arbitration Association, American Arbitration Association: Why AAA? (caseload data), 2025)
- 13 percent drop in contract action filings in U.S. district courts in the 12 months to March 2025, down 3,426 cases, as insurance cases fell 28%. (Administrative Office of the U.S. Courts, Federal Judicial Caseload Statistics 2025, 12 months ending March 31, 2025)
- 29% of US small businesses said they were spending increased time or resources on compliance in Q3 2026, down from 37% the previous quarter. (U.S. Chamber of Commerce, Q3 2026 Justworks & U.S. Chamber of Commerce Small Business Index: Key Findings, Q3 2026)
- 47% of UK SME employers cited regulations and red tape as an obstacle to business success in 2025, up 3 points on 2024 and 6 points on 2023, the third most cited obstacle. (UK Department for Business and Trade (GOV.UK), Longitudinal Small Business Survey 2025: SME employers (businesses with 1 to 249 employees), 2025)
- 32% of UK small businesses had at least one legal issue in the prior 12 months, according to the 2021 Small Business Legal Needs survey. (Legal Services Board (UK), Small Business Legal Needs Survey (2021 wave), 2021)
- 25% of UK small businesses with a legal issue used professional help in the 2021 survey, with accountants used more often than solicitors. (Legal Services Board (UK), Small Business Legal Needs Survey (2021 wave), 2021)
- 1,12,27,779 civil cases (about 11.2 million) were pending on India's National Judicial Data Grid in October 2026, alongside 4,03,95,579 criminal cases. (eCourts Services, Government of India, National Judicial Data Grid: District and Taluka Courts, October 2026)
Figure 8: Single most important problem cited by US small business owners, September 2026 (% of owners)
Chart data
| Label | Value |
|---|---|
| Quality or availability of labor | 26 |
| Inflation | 20 |
| Taxes | 11 |
| Poor sales | 11 |
| Government regulation | 7 |
| Cost of labor | 6 |
| Cost or availability of insurance | 6 |
| Competition from large businesses | 6 |
| Financing and interest rates | 3 |
Small Business AI and Technology Adoption Statistics
Estimates of AI use vary widely depending on who is asked and how the question is worded. Government surveys sit at the low end and vendor surveys at the high end, so both are shown and labeled.
- 46% of US small employer firms said their business or employees used AI at the time of the 2025 Small Business Credit Survey. (Federal Reserve Banks, Small Business Credit Survey: 2026 Report on Employer Firms, 2025 survey)
- 7% of small employer firms using AI had fully integrated it into their business; 44% had partially integrated it. (Federal Reserve Banks, Small Business Credit Survey: 2026 Report on Employer Firms, 2025 survey)
- 71% of small employer firms using AI said it increased productivity, and 39% reported improved quality of goods and services. (Federal Reserve Banks, Small Business Credit Survey: 2026 Report on Employer Firms, 2025 survey)
- 19.8% of US businesses were using AI in the Census Business Trends and Outlook Survey collection period ending May 3, 2026 (the national rate). (U.S. Census Bureau, Large Firms With at Least 20 Employees Biggest AI Users, Collection period ending May 3, 2026)
- 37% of US firms with at least 250 employees reported using AI in business operations, while under 20% of firms with four or fewer did. (U.S. Census Bureau, Large Firms With at Least 20 Employees Biggest AI Users, December 2025 to May 2026)
- 39.7% of businesses in the Information sector used AI as of May 2026, the highest rate, ahead of Finance and Insurance at 33.9%. (U.S. Census Bureau, Large Firms With at Least 20 Employees Biggest AI Users, May 2026)
- 17% of small EU enterprises used AI technologies in 2025, versus 30.36% of medium and 55.03% of large enterprises. (Eurostat, Use of artificial intelligence in enterprises (Statistics Explained), 2025)
- 19.2% of Canadian businesses used AI to produce goods or deliver services over the prior 12 months, per the Q2 2026 Canadian Survey on Business Conditions. (Statistics Canada, Business conditions in Canada, second quarter of 2026, Q2 2026)
- 77% of US small and midsize businesses on Intuit's survey now use AI regularly, up from 48% in July 2024. (Intuit QuickBooks, 2026 AI Impact Report: Mapping Adoption, Use, and Impact Across Small to Midsize Businesses, January 2026)
- 43% of US small and midsize businesses say AI has increased their revenue; only 2% say it has decreased it. (Intuit QuickBooks, 2026 AI Impact Report: Mapping Adoption, Use, and Impact Across Small to Midsize Businesses, 2026)
- 55% of US small businesses used AI in May 2025, up from 39% in 2024, according to Thryv's survey of 540 decision-makers. (Thryv Holdings, AI Adoption Among Small Businesses Surges 41% in 2025 According to New Survey from Thryv, May 2025)
- 58% of US small businesses self-identified as using generative AI in 2025, up from 40% in 2024. (U.S. Chamber of Commerce Technology Engagement Center, 2025 Empowering Small Business Report, 2025)
- 91% of small and medium businesses with AI say it boosts their revenue, in Salesforce's global survey of 3,350 SMB leaders. (Salesforce, Nearly 80% of SMBs with AI say it will be a game changer for their company (SMB Trends report, 6th edition), August to September 2024)
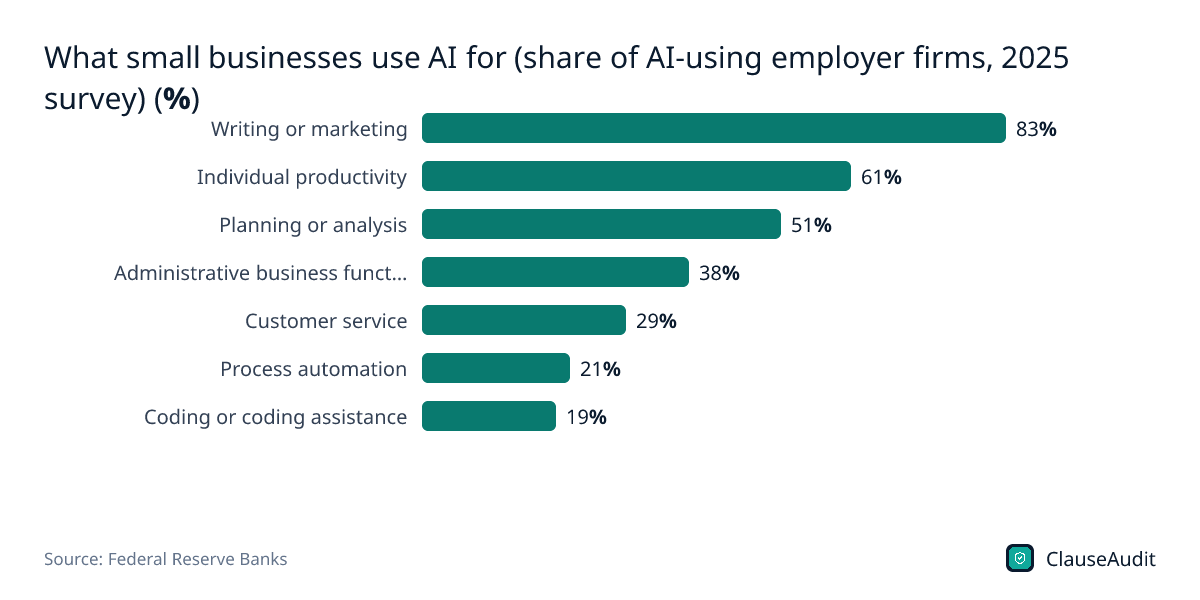
Figure 9: What small businesses use AI for (share of AI-using employer firms, 2025 survey) (%)
Chart data
| Label | Value |
|---|---|
| Writing or marketing | 83% |
| Individual productivity | 61% |
| Planning or analysis | 51% |
| Administrative business functions | 38% |
| Customer service | 29% |
| Process automation | 21% |
| Coding or coding assistance | 19% |
Small Business Cybersecurity and Data Breach Statistics
Small firms are frequent targets of ransomware and email fraud, and nearly half of all breaches in Verizon's 2026 DBIR involved a third party such as a vendor or partner. This section covers breach rates, losses and insurance.
- About 96% of ransomware victims were small and medium-sized businesses (under 1,000 employees) in Verizon's 2026 DBIR, among cases where victim size was known. (Verizon Business, 2026 Data Breach Investigations Report (full report, Small- and medium-sized businesses section), 2026 DBIR)
- 48% of all breaches involved ransomware in Verizon's 2026 DBIR, up from 44% the previous year. (Verizon Business, 2026 Data Breach Investigations Report: Executive Summary, 2026 DBIR)
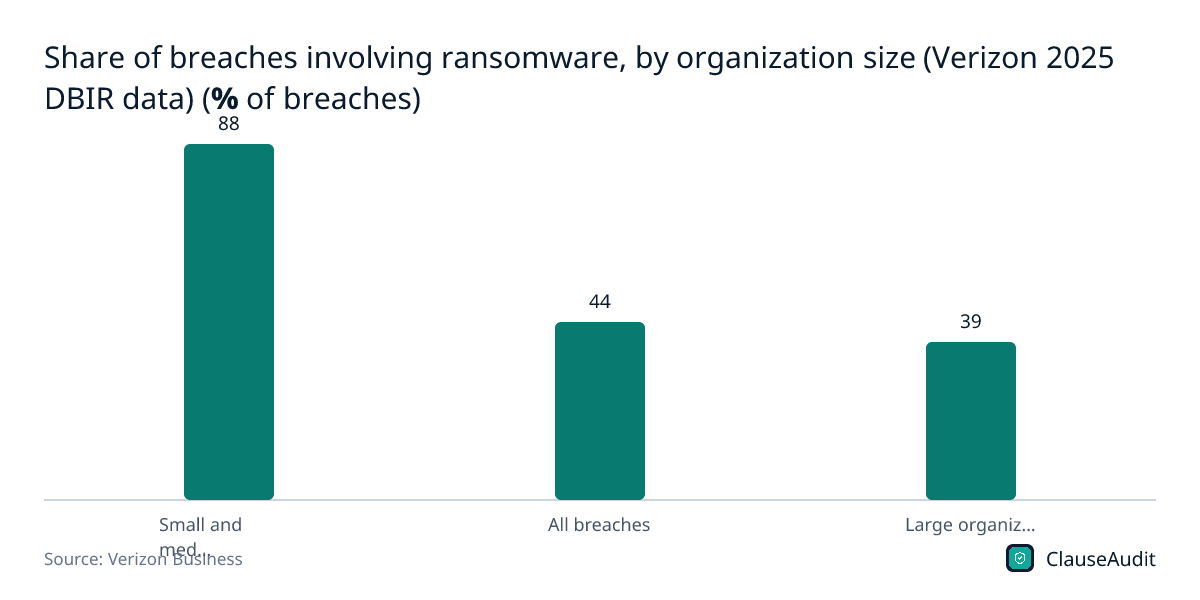
- 88% of breaches at small and medium-sized businesses involved ransomware in Verizon's 2025 DBIR SMB snapshot, versus 39% at large organizations (2025 data; the 2026 DBIR has since been published). (Verizon Business, 2025 Data Breach Investigations Report: Small- and Medium-Sized Business Snapshot, 2025 DBIR)
- $115,000 was the median ransom paid to ransomware groups in Verizon's 2025 DBIR dataset, down from $150,000 the year before. (Verizon Business, 2025 Data Breach Investigations Report: Small- and Medium-Sized Business Snapshot, 2025)
- 64% of ransomware victim organizations in Verizon's 2025 DBIR did not pay the ransom, up from 50% two years earlier. (Verizon Business, 2025 Data Breach Investigations Report: Small- and Medium-Sized Business Snapshot, 2025)
- More than 7% of revenue was lost to a data breach by SMBs in extreme cases (the top 2.5%), per Verizon's 2026 Breach Impact Study. (Verizon Business, Cybersecurity insights for SMBs (2026 DBIR and Breach Impact Study infographic), 2026)
- 31% of breaches across all organizations began with vulnerability exploitation in Verizon's 2026 DBIR, a 55% jump from the prior year. (Verizon Business, Cybersecurity insights for SMBs (2026 DBIR and Breach Impact Study infographic), 2026)
- 48% of all breaches in Verizon's 2026 DBIR involved a third party, such as a vendor or partner, up 60% from the prior year. (Verizon Business, Cybersecurity insights for SMBs (2026 DBIR and Breach Impact Study infographic), 2026)
- $3,046,598,558 in business email compromise losses were reported to the FBI's IC3 in 2025, the second-costliest crime type after investment fraud. (Federal Bureau of Investigation, Internet Crime Complaint Center (IC3), Internet Crime Report 2025, 2025)
- About C$300 million was spent by small businesses in Canada recovering from cyber security incidents in 2023, matching medium-sized businesses. (Statistics Canada, Impact of cybercrime on Canadian businesses, 2023 (The Daily), 2023)
- 3,600+ ransomware complaints were received by the FBI's IC3 in 2025, with reported losses exceeding $32 million. (Federal Bureau of Investigation, Internet Crime Complaint Center (IC3), Internet Crime Report 2025, 2025)
- 43% of UK businesses reported a cyber security breach or attack in the previous 12 months in the 2025/2026 Cyber Security Breaches Survey. (UK Department for Science, Innovation and Technology (GOV.UK), Cyber security breaches survey 2025/2026, 2025/2026)
- 46% of UK small businesses experienced a cyber breach or attack in the past 12 months, versus 42% of micro, 65% of medium and 69% of large firms. (UK Department for Science, Innovation and Technology (GOV.UK), Cyber security breaches survey 2025/2026, 2025/2026)
- 55% of UK small businesses had some form of cyber insurance in 2025/2026, compared with 47% of businesses overall. (UK Department for Science, Innovation and Technology (GOV.UK), Cyber security breaches survey 2025/2026, 2025/2026)
- 1 in 3 smaller organizations hit by ransomware stopped the attack before data was encrypted, according to Sophos's 2026 survey of 2,158 organizations. (Sophos, The State of Ransomware 2026, 2026)
Small Business Owner Demographics: Women, Minority and Veteran-Owned Firms
Who starts businesses is changing, with immigrants and Latino adults starting businesses at the highest monthly rates and Gen Z founders outnumbering Baby Boomers among 2025 startups. These figures come from the Census Bureau, the Kauffman Foundation, Gusto and GEM.
- 200,885 Black-owned employer businesses operated in the United States in 2023, according to the Census Bureau's 2024 Annual Business Survey. (U.S. Census Bureau, National Black History Month: February 2026 (Facts for Features CB26-FF.01), 2023)
- 684,916 Asian-owned firms with paid employees operated in the United States in 2023, per the 2024 Annual Business Survey. (U.S. Census Bureau, Asian American and Pacific Islander Heritage Month: May 2026 (Facts for Features CB26-FFF.04), 2023)
- 9,413 Native Hawaiian and Pacific Islander-owned US firms had paid employees in 2023, per the 2024 Annual Business Survey. (U.S. Census Bureau, Asian American and Pacific Islander Heritage Month: May 2026 (Facts for Features CB26-FFF.04), 2023)
- 0.28 percent of US women became new entrepreneurs in an average month of 2025, compared with 0.44 percent of men. (Kauffman Indicators of Entrepreneurship (Ewing Marion Kauffman Foundation), 2025 Early-Stage Entrepreneurship National Report (full PDF, demographic tables), 2025)
- 0.53 percent was the monthly rate of new entrepreneurship among Latino adults in 2025, ahead of Black (0.45%), Asian (0.33%) and white (0.29%) adults. (Kauffman Indicators of Entrepreneurship (Ewing Marion Kauffman Foundation), 2025 Early-Stage Entrepreneurship National Report (full PDF, demographic tables), 2025)
- 0.60 percent of US immigrants became new entrepreneurs in an average month of 2025, double the 0.30 percent rate among native-born Americans. (Kauffman Indicators of Entrepreneurship (Ewing Marion Kauffman Foundation), 2025 Early-Stage Entrepreneurship National Report (full PDF, demographic tables), 2025)
- 0.26 percent was the 2025 monthly rate of new entrepreneurship among adults aged 20 to 34, the lowest of any age group. (Kauffman Indicators of Entrepreneurship (Ewing Marion Kauffman Foundation), 2025 Early-Stage Entrepreneurship National Report (full PDF, demographic tables), 2025)
- 0.29% of US veterans became new entrepreneurs in an average month of 2025, below the 0.36% rate for non-veterans. (Kauffman Indicators of Entrepreneurship (Ewing Marion Kauffman Foundation), 2025 Early-Stage Entrepreneurship National Report (full PDF, demographic tables), 2025)
- 69% of new Black-owned businesses started in 2025 were led by women, according to Gusto's survey of 2025 founders. (Gusto, via PR Newswire, Gusto 2026 New Business Formation Report (press release), 2025)
- 37% of new US founders in 2025 were first- or second-generation immigrants, according to Gusto's 2026 New Business Formation Report. (Gusto, via PR Newswire, Gusto 2026 New Business Formation Report (press release), 2025 founders)
- 9% of new businesses started in 2025 were founded by Gen Z, compared with 5% started by Baby Boomers, a first in Gusto's data. (Gusto, via PR Newswire, Gusto 2026 New Business Formation Report (press release), 2025)
- 12% of women surveyed across 48 economies were running new businesses in 2025, compared with 14% of men. (Global Entrepreneurship Monitor (GEM), GEM 2025/2026 Women's Entrepreneurship Report (press release), 2025)
- 0.69 was the average women-to-men ratio in established business ownership in 2025, the widest gender gap of any entrepreneurial stage. (Global Entrepreneurship Monitor (GEM), GEM 2025/2026 Women's Entrepreneurship Report (press release), 2025)
- 22% of US business owners with paid employees worked entirely from home in 2025, part of the 30% of all self-employed adults who did. (Board of Governors of the Federal Reserve System, Economic Well-Being of U.S. Households in 2025, October 2025 survey)
Figure 11: Monthly rate of new entrepreneurs by group, United States, 2025 (% of adults per month)
Chart data
| Label | Value |
|---|---|
| Immigrants | 0.60% |
| Latino | 0.53% |
| Black | 0.45% |
| Men | 0.44% |
| All adults | 0.36% |
| Non-veterans | 0.36% |
| Asian | 0.33% |
| Native-born | 0.30% |
| White | 0.29% |
| Veterans | 0.29% |
| Women | 0.28% |
| Ages 20 to 34 | 0.26% |
Global and India MSME Statistics
Outside the US, small and medium-sized enterprises make up the large majority of firms and much of employment. This section covers the EU, UK, Canada, Singapore and India's MSME sector.
- About 90% of all businesses worldwide are SMEs, and they account for more than half of global employment, according to the World Bank. (World Bank, Small and Medium Enterprises (SMEs) Finance, Current estimate)
- $5.2 trillion is the estimated financing gap for formal MSMEs worldwide, with a further $2.9 trillion gap for informal MSMEs, according to IFC. (International Finance Corporation (World Bank Group), MSME Finance, Undated estimate)
- 63.5% of the EU business economy workforce was employed by small and medium-sized enterprises in 2024. (Eurostat (European Commission), Structural business statistics overview (Statistics Explained), 2024)
- 50.9% of the value added in the EU business economy was generated by SMEs in 2024, which made up 99.8% of enterprises. (Eurostat (European Commission), Structural business statistics overview (Statistics Explained), 2024)
- 5.7 million private sector businesses operated in the UK at the start of 2025, and 99.85% of them were SMEs. (UK Department for Business and Trade, Business population estimates for the UK and regions 2025: statistical release, Start of 2025)
- 60% of UK private sector employment and 51% of turnover came from SMEs at the start of 2025. (UK Department for Business and Trade, Business population estimates for the UK and regions 2025: statistical release, Start of 2025)
- Net 43% of euro area SMEs reported higher bank interest rates in Q2 2026, up from a net 24% in the previous quarter. (European Central Bank, Survey on the Access to Finance of Enterprises in the euro area, second quarter of 2026, Q2 2026)
- 9,89,48,351 enterprises (about 98.9 million) were registered on India's Udyam and Udyam Assist platforms as of 18 October 2026. (Ministry of Micro, Small and Medium Enterprises, Government of India, Udyam Registration portal: Udyam + UAP overview, 18 October 2026)
- 43,75,70,360 jobs (about 437.6 million) were reported by enterprises registered on India's Udyam and Udyam Assist platforms as of 18 October 2026. (Ministry of Micro, Small and Medium Enterprises, Government of India, Udyam Registration portal: Udyam + UAP overview, 18 October 2026)
- 3.6 crore Indian MSMEs had ever accessed formal credit as of March 2026, against 8.7 crore registered MSMEs as of December 2025. (TransUnion CIBIL and SIDBI, MSME Pulse Report, July 2026, March 2026)
- 30.1% of India's GDP was gross value added by MSMEs in 2022-23, up from 29.7% in 2017-18, per the Government of India. (Press Information Bureau, Government of India, The MSME Revolution: Transforming India's Economic Landscape, 2022-23)
- 45.73% of India's exports came from MSMEs in 2023-24, and exporting MSMEs rose from 52,849 in 2020-21 to 1,73,350 in 2024-25 (to November 2024). (Press Information Bureau, Government of India, The MSME Revolution: Transforming India's Economic Landscape, 2023-24)
- Over 52 crore loans worth ₹32.61 lakh crore were sanctioned under India's PM Mudra Yojana in its first ten years since April 2015. (Press Information Bureau, Government of India, 10 Years of Pradhan Mantri MUDRA Yojana, April 2015 to April 2025)
- 1.08 million of Canada's 1.10 million employer businesses, or 98.2%, were small businesses in December 2024. (Innovation, Science and Economic Development Canada, Key Small Business Statistics 2025, December 2024)
- 356,600 SMEs operated in Singapore in 2024, and 94.7% of them employed fewer than 25 workers, per the Ministry of Manpower. (Ministry of Manpower, Singapore, Written Answer to PQ on Distribution of SMEs, 2024)
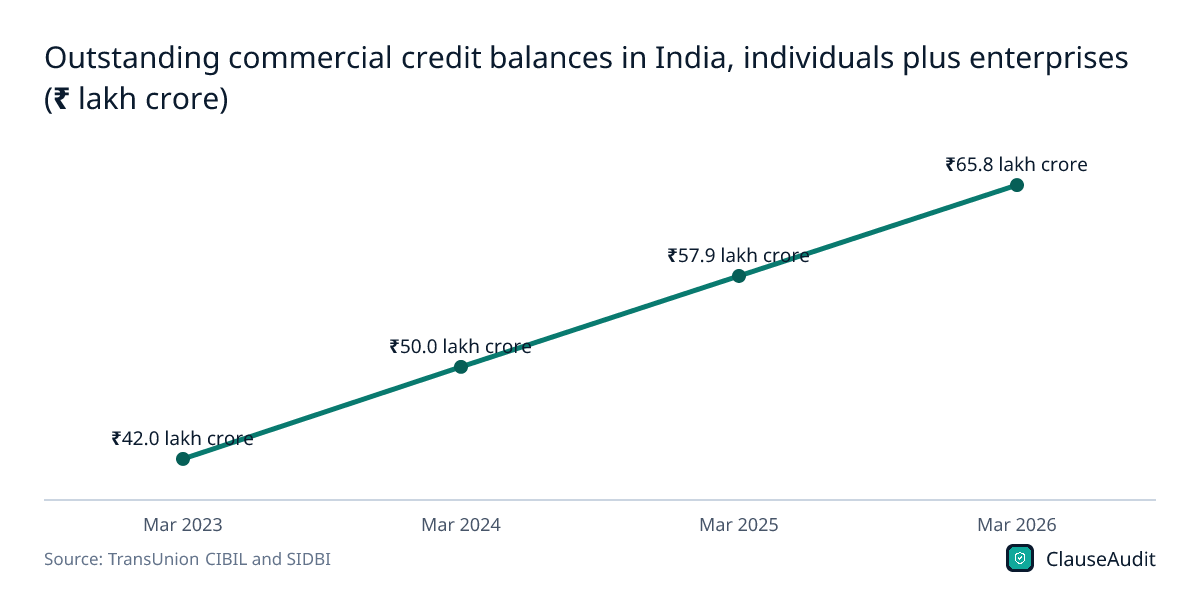
Figure 12: Outstanding commercial credit balances in India, individuals plus enterprises (₹ lakh crore)
Chart data
| Label | Value |
|---|---|
| Mar 2023 | ₹42.0 lakh crore |
| Mar 2024 | ₹50.0 lakh crore |
| Mar 2025 | ₹57.9 lakh crore |
| Mar 2026 | ₹65.8 lakh crore |
What the numbers mean for small business owners
The typical US small business is one person. Of the 36,207,130 small businesses counted for 2022, 82.3% had no employees, and only 6,395,635 had a payroll. That makes contracts with customers, suppliers and platforms more important than an employee handbook for most owners, because there is no legal or finance team to catch a bad term.
Survival is the other headline. BLS data shows 77.9% of establishments opened in the year to March 2024 made it through their first year, 51.4% of the 2020 cohort lasted five years, and 34.7% of the 2015 cohort were still open after ten. The odds improve with age: on 1994 to 2022 averages, 69.5% of establishments that reach five years go on to reach ten. The early years are where cost overruns, a lost customer or a bad lease does the most damage, so they are also when terms are worth negotiating hardest.
Cash flow problems often start in the contract
Half of small employer firms (50%) reported uneven cash flow as a financial challenge in the 2025 Small Business Credit Survey, and 54% struggled to cover operating expenses such as payroll and rent. Late customers make it worse. QuickBooks found 59% of US small businesses have invoices overdue by 30 days or more, and Xero data put the average wait to get paid at 29.3 days in the June 2026 quarter, with invoices settled 8.5 days past their due date.
The pressure passes down the chain: 24% of firms with financial challenges made a late payment or skipped a bill themselves. Clear payment terms will not stop every slow payer, but they give you something to enforce. Set a due date in days, add a late fee or interest that your state allows, ask for a deposit on larger jobs, and tie work stoppage rights to unpaid invoices. Check incoming contracts for long payment terms, payment that depends on the customer's own approval, and set-off rights that let them deduct disputed amounts.
Vendors, data and disputes carry risk you can negotiate
Many risks reach small firms through other companies. In Verizon's 2026 DBIR, 48% of breaches involved a third party such as a vendor or partner, and about 96% of ransomware victims with a known size were small and medium-sized businesses. Business email compromise losses reported to the FBI reached $3,046,598,558 in 2025. Software, IT and payment contracts should say who is responsible for a breach, how fast you will be told, and whether the liability cap covers your data.
When disputes happen, the contract decides where they are heard. The median time to an AAA arbitration award on claims up to $100,000 was 5.1 months in 2024, against 31.6 months in U.S. District Court. Arbitration can be faster, but read who pays the fees, where hearings take place and whether you give up class claims. Before signing, look closely at indemnities, limits of liability, automatic renewal and termination terms, since these clauses decide how much a bad year costs.
Check your business contracts before you sign
Most small businesses have no employees, let alone an in-house lawyer, so customer agreements, vendor contracts, leases and software terms often get signed as they arrive. An automated review flags the clauses that drive the risks on this page, such as slow payment terms, broad indemnities and low liability caps, and explains each one in plain English with a suggested change to ask for.
- Payment terms, due dates, late fees and interest on overdue invoices
- Payment conditioned on customer approval or acceptance
- Set-off and withholding rights over disputed amounts
- Indemnification scope and whether it is mutual
- Limitation of liability caps and what they exclude
- Data security, breach notice timing and vendor responsibility
- Automatic renewal, notice periods and termination rights
- Arbitration, venue and governing law clauses
- Personal guarantees attached to leases or credit terms
Frequently asked questions
How many small businesses are there in the US?
The SBA Office of Advocacy counts 36,207,130 small businesses in the US, based on 2022 Census data. They make up 99.9% of all US firms, and 82.3% of them (29,811,495) have no employees.
What percentage of small businesses fail?
BLS data shows 77.9% of establishments opened in the year to March 2024 survived their first year, so roughly one in five closed. Of those opened in 2020, 51.4% were still operating five years later, and 34.7% of the 2015 cohort lasted ten years.
How many jobs do small businesses create?
Small businesses with fewer than 250 employees accounted for 51% of US net job creation from Q3 2020 to Q3 2025, according to BLS. From 2013 to 2023, firms with 249 or fewer employees added 55% of net new jobs.
What percentage of small businesses are profitable?
In the Federal Reserve's 2025 Small Business Credit Survey, 47% of small employer firms were operating at a profit at the end of 2024, up from 35% in the 2021 survey.
How many new businesses were started in 2025?
Census counts business applications rather than launches: 5,671,836 were filed in the US in 2025, the highest annual total in the series since 2005, though not every application becomes an operating business. In September 2026, 534,947 seasonally adjusted applications were filed.
How long do small businesses wait to get paid?
Xero data shows US small businesses waited an average of 29.3 days to get invoices paid in the June 2026 quarter, and invoices were paid 8.5 days past their due date on average. Half of small employer firms (50%) cite uneven cash flow as a challenge.
How many small businesses use AI?
In the 2025 Small Business Credit Survey, 46% of small employer firms said they or their employees used AI, though only 7% of users had fully integrated it. The Census Bureau's broader national rate for all US businesses was 19.8% in the survey period ending May 3, 2026.
Use this data
Every chart and card below is free to reuse under CC BY 4.0. Download what you need and link back to this page.
 Stat cards
 Key findings card
 Infographic
 US small businesses by industry, 2022 (top 8) (millions of small businesses)
 Share of US establishments opened in 2015 still operating, by year (%)
 Top financial challenges for US small employer firms, prior 12 months (% of employer firms)
 Share of breaches involving ransomware, by organization size (Verizon 2025 DBIR data) (% of breaches)
 US business applications per year, 2019 to 2025 (million applications)
 Share of small employer firms operating at a profit, by Small Business Credit Survey year (% of employer firms)
 Single most important problem cited by US small business owners, September 2026 (% of owners)
 Monthly rate of new entrepreneurs by group, United States, 2025 (% of adults per month)
 Small firms' share of US net job creation across BLS reporting periods (%)
 Share of small business credit applicants fully approved, by lender type (2025 survey) (%)
 What small businesses use AI for (share of AI-using employer firms, 2025 survey) (%)
 Outstanding commercial credit balances in India, individuals plus enterprises (₹ lakh crore)
Embed the infographic
Free to share on your site, blog or slides under CC BY 4.0. Please keep the credit link.
Sources and method
Every number on this page comes from the sources below, each opened and read on or before October 17, 2026. A second, independent review checked every figure against its source and corrected anything that did not match. Figures that could not be confirmed were left out.
- U.S. Small Business Administration, Office of Advocacy, Frequently Asked Questions About Small Business 2026 (February 2026)
- U.S. Small Business Administration, Office of Advocacy, 2025 Small Business Profile: United States (June 2025)
- U.S. Small Business Administration, Office of Advocacy, 2025 Small Business Profile: California (June 2025)
- U.S. Census Bureau, Census Bureau Releases New Data on Business Owner Characteristics (2024 ABS and 2023 NES-D) (November 20, 2025)
- U.S. Census Bureau, Number of U.S. Nonemployers Grew Faster Than Employer Businesses Nearly Every Year From 2012 to 2023 (July 30, 2025)
- Internal Revenue Service, Statistics of Income, Table 1. Nonfarm Sole Proprietorships: Business Receipts, Selected Deductions, Payroll, and Net Income, by Industrial Sectors, Tax Year 2023 (Tax Year 2023 (posted 2026))
- U.S. Bureau of Labor Statistics, Business Employment Dynamics: Survival of private sector establishments by opening year (Table 7, total private) (Data through March 2025)
- U.S. Bureau of Labor Statistics, Business Employment Dynamics: Survival of private sector establishments by opening year (Table 7, Agriculture, Forestry, Fishing and Hunting) (Data through March 2025)
- U.S. Bureau of Labor Statistics, Business Employment Dynamics: Survival of private sector establishments by opening year (Table 7, Mining, Quarrying, and Oil and Gas Extraction) (Data through March 2025)
- Administrative Office of the U.S. Courts, Bankruptcies Rise 12.2 Percent (July 28, 2026)
- Office for National Statistics (UK), Business demography, UK: 2024 (20 November 2025)
- Eurostat, Business demography statistics (Statistics Explained) (Data from October 2026)
- Federal Reserve Banks, Small Business Credit Survey: 2026 Report on Employer Firms (March 3, 2026)
- Intuit QuickBooks, 2026 Small Business Late Payments Report (July 2026)
- Xero, Xero Small Business Insights: United States, June 2026 quarter (30 July 2026)
- Atradius, B2B payment practices trends in the US 2026 (2026)
- Office of the Small Business Commissioner (UK), Office of the Small Business Commissioner (home page) (Accessed October 2026)
- Office of the Small Business Commissioner (UK), Payment Times Are Improving As New Legislation Dawns (15 July 2026)
- Ministry of Micro, Small and Medium Enterprises, Government of India, MSME Samadhaan: Delayed Payment Monitoring System dashboard (Live dashboard, accessed October 2026)
- Verizon Business, Cybersecurity insights for SMBs (2026 DBIR and Breach Impact Study infographic) (2026 (DBIR May 19, 2026; BIS June 16, 2026))
- Verizon Business, 2025 Data Breach Investigations Report: Small- and Medium-Sized Business Snapshot (2025)
- Verizon Business, 2026 Data Breach Investigations Report: Executive Summary (May 19, 2026)
- Verizon Business, 2026 Data Breach Investigations Report (full report, Small- and medium-sized businesses section) (May 19, 2026)
- Federal Bureau of Investigation, Internet Crime Complaint Center (IC3), Internet Crime Report 2025 (2025 annual report)
- UK Department for Science, Innovation and Technology (GOV.UK), Cyber security breaches survey 2025/2026 (30 April 2026)
- Sophos, The State of Ransomware 2026 (2026)
- Statistics Canada, Impact of cybercrime on Canadian businesses, 2023 (The Daily) (2024-10-21)
- U.S. Census Bureau, Business Formation Statistics, September 2026 (Release CB26-163) (October 14, 2026)
- U.S. Census Bureau, Business Formation Statistics, December 2025 (Release CB26-11) (January 14, 2026)
- Federal Reserve Bank of St. Louis, FRED (data: U.S. Census Bureau), Business Applications: Total for All NAICS in the United States (BABATOTALNSAUS), annual sum (Accessed October 2026)
- Kauffman Indicators of Entrepreneurship (Ewing Marion Kauffman Foundation), National Report on Early-Stage Entrepreneurship in the United States: 2025 (May 2026)
- U.S. Bureau of Labor Statistics, Business Employment Dynamics - Fourth Quarter 2025 (July 29, 2026)
- Gusto, via PR Newswire, Gusto 2026 New Business Formation Report (press release) (May 14, 2026)
- Federal Reserve Banks (Fed Small Business), 2026 Report on Employer Firms: Findings from the 2025 Small Business Credit Survey (March 3, 2026)
- Federal Reserve Banks (Fed Small Business), via FRED, Federal Reserve Bank of St. Louis, Small Business Credit Survey: Operated at a Profit: Employer Firms (SBCSS7B0V0FRB) (Updated July 30, 2026)
- National Federation of Independent Business (NFIB), NFIB Small Business Economic Trends, September 2026 (October 2026)
- Bank of America, 2025 Bank of America Business Owner Report (press release) (November 18, 2025)
- JPMorganChase, 2026 Business Leaders Outlook (press release) (January 7, 2026)
- U.S. Chamber of Commerce, Q3 2026 Justworks & U.S. Chamber of Commerce Small Business Index: Key Findings (September 30, 2026)
- Vistage Worldwide, WSJ/Vistage Small Business CEO Survey, September 2026 (October 2, 2026)
- Chase (JPMorganChase), Small Business Pulse: Profitability up, payroll growth down in January 2026 (February 20, 2026)
- Internal Revenue Service, Instructions for Form 1120 (2025): Estimates of Taxpayer Burden (2025 tax year edition)
- American Arbitration Association, Small Business Dispute Resolution (2024 data, accessed October 2026)
- American Arbitration Association, American Arbitration Association: Why AAA? (caseload data) (2025 data, accessed October 2026)
- Administrative Office of the U.S. Courts, Federal Judicial Caseload Statistics 2025 (2025 (12 months ending March 31, 2025))
- UK Department for Business and Trade (GOV.UK), Longitudinal Small Business Survey 2025: SME employers (businesses with 1 to 249 employees) (15 October 2026)
- Legal Services Board (UK), Small Business Legal Needs Survey (2021 wave) (2021 survey (fielded July to September 2021))
- eCourts Services, Government of India, National Judicial Data Grid: District and Taluka Courts (Last updated 14-10-2026)
- U.S. Census Bureau, National Black History Month: February 2026 (Facts for Features CB26-FF.01) (February 10, 2026)
- U.S. Census Bureau, Asian American and Pacific Islander Heritage Month: May 2026 (Facts for Features CB26-FFF.04) (April 21, 2026)
- Kauffman Indicators of Entrepreneurship (Ewing Marion Kauffman Foundation), 2025 Early-Stage Entrepreneurship National Report (full PDF, demographic tables) (May 2026)
- Global Entrepreneurship Monitor (GEM), GEM 2025/2026 Women's Entrepreneurship Report (press release) (8 October 2026)
- U.S. Bureau of Labor Statistics, Small firms accounted for half of net job creation, third quarter 2020–third quarter 2025 (The Economics Daily) (May 7, 2026)
- U.S. Bureau of Labor Statistics, Small businesses continue to outpace large businesses in job creation (The Economics Daily) (May 8, 2025)
- U.S. Bureau of Labor Statistics, Small businesses contributed 55 percent of the total net job creation from 2013 to 2023 (The Economics Daily) (May 1, 2024)
- Federal Reserve Bank of Chicago, Small business employment in the pandemic era and beyond (Chicago Fed Letter No. 509) (August 2025)
- ADP Research, ADP National Employment Report: Private-Sector Employment Increased by 90,000 Jobs in September (September 30, 2026)
- Paychex, Small Business Employment Watch, September 2026 (September 29, 2026)
- U.S. Small Business Administration, SBA delivers record capital to small businesses in FY25 (News release 25-83) (September 30, 2025)
- U.S. Small Business Administration, SBA's SBIC program delivers record capital in FY25 (News release 26-07) (November 19, 2025)
- Federal Reserve Bank of Kansas City, Small Business Lending Survey, Q2 2026 (September 24, 2026)
- Federal Deposit Insurance Corporation, FDIC Issues 2024 Small Business Lending Survey Report (press release) (October 2, 2024 (survey conducted 2022))
- U.S. Department of the Treasury, State Small Business Credit Initiative (SSBCI) (Accessed October 2026)
- U.S. Census Bureau, Large Firms With at Least 20 Employees Biggest AI Users (May 26, 2026)
- Intuit QuickBooks, 2026 AI Impact Report: Mapping Adoption, Use, and Impact Across Small to Midsize Businesses (May 12, 2026)
- Thryv Holdings, AI Adoption Among Small Businesses Surges 41% in 2025 According to New Survey from Thryv (July 17, 2025)
- U.S. Chamber of Commerce Technology Engagement Center, 2025 Empowering Small Business Report (August 18, 2025)
- Salesforce, Nearly 80% of SMBs with AI say it will be a game changer for their company (SMB Trends report, 6th edition) (December 4, 2024)
- UK Department for Business and Trade, Business population estimates for the UK and regions 2025: statistical release (2 October 2025)
- Eurostat (European Commission), Structural business statistics overview (Statistics Explained) (2024 data)
- World Bank, Small and Medium Enterprises (SMEs) Finance (Accessed October 2026)
- International Finance Corporation (World Bank Group), MSME Finance (Accessed October 2026)
- European Central Bank, Survey on the Access to Finance of Enterprises in the euro area, second quarter of 2026 (Q2 2026 survey round (fieldwork 21 May to 26 June 2026))
- Ministry of Micro, Small and Medium Enterprises, Government of India, Udyam Registration portal: Udyam + UAP overview (Facts dated 18 October 2026)
- TransUnion CIBIL and SIDBI, MSME Pulse Report, July 2026 (July 2026)
- Eurostat, Use of artificial intelligence in enterprises (Statistics Explained) (Data extracted in December 2025)
- Statistics Canada, Business conditions in Canada, second quarter of 2026 (May 27, 2026)
- Press Information Bureau, Government of India, The MSME Revolution: Transforming India's Economic Landscape (23 December 2024)
- Press Information Bureau, Government of India, 10 Years of Pradhan Mantri MUDRA Yojana (April 7, 2025)
- Innovation, Science and Economic Development Canada, Key Small Business Statistics 2025 (2025 edition (page modified 2026-04-23))
- Federal Statistical Office of Germany (Destatis), Small and medium-sized enterprises (Reference year 2024)
- Australian Bureau of Statistics, Counts of Australian Businesses, including Entries and Exits, July 2022 - June 2026 (18 August 2026)
- United Nations, Micro-, Small and Medium-sized Enterprises Day (Observance page, accessed October 2026)
- Ministry of Manpower, Singapore, Written Answer to PQ on Distribution of SMEs (3 March 2026)
- Board of Governors of the Federal Reserve System, Economic Well-Being of U.S. Households in 2025 (May 2026)
Cite this page
ClauseAudit, “Small Business Statistics 2026: 160+ Numbers on Counts, Jobs, Survival, Cash Flow and Risk”, updated October 17, 2026, https://clauseaudit.com/data/small-business-statistics. Free to reuse with a link back (CC BY 4.0).
This page summarises published data and law as checked on October 17, 2026. Figures are updated as new editions are released, and your own situation may differ. It is general information, not legal, tax or financial advice.