Legal Costs and Litigation Statistics for Small Businesses 2026: 160 Numbers on Lawsuits, Fees and Disputes
By ClauseAudit Research · 160 statistics · 80 sources ·
How much does a lawsuit cost a small business?
In a Federal Judicial Center survey of federal civil cases closed in 2008, defense attorneys reported a median cost of $20,000 including fees, and $300,000 at the 95th percentile. Filing a federal case costs $350 plus a $55 administrative fee, and the median federal civil case took 15.6 months to resolve in FY2025.

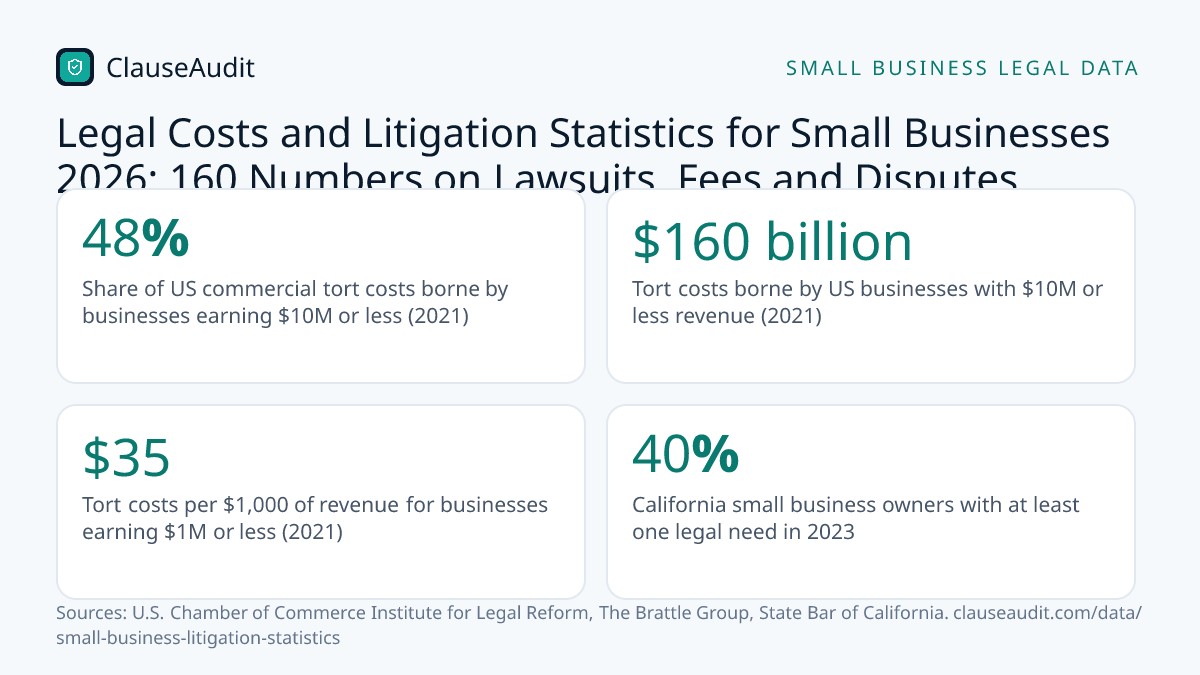
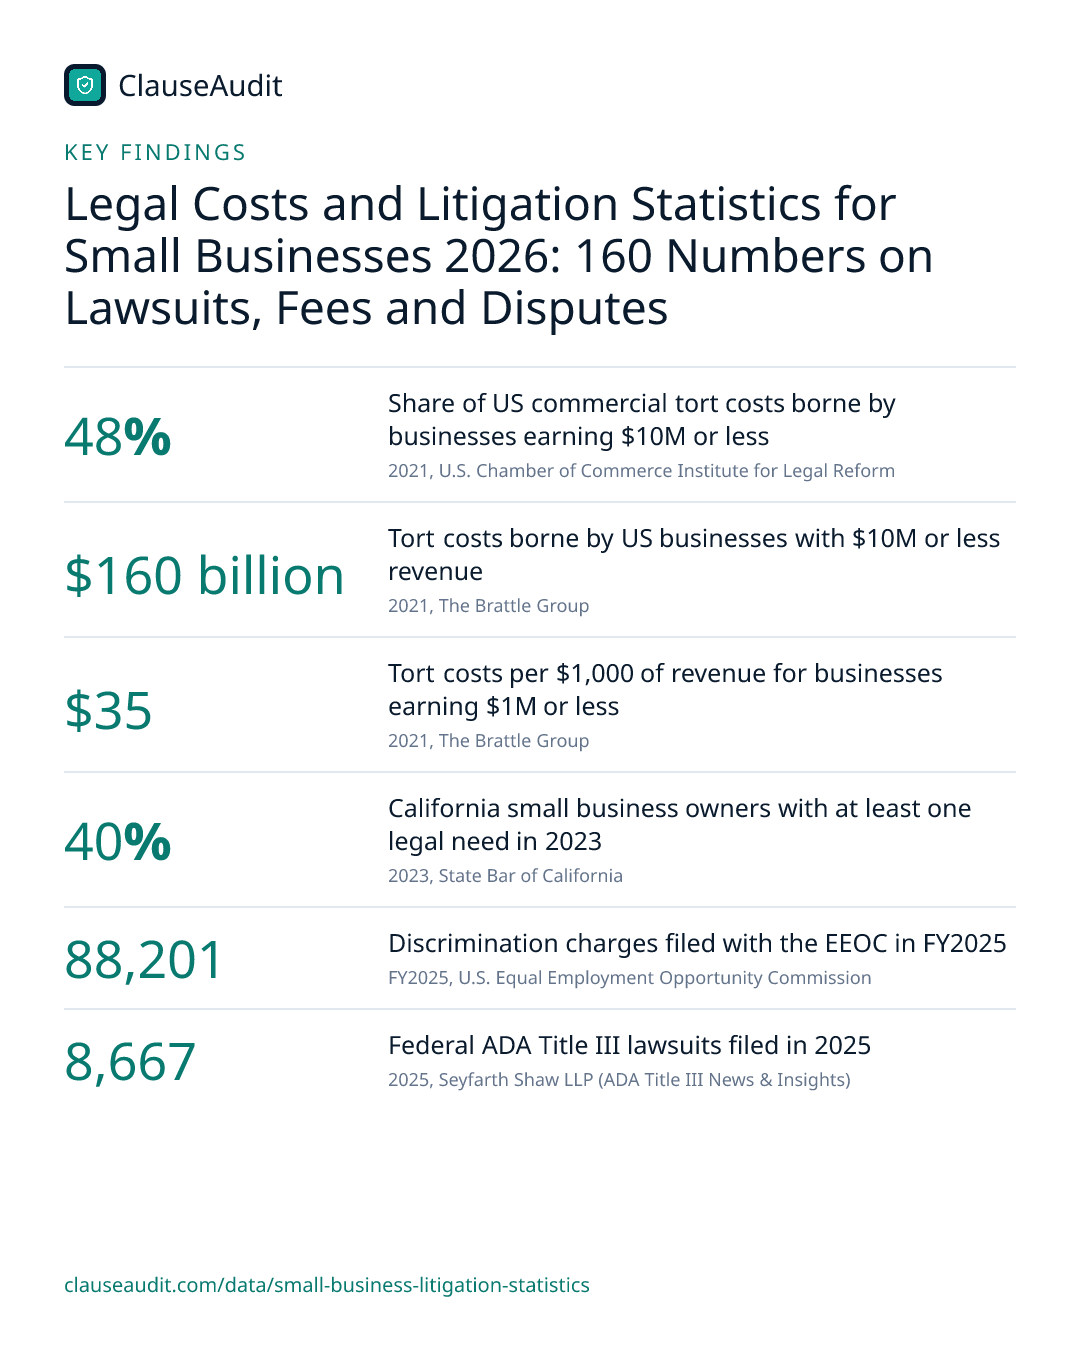
- Share of US commercial tort costs borne by businesses earning $10M or less (2021, U.S. Chamber of Commerce Institute for Legal Reform)
- 48%
- Tort costs borne by US businesses with $10M or less revenue (2021, The Brattle Group)
- $160 billion
- Tort costs per $1,000 of revenue for businesses earning $1M or less (2021, The Brattle Group)
- $35
- California small business owners with at least one legal need in 2023 (2023, State Bar of California)
- 40%
- Discrimination charges filed with the EEOC in FY2025 (FY2025, U.S. Equal Employment Opportunity Commission)
- 88,201
- Federal ADA Title III lawsuits filed in 2025 (2025, Seyfarth Shaw LLP (ADA Title III News & Insights))
- 8,667
- Median time to resolve a federal civil case, FY2025 (FY2025, Administrative Office of the U.S. Courts)
- 15.6 months
This page collects 160 statistics on what lawsuits and legal disputes cost small businesses, in twelve groups: the tort cost burden, lawsuit costs, how often businesses get sued, contract disputes, employment claims, ADA and website accessibility suits, IP litigation, court caseloads, lawyer fees, liability insurance, arbitration, and commercial disputes in India.
Figures come mainly from federal court statistics, the EEOC, the Labor Department, the Federal Judicial Center, state agencies, insurance actuaries, arbitration institutions and owner surveys, with law firm and vendor reports labeled as such. Every number links to the page it came from, older studies carry their year, and the data was checked on October 17, 2026.
Small Business Tort and Liability Cost Statistics
Tort costs include lawsuits, settlements, defense spending and liability insurance. Research for the U.S. Chamber's Institute for Legal Reform found these costs fall hardest on the smallest firms relative to their revenue.
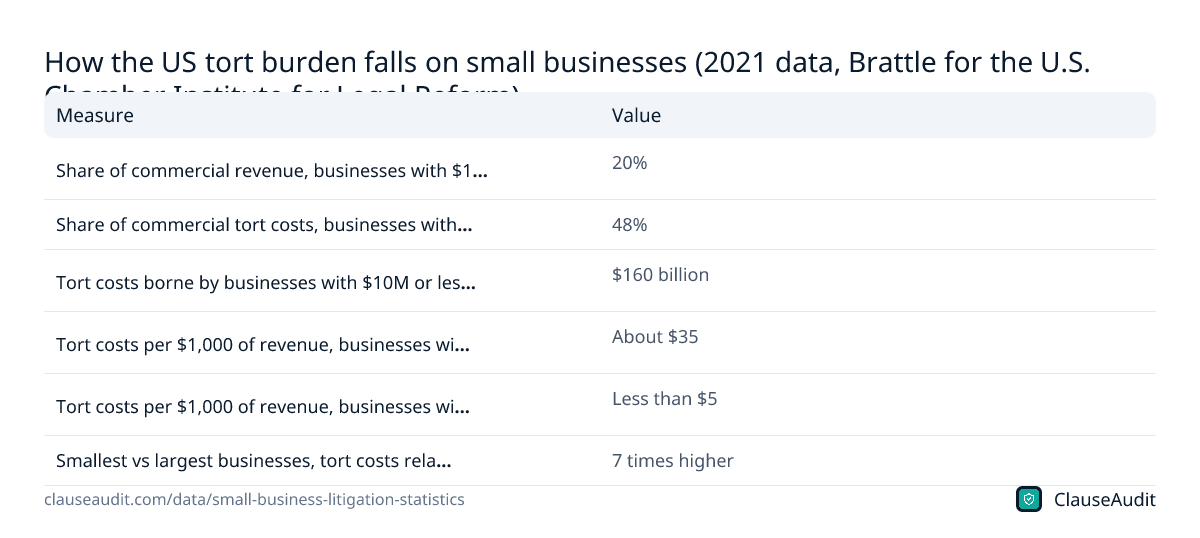
- 48% of all US commercial tort costs in 2021 fell on businesses earning $10 million or less a year, per Brattle research for the U.S. Chamber. (U.S. Chamber of Commerce Institute for Legal Reform, Tort Costs for Small Businesses, 2021)
- 20% of US commercial revenue in 2021 was earned by those same small businesses, so their tort burden was more than double their share of sales. (U.S. Chamber of Commerce Institute for Legal Reform, Tort Costs for Small Businesses, 2021)
- $160 billion in tort costs was borne by US businesses with $10 million or less in annual revenue in 2021. (The Brattle Group, Tort Costs for Small Businesses (Brattle publication summary), 2021)
- $35 in tort costs for every $1,000 of revenue faced businesses earning $1 million or less, based on 2021 data. (The Brattle Group, Tort Costs for Small Businesses (Brattle publication summary), 2021)
- Less than $5 in tort costs per $1,000 of revenue was incurred by businesses making $50 million or more, based on 2021 data. (U.S. Chamber of Commerce Institute for Legal Reform, Tort Costs for Small Businesses, 2021)
- 7 times the tort costs of the largest businesses, relative to revenue, is what the smallest US businesses faced in 2021. (The Brattle Group, Tort Costs for Small Businesses (Brattle publication summary), 2021)
- $529 billion was paid into the US tort system in costs and compensation in 2022, more than 2% of GDP. (The Brattle Group, Brattle Principals Co-Author Report on Tort Costs in America, 2022)
- $4,200 or more per US household is what total US tort costs equated to in 2022. (U.S. Chamber of Commerce Institute for Legal Reform, Tort Costs in America: An Empirical Analysis of Costs and Compensation of the U.S. Tort System, Third Edition, 2022)
- 7.1% average annual growth in US tort costs between 2016 and 2022, faster than inflation. (U.S. Chamber of Commerce Institute for Legal Reform, Tort Costs in America: An Empirical Analysis of Costs and Compensation of the U.S. Tort System, Third Edition, 2016-2022)
- $1 trillion is roughly what annual US tort costs will reach by 2030 if 2016 to 2022 growth rates continue, ILR projects. (U.S. Chamber of Commerce Institute for Legal Reform, Tort Costs in America: An Empirical Analysis of Costs and Compensation of the U.S. Tort System, Third Edition, 2030 projection)
- $43.84 billion is the estimated increase in US motor vehicle tort litigation costs from 2015 to 2024, a key exposure for businesses running vehicles. (Casualty Actuarial Society, Triple-I/CAS Analysis Finds Motor Vehicle Tort Filings Reach 30-Year High, 2015-2024)
- 6,809 federal motor vehicle tort cases were filed in 2024, the highest annual number in a CAS and Triple-I study period dating to 1995. (Casualty Actuarial Society, Triple-I/CAS Analysis Finds Motor Vehicle Tort Filings Reach 30-Year High, 2024)
- 23% rise in US commercial litigation finance capital commitments in 2025 versus 2024, following two consecutive years of contraction. (Westfleet Advisors, The Westfleet Insider: 2025 Litigation Finance Market Report, 2025)
| Measure | Value |
|---|---|
| Share of commercial revenue, businesses with $10M or less in revenue | 20% |
| Share of commercial tort costs, businesses with $10M or less in revenue | 48% |
| Tort costs borne by businesses with $10M or less in revenue | $160 billion |
| Tort costs per $1,000 of revenue, businesses with $1M or less | About $35 |
| Tort costs per $1,000 of revenue, businesses with $50M or more | Less than $5 |
| Smallest vs largest businesses, tort costs relative to revenue | 7 times higher |
Cost of a Lawsuit for a Small Business: Defense, Settlement and Trial
There is no single price for a lawsuit, because cost depends on how far the case goes. These figures cover court and arbitration filing fees, surveyed defense and plaintiff costs, and how long cases take at each stage.
- $350 is the statutory filing fee under 28 U.S.C. 1914(a) to start a civil lawsuit in a US district court; court-set administrative fees are added on top. (U.S. Government Publishing Office (GovInfo), 28 U.S.C. 1914 - District court; filing and miscellaneous fees (United States Code, 2023 edition), 2026)
- $55 administrative fee is charged on top of the statutory fee when a civil action is filed in a US district court, under the Judicial Conference fee schedule. (Administrative Office of the U.S. Courts, District Court Miscellaneous Fee Schedule, Schedule effective Dec. 1, 2023)
- $6,250 is the most a business can sue for in California small claims court, versus $12,500 for an individual. (Judicial Branch of California (California Courts Self-Help Guide), Small claims in California, 2026)
- $2,500 is the JAMS filing fee for a two-party arbitration, rising to $4,000 when three or more parties are involved. (JAMS, Arbitration Fees, 2026)
- $20,000 was the median cost, including attorney fees, reported by defense attorneys in closed federal civil cases in a 2009 Federal Judicial Center survey. (Federal Judicial Center, Federal Judicial Center National, Case-Based Civil Rules Survey: Preliminary Report to the Judicial Conference Advisory Committee on Civil Rules, 2008 cases (published 2009))
- $15,000 was the median cost, including attorney fees, reported by plaintiff attorneys in closed federal civil cases in the 2009 FJC survey. (Federal Judicial Center, Federal Judicial Center National, Case-Based Civil Rules Survey: Preliminary Report to the Judicial Conference Advisory Committee on Civil Rules, 2008 cases (published 2009))
- $300,000 was the cost reported by defendants at the 95th percentile of closed federal civil cases, showing how far expensive cases outrun the median (2009 FJC survey). (Federal Judicial Center, Federal Judicial Center National, Case-Based Civil Rules Survey: Preliminary Report to the Judicial Conference Advisory Committee on Civil Rules, 2008 cases (published 2009))
- 3.3 percent of the amount at stake was the median discovery spend, including attorney fees, reported by defense attorneys, versus 1.6 percent for plaintiffs (2009 FJC survey). (Federal Judicial Center, Federal Judicial Center National, Case-Based Civil Rules Survey: Preliminary Report to the Judicial Conference Advisory Committee on Civil Rules, 2008 cases (published 2009))
- 53% higher costs were reported by plaintiff attorneys in federal cases that ended at trial than in cases that did not, all else equal (2010 FJC study). (Federal Judicial Center, Litigation Costs in Civil Cases: Multivariate Analysis, 2008 cases (published 2010))
- 24% higher costs were reported by defense attorneys in federal cases that ended at trial, all else equal, in a 2010 Federal Judicial Center study. (Federal Judicial Center, Litigation Costs in Civil Cases: Multivariate Analysis, 2008 cases (published 2010))
- 109% higher costs were reported by plaintiff attorneys at firms of over 500 lawyers than by sole practitioners, all else equal (2010 FJC study). (Federal Judicial Center, Litigation Costs in Civil Cases: Multivariate Analysis, 2008 cases (published 2010))
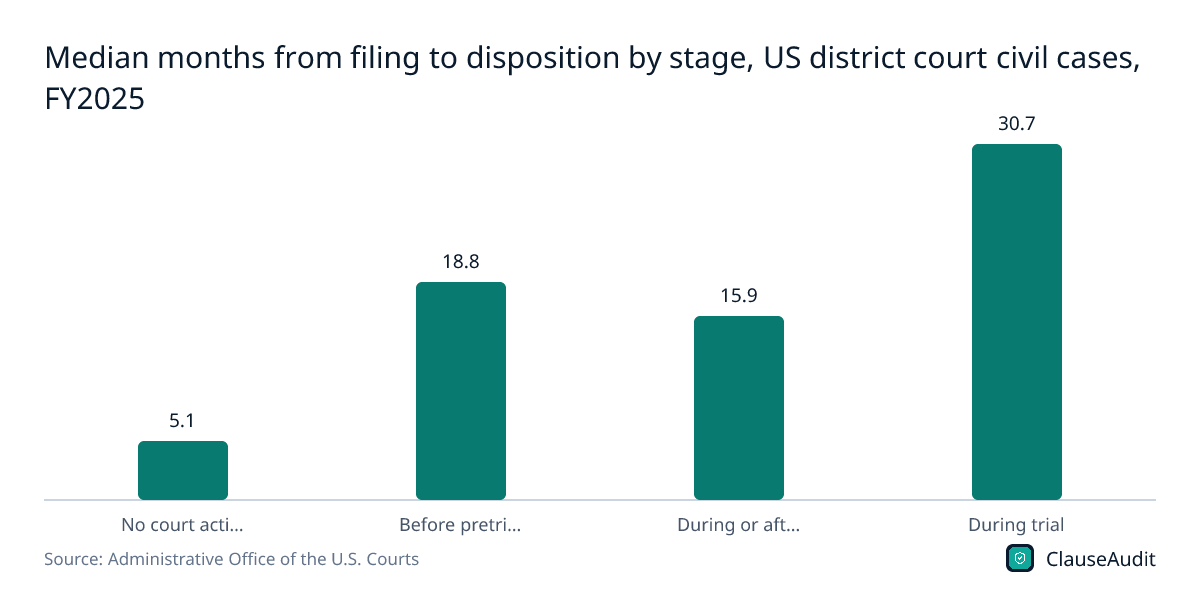
- 30.7 months was the median time from filing to disposition for the 1,462 federal civil cases resolved during trial in FY2025. (Administrative Office of the U.S. Courts, Table C-5: Median Time Intervals From Filing to Disposition of Civil Cases Terminated, by District and Method of Disposition, FY2025)
- 5.1 months was the median time to close the 52,285 federal civil cases that ended with no court action, such as early settlements or dismissals, in FY2025. (Administrative Office of the U.S. Courts, Table C-5: Median Time Intervals From Filing to Disposition of Civil Cases Terminated, by District and Method of Disposition, FY2025)
- less than 3 months is the average time to resolve an EEOC charge through mediation, against 10 months or longer for an investigation. (U.S. Equal Employment Opportunity Commission, Mediation, 2026)
Figure 2: Median months from filing to disposition by stage, US district court civil cases, FY2025
Chart data
| Label | Value |
|---|---|
| No court action | 5.1 |
| Before pretrial | 18.8 |
| During or after pretrial | 15.9 |
| During trial | 30.7 |
How Often Small Businesses Get Sued: Lawsuit Frequency Statistics
Few sources count lawsuits against small firms directly, so this section combines owner surveys, insurer claims data and corporate counsel surveys. Each figure is labeled with who was asked and when.
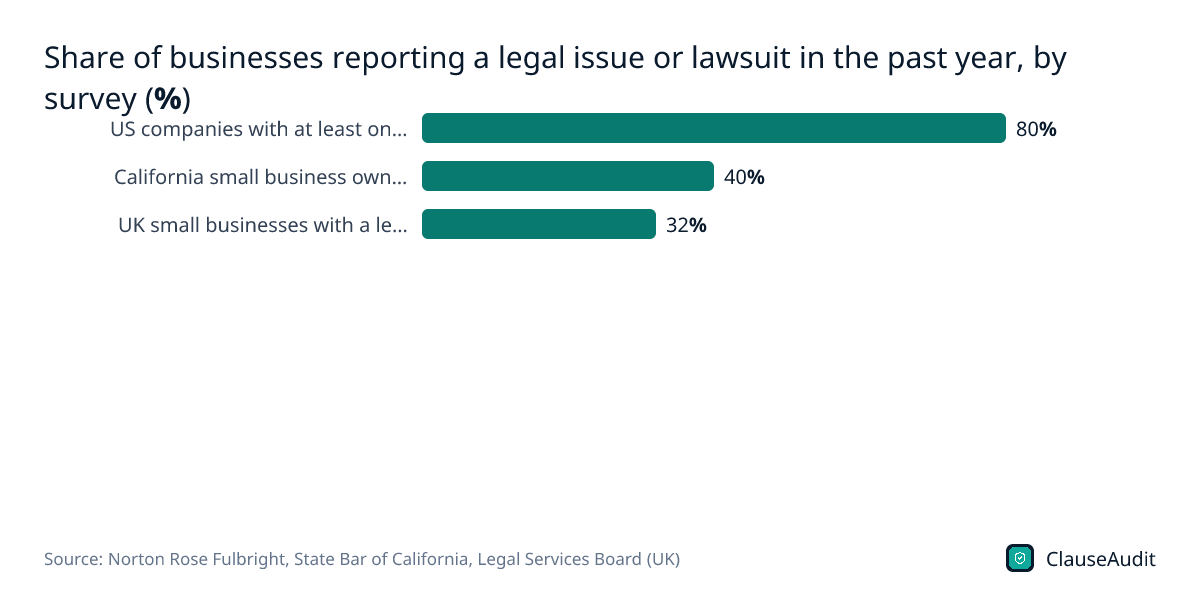
- 40% of California small business owners reported at least one legal need during 2023, averaging four legal needs each. (State Bar of California, 2024 California Justice Gap Study: Legal Needs of Small Business Owners, 2023)
- 50% of California small business owners who reported a legal need in 2023 had one involving contracts and agreements, the most common type of need. (State Bar of California, 2024 California Justice Gap Study: Legal Needs of Small Business Owners, 2023)
- 85% of surveyed California small business owners whose most recent legal need went unmet said they were hurt financially, such as lost business or revenue. (State Bar of California, 2024 California Justice Gap Study: Legal Needs of Small Business Owners, Most recent legal need (survey published 2024))
- 8 in 10 US companies surveyed by Norton Rose Fulbright were involved in at least one lawsuit in 2025, on par with 82% in 2024. (Norton Rose Fulbright, 2026 Annual Litigation Trends Survey: Perspectives from Corporate Counsel, 2025)
- 48 lawsuits per organization was the 2025 average among surveyed US companies, down from 62 in 2024. (Norton Rose Fulbright, 2026 Annual Litigation Trends Survey: Perspectives from Corporate Counsel, 2025)
- 46% of US corporate counsel expect lawsuits against their organization to rise over the next 12 months. (Norton Rose Fulbright, 2026 Annual Litigation Trends Survey: Perspectives from Corporate Counsel, 2026 outlook)
- 32% of UK small businesses had at least one legal issue in the prior 12 months, according to the 2021 Legal Services Board survey. (Legal Services Board (UK), Small Business Legal Needs Survey, 2021)
- 28% of UK small businesses with a legal issue lost income because of it, and 10% lost a customer or contract (2021 survey). (Legal Services Board (UK), Small Business Legal Needs Survey, 2021)
- 4 in 10 small businesses were projected in 2015 to face a property or general liability claim within 10 years, based on Hartford claims data. (The Hartford, The Hartford Reports More Than 40 Percent Of Small Businesses Will Experience A Claim In The Next 10 Years, 2015)
- 35% of general liability claims against The Hartford's small business customers ended in a lawsuit, per its 2015 claims analysis. (The Hartford, The Hartford Reports More Than 40 Percent Of Small Businesses Will Experience A Claim In The Next 10 Years, 2015 (2010-2014 claims data))
- 8,846 PAGA wage-and-hour notices were filed against California employers in fiscal 2024-25, with five law firms filing about 24% of them. (California Labor and Workforce Development Agency, Initial Statement of Reasons, Proposed PAGA Regulations (Z2026-0121-03), FY2024-25)
Figure 3: Share of businesses reporting a legal issue or lawsuit in the past year, by survey (%)
Chart data
| Label | Value |
|---|---|
| US companies with at least one lawsuit (Norton Rose Fulbright, 2025) | 80% |
| California small business owners with a legal need (State Bar, 2023) | 40% |
| UK small businesses with a legal issue (LSB, 2021) | 32% |
Contract Dispute and Breach of Contract Litigation Statistics
Contracts and agreements are the most common legal need among California small business owners. These figures cover trial outcomes, award sizes, federal contract filings and payment disputes raised by freelancers.
- 64% of state court contract trials in 2005 were decided by a judge, while 36% went to a jury. (U.S. Bureau of Justice Statistics, Contract Bench and Jury Trials in State Courts, 2005 (NCJ 225634), 2005)
- 33% of 2005 state court contract trials involved an individual suing a business, the most common pairing; business-versus-business suits made up 25%. (U.S. Bureau of Justice Statistics, Contract Bench and Jury Trials in State Courts, 2005 (NCJ 225634), 2005)
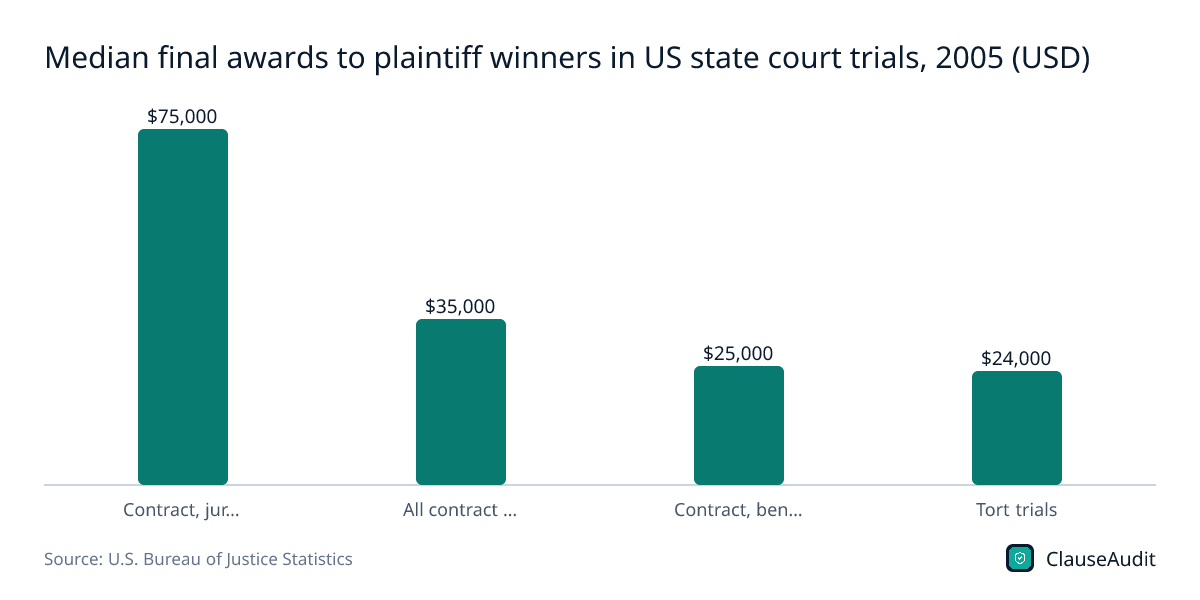
- $35,000 was the median damage award for plaintiffs who won state court contract trials in 2005. (U.S. Bureau of Justice Statistics, Contract Bench and Jury Trials in State Courts, 2005 (NCJ 225634), 2005)
- $75,000 was the median final award from juries in 2005 contract trials, three times the $25,000 median awarded by judges. (U.S. Bureau of Justice Statistics, Contract Bench and Jury Trials in State Courts, 2005 (NCJ 225634), 2005)
- 63% drop in contract trials in the 75 most populous US counties from 1992 to 2005, as more disputes settled before trial. (U.S. Bureau of Justice Statistics, Civil Bench and Jury Trials in State Courts, 2005, 1992-2005)
- 13% fall in federal district court contract actions (down 3,426 cases) in the year to March 31, 2025, as insurance cases fell 28%. (Administrative Office of the U.S. Courts, Federal Judicial Caseload Statistics 2025, 12 months to March 31, 2025)
- 8.6% is the average value erosion businesses suffer from poor contract management, according to World Commerce & Contracting research. (World Commerce & Contracting, Contract Management Whitepaper, 2025)
- 83% of executives say their contracts are too rigid to adapt to change. (World Commerce & Contracting, Contract Management Whitepaper, 2025)
- 11% value erosion was identified in procurement contracts by World Commerce & Contracting, which links it to unmanaged change and avoidable disputes. (World Commerce & Contracting, Contracting: The Overlooked Source of Procurement Value, 2026)
- 2,542 complaints were filed by New York City freelancers under the Freelance Isn't Free Act in fiscal years 2019 through 2023, mostly over late or non-payment. (NYC Department of Consumer and Worker Protection, Freelance Isn't Free Act Five-Year Report, FY2019-FY2023)
- $2.9 million was recovered by at least 773 NYC freelancers after filing payment complaints with the city over fiscal years 2019 to 2023. (NYC Department of Consumer and Worker Protection, Freelance Isn't Free Act Five-Year Report, FY2019-FY2023)
- 77,487 small claims cases (up to $12,500, without lawyers) were filed in California superior courts in FY 2024-25. (Judicial Council of California, 2026 Court Statistics Report: Statewide Caseload Trends, FY 2024-25)
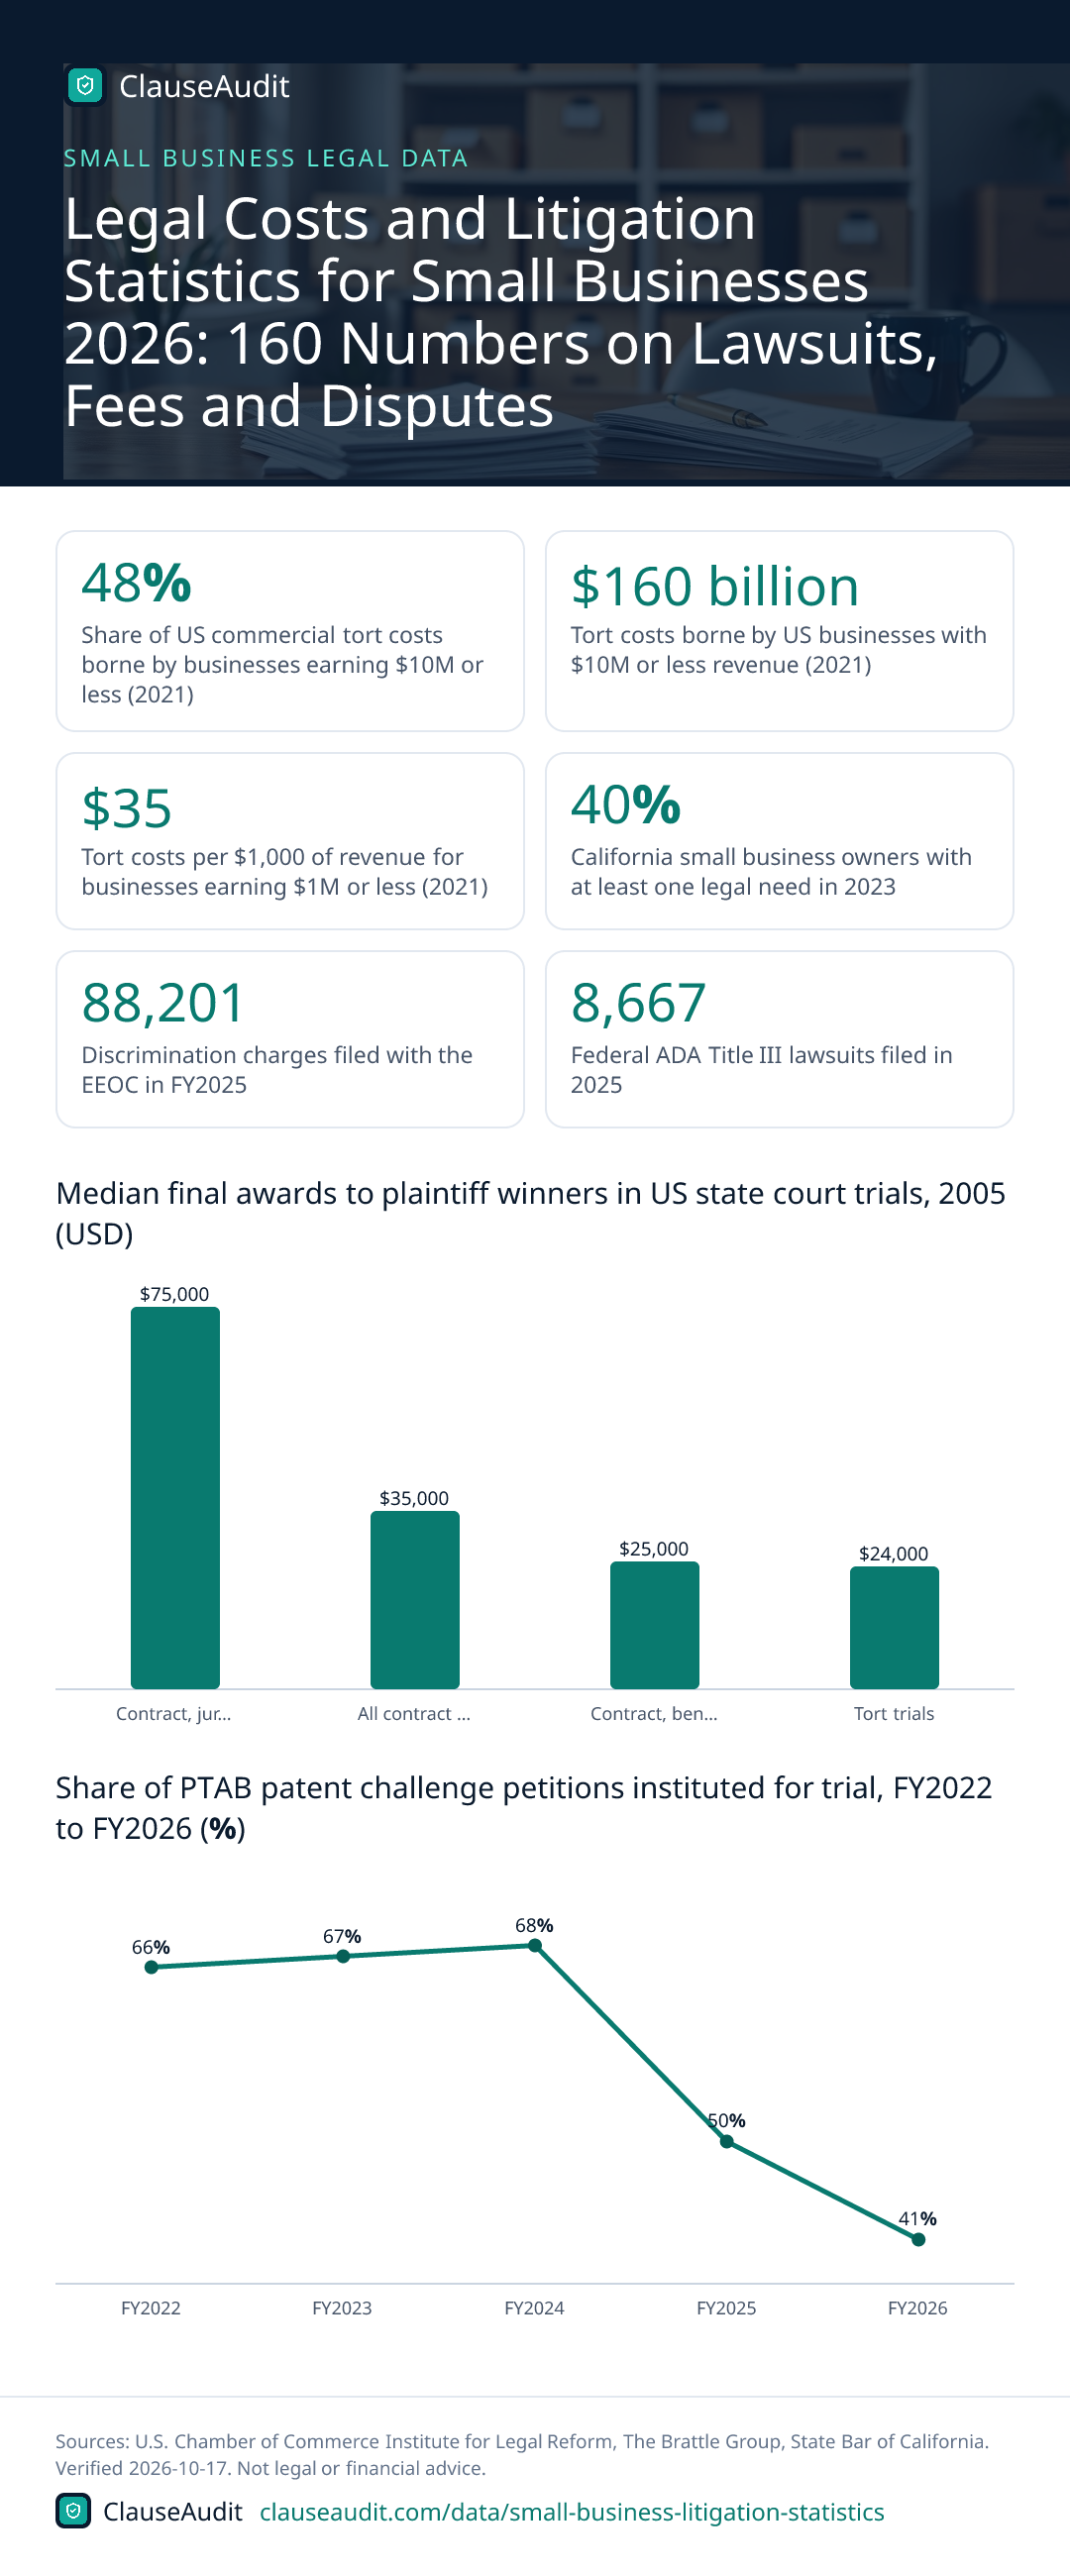
Figure 4: Median final awards to plaintiff winners in US state court trials, 2005 (USD)
Chart data
| Label | Value (USD) |
|---|---|
| Contract, jury trials | $75,000 |
| All contract trials | $35,000 |
| Contract, bench trials | $25,000 |
| Tort trials | $24,000 |
Employment Lawsuit Statistics for Small Businesses
Many employment disputes start as an agency charge or a wage claim before any lawsuit is filed. This section covers EEOC charges and outcomes, federal wage recoveries and California civil rights complaints.
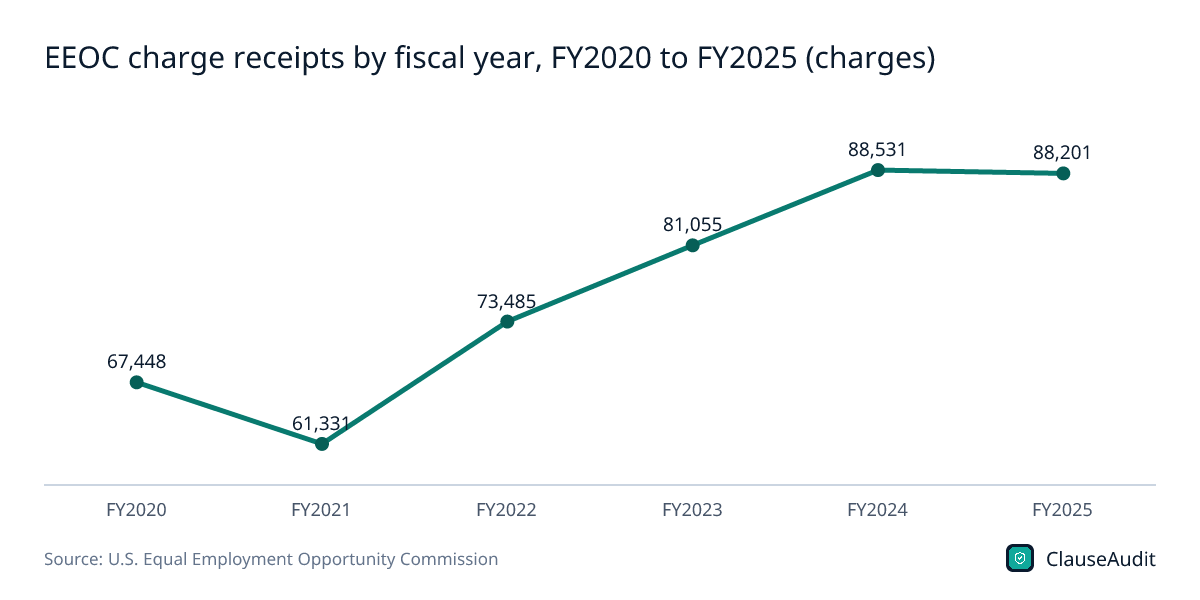
- 88,201 discrimination charges were filed with the EEOC in FY2025, close to FY2024's 88,531 and up from 61,331 in FY2021. (U.S. Equal Employment Opportunity Commission, Table E1c. Charge Receipts and Resolutions by Type (All Statutes), FY 1997 - FY 2025, FY2025)
- 54,350 EEOC charges in FY2025 alleged retaliation, 61.6% of all charges and the most common basis by far. (U.S. Equal Employment Opportunity Commission, Table E1a. Charge Receipts by Basis or Statute (All Statutes) FY 1997 - FY 2025, FY2025)
- 36,256 EEOC charges in FY2025 alleged disability discrimination, 41.1% of all charges filed. (U.S. Equal Employment Opportunity Commission, Table E1a. Charge Receipts by Basis or Statute (All Statutes) FY 1997 - FY 2025, FY2025)
- $528 million in monetary benefits was secured by the EEOC for workers through its administrative charge process in FY2025, before any lawsuit. (U.S. Equal Employment Opportunity Commission, Table E1c. Charge Receipts and Resolutions by Type (All Statutes), FY 1997 - FY 2025, FY2025)
- 63.4% of EEOC charge resolutions in FY2025 ended in a no reasonable cause finding, 57,500 of 90,744 resolutions. (U.S. Equal Employment Opportunity Commission, Table E1c. Charge Receipts and Resolutions by Type (All Statutes), FY 1997 - FY 2025, FY2025)
- 7.5% of EEOC charge resolutions in FY2025 were settlements, 6,843 charges in all. (U.S. Equal Employment Opportunity Commission, Table E1c. Charge Receipts and Resolutions by Type (All Statutes), FY 1997 - FY 2025, FY2025)
- 94 merits lawsuits were filed by the EEOC in FY2025, down from 111 in FY2024 and 143 in FY2023. (U.S. Equal Employment Opportunity Commission, Table L1. Litigation Statistics FY 1997 - FY 2025, FY2025)
- $26.64 million was recovered through EEOC litigation in FY2025, down from $40.4 million in FY2024. (U.S. Equal Employment Opportunity Commission, Table L1. Litigation Statistics FY 1997 - FY 2025, FY2025)
- $259,294,764 in back wages was recovered by the Labor Department's Wage and Hour Division for 176,957 workers in FY2025, up from $202,676,115 in FY2024. (U.S. Department of Labor, Wage and Hour Division, WHD Enforcement Statistics: All Acts, FY2025)
- $1,465 was the average wage recovery per worker in Wage and Hour Division cases in FY2025. (U.S. Department of Labor, Wage and Hour Division, Wage and Hour Division Data, FY2025)
- 16,924 of the 33,505 intake forms filed with California's Civil Rights Department in 2024 were immediate right-to-sue requests, clearing the way for employment lawsuits. (California Civil Rights Department, California Civil Rights Department 2024 Annual Report, 2024)
- $99,411,396 in monetary relief came from 872 settlements secured by California's Civil Rights Department in 2024. (California Civil Rights Department, California Civil Rights Department 2024 Annual Report, 2024)
- 1.0% of the 10,185 private employment civil rights cases closed in federal court in FY2025 reached trial; most ended earlier. (Administrative Office of the U.S. Courts, Table C-4: Civil Cases Terminated, by Nature of Suit and Action Taken, FY2025)
- $184,425,856 in Fair Labor Standards Act back wages was recovered for 145,798 workers in FY2025, up from $149,957,029 in FY2024. (U.S. Department of Labor, Wage and Hour Division, WHD Enforcement Statistics: Fair Labor Standards Act, FY2025)
Figure 5: EEOC charge receipts by fiscal year, FY2020 to FY2025 (charges)
Chart data
| Label | Value (charges) |
|---|---|
| FY2020 | 67,448 |
| FY2021 | 61,331 |
| FY2022 | 73,485 |
| FY2023 | 81,055 |
| FY2024 | 88,531 |
| FY2025 | 88,201 |
ADA and Website Accessibility Lawsuit Statistics
ADA Title III lets private plaintiffs sue businesses over access barriers, including on websites. California had more federal filings than any other state in 2025, and 95.7% of its reported access complaints and demand letters that year came from 10 law firms.
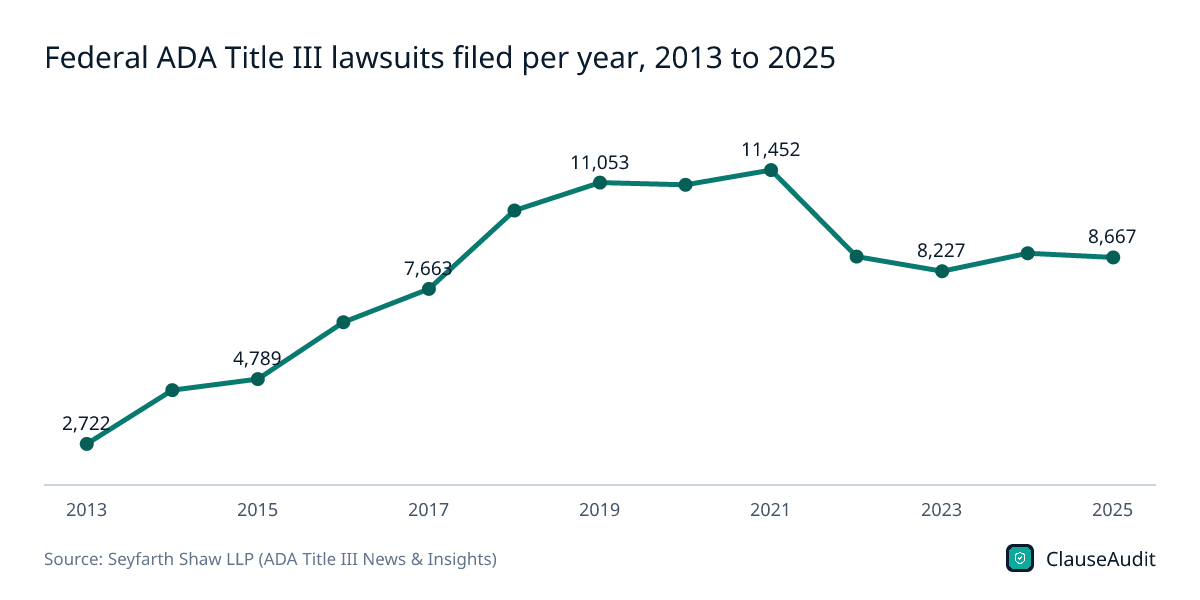
- 8,667 ADA Title III lawsuits were filed in or removed to US federal courts in 2025, 2% fewer than in 2024. (Seyfarth Shaw LLP (ADA Title III News & Insights), ADA Title III Federal Lawsuit Filings Fall Slightly to 8,667 in 2025, 2025)
- 11,452 federal ADA Title III lawsuits in 2021 remain the all-time annual high; 2025 filings were still three times the 2013 level. (Seyfarth Shaw LLP (ADA Title III News & Insights), ADA Title III Federal Lawsuit Filings Fall Slightly to 8,667 in 2025, 2021)
- 3,252 federal ADA Title III suits were filed in California in 2025, the most of any state, ahead of Florida's 1,823. (Seyfarth Shaw LLP (ADA Title III News & Insights), ADA Title III Federal Lawsuit Filings Fall Slightly to 8,667 in 2025, 2025)
- 3,117 federal website accessibility lawsuits were filed in 2025, a 27% increase from 2,452 in 2024. (Seyfarth Shaw LLP (ADA Title III News & Insights), Federal Court Website Accessibility Lawsuit Filings Bounce Back in 2025, 2025)
- 36% of all federal ADA Title III lawsuits in 2025 were website accessibility cases, up from 28% in 2024. (Seyfarth Shaw LLP (ADA Title III News & Insights), Federal Court Website Accessibility Lawsuit Filings Bounce Back in 2025, 2025)
- 5,006 federal ADA Title III suits were filed in the first half of 2026, a 9% increase over the same period of 2025. (Seyfarth Shaw LLP (ADA Title III News & Insights), 2026 Mid-Year Report: ADA Title III Federal Lawsuit Numbers Are Climbing, H1 2026)
- 4,928 web accessibility lawsuits were filed by plaintiffs in 2025, counting the state and federal cases UsableNet tracks. (UsableNet, ADA Website Compliance Lawsuit Tracker, 2025)
- 6,000+ digital accessibility lawsuits are projected for 2026 in UsableNet's midyear report. (UsableNet, 2026 Midyear Report on Digital Accessibility Lawsuits in the US, 2026 projection)
- 36% of companies sued over digital accessibility in the first half of 2025 had annual revenue above $25 million, by UsableNet's count. (UsableNet, ADA Website Compliance Lawsuit Tracker, H1 2025)
- 69% of digital accessibility lawsuits in the first half of 2025 targeted eCommerce businesses, followed by food service and healthcare. (UsableNet via Newswire.com, Digital Accessibility Lawsuits Surge in 2025 (press release), H1 2025)
- 3,710 state and federal disability access complaints were reported to California's CCDA in 2025, plus 645 prelitigation demand letters. (California Commission on Disability Access (Department of General Services), 2025 CCDA Annual Report, 2025)
- 95.7% of California disability access complaints and demand letters reported in 2025 came from just 10 law firms. (California Commission on Disability Access (Department of General Services), 2025 CCDA Annual Report, 2025)
- 41.7% of California disability access cases reported resolved in 2025 ended only in settlement; 32.6% ended only in dismissal. (California Commission on Disability Access (Department of General Services), 2025 CCDA Annual Report, 2025)
Figure 6: Federal ADA Title III lawsuits filed per year, 2013 to 2025
Chart data
| Label | Value |
|---|---|
| 2013 | 2,722 |
| 2014 | 4,436 |
| 2015 | 4,789 |
| 2016 | 6,601 |
| 2017 | 7,663 |
| 2018 | 10,163 |
| 2019 | 11,053 |
| 2020 | 10,982 |
| 2021 | 11,452 |
| 2022 | 8,694 |
| 2023 | 8,227 |
| 2024 | 8,800 |
| 2025 | 8,667 |
Patent, Trademark and IP Litigation Statistics for Small Companies
Patent, trademark and copyright cases can reach small companies as defendants, often brought by non-practicing entities. This section also covers lower-cost routes such as the Copyright Claims Board and domain name disputes.
- 1,166 US district court patent cases were filed in Q3 2026, up 15.6% from Q2 and the highest quarterly total since Q2 2025. (Unified Patents, Patent Dispute Report: Q3 2026, Q3 2026)
- 55.7% of US district court patent cases in Q3 2026 were filed by non-practicing entities, 650 of 1,166 (provisional figures). (Unified Patents, Patent Dispute Report: Q3 2026, Q3 2026)
- 34.3% of all US district court patent cases in Q3 2026 were filed in the Eastern District of Texas, 400 cases. (Unified Patents, Patent Dispute Report: Q3 2026, Q3 2026)
- 17,234 intellectual property cases were filed in US district courts in FY2025, up 16% from the prior year. (Administrative Office of the U.S. Courts, U.S. District Courts: Judicial Business 2025, FY2025)
- 4,075 patent cases were filed in US district courts in FY2025, up 23%. (Administrative Office of the U.S. Courts, U.S. District Courts: Judicial Business 2025, FY2025)
- 4,211 trademark cases were filed in US district courts in FY2025, up 25% from FY2024. (Administrative Office of the U.S. Courts, U.S. District Courts: Judicial Business 2025, FY2025)
- 500 patent validity challenges (452 inter partes reviews and 48 post-grant reviews) were filed at the USPTO's PTAB in FY2026. (U.S. Patent and Trademark Office, Patent Trial and Appeal Board, PTAB Trial Statistics, September 2026, FY2026)
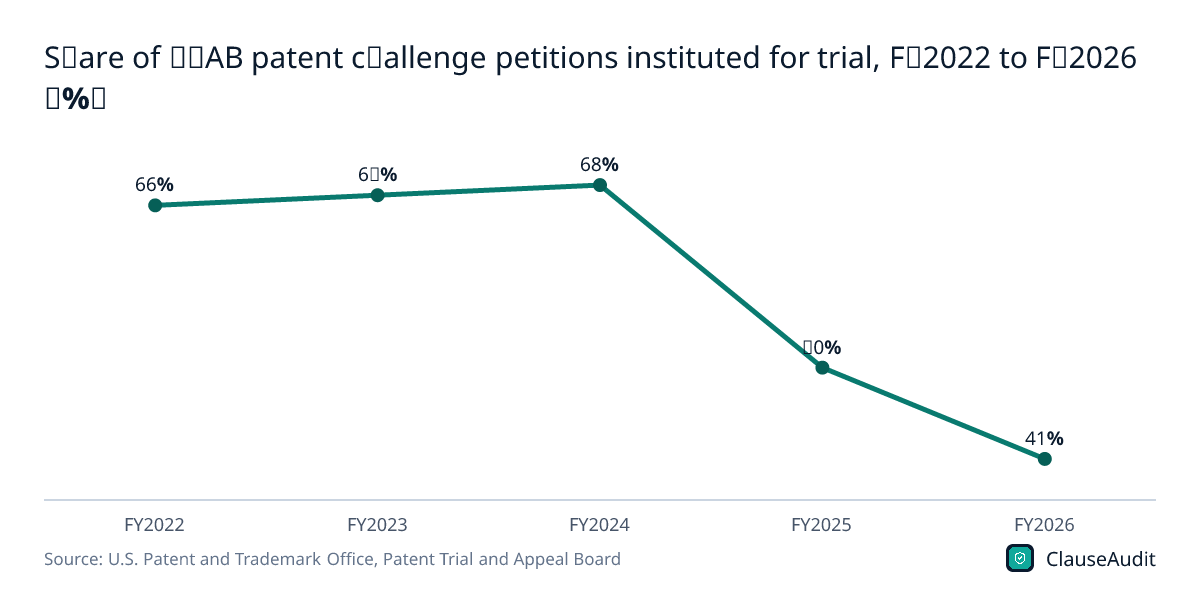
- 41% of PTAB petitions were instituted for trial in FY2026, down from 68% in FY2024, making it harder for accused companies to challenge patents. (U.S. Patent and Trademark Office, Patent Trial and Appeal Board, PTAB Trial Statistics, September 2026, FY2026)
- About one-fifth of US patent infringement lawsuits filed from 2007 to 2011 were brought by non-practicing entities, GAO found in a 2013 study. (U.S. Government Accountability Office, Intellectual Property: Assessing Factors That Affect Patent Infringement Litigation Could Help Improve Patent Quality (GAO-13-465), 2007-2011)
- 1,920 copyright claims were filed at the Copyright Claims Board, the small claims tribunal for disputes up to $30,000, from June 2022 to March 2026. (U.S. Copyright Office, Copyright Claims Board, Copyright Claims Board Key Statistics, 06/2022 to 03/2026, 06/2022-03/2026)
- 67% of Copyright Claims Board claimants were self-represented individuals, with only 16% using outside counsel. (U.S. Copyright Office, Copyright Claims Board, Copyright Claims Board Key Statistics, 06/2022 to 03/2026, 06/2022-03/2026)
- $3,598.58 was the average damages award in Copyright Claims Board determinations that included damages, through December 2025. (U.S. Copyright Office, CASE Act Report: A Report of the Register of Copyrights, Through December 2025)
- 80,000+ domain name disputes have been administered by WIPO under the UDRP, a fast low-cost route for trademark owners facing cybersquatters. (World Intellectual Property Organization, WIPO Arbitration and Mediation Center Caseload Summary, Cumulative to 2026)
Figure 7: Share of PTAB patent challenge petitions instituted for trial, FY2022 to FY2026 (%)
Chart data
| Label | Value (%) |
|---|---|
| FY2022 | 66% |
| FY2023 | 67% |
| FY2024 | 68% |
| FY2025 | 50% |
| FY2026 | 41% |
Civil Litigation Caseload and Time-to-Resolution Statistics
Court caseloads show how long a dispute is likely to take once filed. These figures cover federal filings, trial rates, time to disposition and time to trial, plus state and UK court data.
- 303,563 civil cases were filed in US district courts in FY2025, up 4% or 12,667 cases from 2024. (Administrative Office of the U.S. Courts, U.S. District Courts: Judicial Business 2025, FY2025)
- 96,548 diversity of citizenship cases, disputes between citizens of different states, were filed in US district courts in FY2025, down 7% or 7,706 cases. (Administrative Office of the U.S. Courts, U.S. District Courts: Judicial Business 2025, FY2025)
- 15.6 months was the median time from filing to disposition for federal civil cases in FY2025, up from 13.7 months in 2024. (Administrative Office of the U.S. Courts, U.S. District Courts: Judicial Business 2025, FY2025)
- 3,377 civil trials were held in US district courts in FY2025, up 2% or 82 trials. (Administrative Office of the U.S. Courts, U.S. District Courts: Judicial Business 2025, FY2025)
- 432,923 civil cases were pending in US district courts at the end of FY2025, down 19% as closures outpaced new filings. (Administrative Office of the U.S. Courts, U.S. District Courts: Judicial Business 2025, FY2025)
- 0.4% of the 407,379 federal civil cases terminated in FY2025 reached trial; the rest ended before or without one. (Administrative Office of the U.S. Courts, Table C-4: Civil Cases Terminated, by Nature of Suit and Action Taken, FY2025)
- 1.7% of the 11,348 diversity other contract cases closed in federal court in FY2025 reached trial. (Administrative Office of the U.S. Courts, Table C-4: Civil Cases Terminated, by Nature of Suit and Action Taken, FY2025)
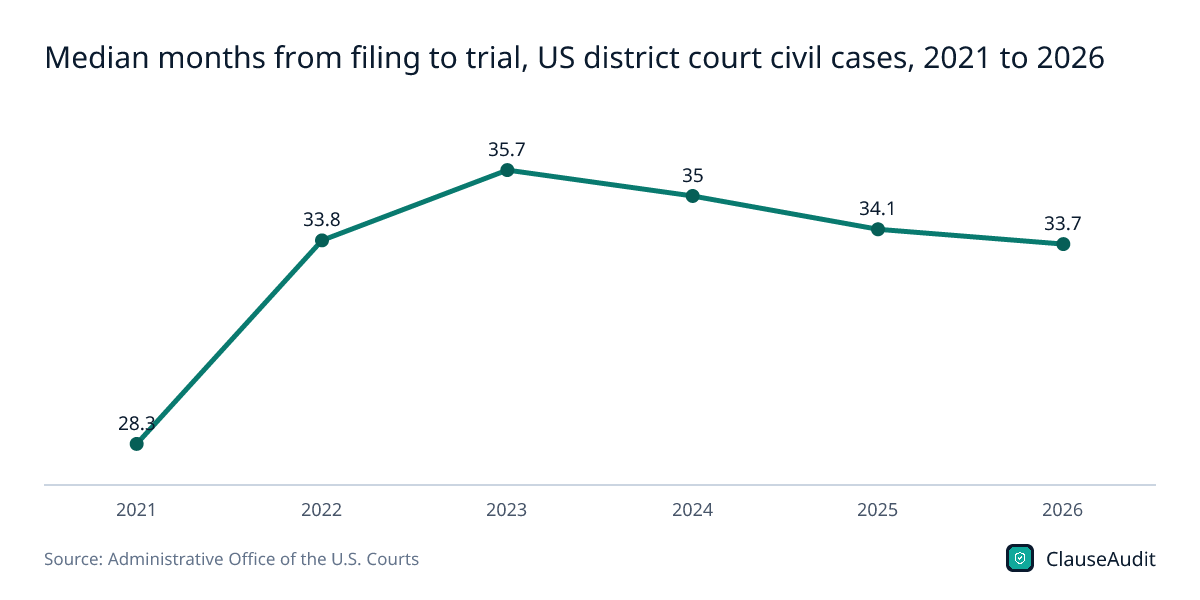
- 33.7 months was the median time from filing to trial for federal civil cases in the 12 months to June 30, 2026, versus 28.3 months in 2021. (Administrative Office of the U.S. Courts, U.S. District Court - Judicial Caseload Profile (Federal Court Management Statistics, June 2026), 12 months ending June 30, 2026)
- 125,478 federal civil cases, 26.2% of the civil docket, were more than three years old as of June 30, 2026. (Administrative Office of the U.S. Courts, U.S. District Court - Judicial Caseload Profile (Federal Court Management Statistics, June 2026), June 30, 2026)
- 30,492 contract cases were filed in US district courts in the 12 months ending June 30, 2026. (Administrative Office of the U.S. Courts, U.S. District Court - Judicial Caseload Profile (Federal Court Management Statistics, June 2026), 12 months ending June 30, 2026)
- 70M cases were filed in US state courts in 2024, up 4% from 2023 but 27% below 2012. (National Center for State Courts, Court caseload data, 2024)
- 41.0 weeks was the median time for small claims in England and Wales county courts to reach trial in April to June 2026. (UK Ministry of Justice, Civil Justice Statistics Quarterly: April to June 2026, April to June 2026)
Figure 8: Median months from filing to trial, US district court civil cases, 2021 to 2026
Chart data
| Label | Value |
|---|---|
| 2021 | 28.3 |
| 2022 | 33.8 |
| 2023 | 35.7 |
| 2024 | 35 |
| 2025 | 34.1 |
| 2026 | 33.7 |
Attorney Fees and Small Business Legal Spending Statistics
Law firm billing rates grew at a record pace in 2025. These figures cover published hourly rate benchmarks, billing rate growth, legal sector revenue and how often small business owners seek legal help.
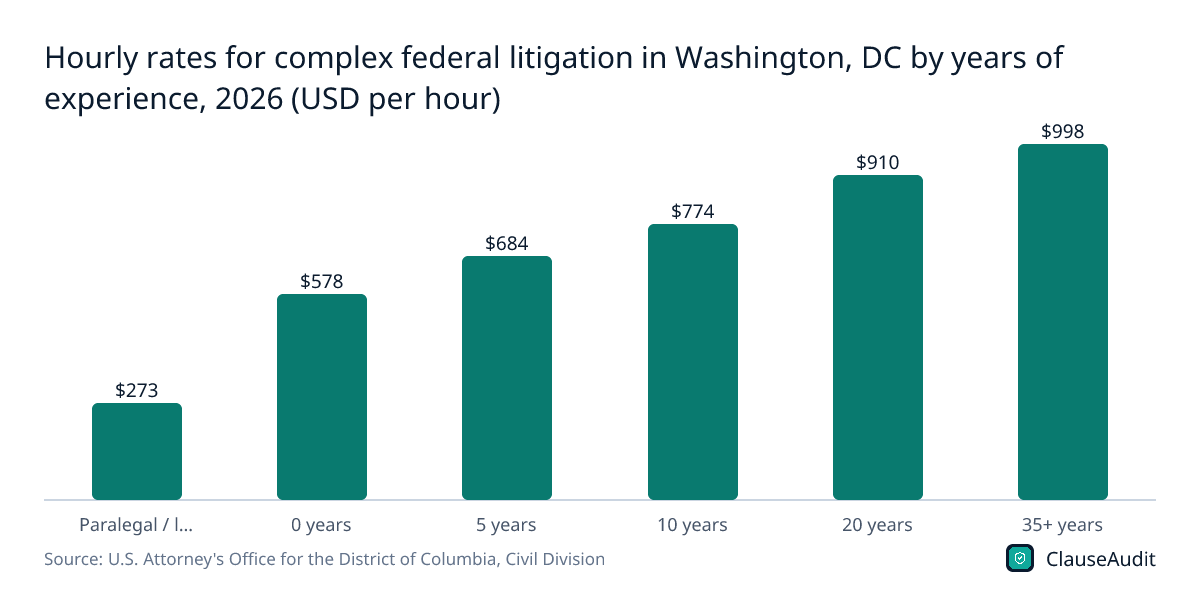
- $998 per hour is the 2026 Fitzpatrick Matrix rate for a lawyer with 35+ years' experience in complex federal litigation in Washington, DC. (U.S. Attorney's Office for the District of Columbia, Civil Division, The Fitzpatrick Matrix, 2013-2026, 2026)
- $578 per hour is the 2026 Fitzpatrick Matrix rate for a newly graduated lawyer, up from $540 in 2025. (U.S. Attorney's Office for the District of Columbia, Civil Division, The Fitzpatrick Matrix, 2013-2026, 2026)
- $273 per hour is the 2026 Fitzpatrick Matrix rate for paralegals and law clerks, up from $130 in 2013. (U.S. Attorney's Office for the District of Columbia, Civil Division, The Fitzpatrick Matrix, 2013-2026, 2026)
- 7.3% was the 2025 growth in law firm worked billing rates, a record according to the Thomson Reuters Institute. (Thomson Reuters Institute, 2026 State of the US Legal Market, 2025)
- 5.1% was the average law firm partner rate increase in 2025, tied for the second-highest since CounselLink's reports began in 2013. (LexisNexis CounselLink, LexisNexis CounselLink Releases 2026 Trends Report, 2025)
- 40% higher median partner rates were charged by the largest law firms than by the next tier in 2025, down from a 61% gap. (LexisNexis CounselLink, LexisNexis CounselLink Releases 2026 Trends Report, 2025)
- $159,670 was the median annual pay for US lawyers in 2025, or $76.76 per hour, before firm overhead and markup. (U.S. Bureau of Labor Statistics, Occupational Outlook Handbook: Lawyers, 2025)
- $118.2 billion in seasonally adjusted revenue was earned by US legal services firms in the second quarter of 2026. (U.S. Census Bureau, Quarterly Selected Services Estimates, Second Quarter 2026 (CB26-146), Q2 2026)
- 9.0% year-over-year growth in US legal services revenue was recorded in the second quarter of 2026. (U.S. Census Bureau, Quarterly Selected Services Estimates, Second Quarter 2026 (CB26-146), Q2 2026)
- 67% of surveyed California small business owners who did not seek legal help said they were worried about the cost of talking to a lawyer (121 respondents). (State Bar of California, 2024 California Justice Gap Study: Legal Needs of Small Business Owners, Most recent legal need (survey published 2024))
- 61% of surveyed California small business owners talked to a lawyer about their most recent legal need, while 93% looked online (121 respondents, may not be representative). (State Bar of California, 2024 California Justice Gap Study: Legal Needs of Small Business Owners, Most recent legal need (survey published 2024))
- 25% of UK small businesses with a legal issue used professional help in 2021; accountants were consulted more often than solicitors. (Legal Services Board (UK), Small Business Legal Needs Survey, 2021)
- US$4.1 million was the average 2025 litigation spend for companies with US$1 billion or more in revenue, down from US$4.3 million. (Norton Rose Fulbright, 2026 Annual Litigation Trends Survey: Perspectives from Corporate Counsel, 2025)
- $62,890 was the median annual wage for US paralegals and legal assistants in May 2025, whose time is often billed to clients. (U.S. Bureau of Labor Statistics, Occupational Outlook Handbook: Paralegals and Legal Assistants, May 2025)
Figure 9: Hourly rates for complex federal litigation in Washington, DC by years of experience, 2026 (USD per hour)
Chart data
| Label | Value (USD per hour) |
|---|---|
| Paralegal / law clerk | $273 |
| 0 years | $578 |
| 5 years | $684 |
| 10 years | $774 |
| 20 years | $910 |
| 35+ years | $998 |
Business Liability Insurance and EPLI Claim Statistics
Liability insurance is one way small businesses cover the cost of claims against them. This section covers rising liability losses, premium growth and average small business EPLI and general liability premiums.
- $231.6 billion to $281.2 billion in added US liability insurance losses over the past decade is attributed to legal system abuse by the CAS and Triple-I. (Casualty Actuarial Society, New CAS and Triple-I Analysis Quantifies Impact of Legal System Abuse on Liability Insurance, Decade to year-end 2024)
- $83.4 billion to $103.3 billion in added other liability (occurrence) losses, the line covering general liability, came from legal system abuse, 27.4% to 34.0% of booked losses. (Casualty Actuarial Society, New CAS and Triple-I Analysis Quantifies Impact of Legal System Abuse on Liability Insurance, Decade to year-end 2024)
- $52.0 billion to $70.8 billion in added commercial auto liability losses over the decade came from legal system abuse, 22.6% to 30.8% of booked losses. (Casualty Actuarial Society, New CAS and Triple-I Analysis Quantifies Impact of Legal System Abuse on Liability Insurance, Decade to year-end 2024)
- 78% surge in commercial auto liability claim severity from 2014 to 2023, per a joint CAS and Triple-I report. (Casualty Actuarial Society, New Joint CAS and Triple-I Report: Increasing Economic and Social Inflation Continue, 2014-2023)
- 7% rise in US casualty insurance rates in Q2 2026, while every other region Marsh tracks saw rates fall. (Marsh, Global Insurance Market Index, Q2 2026, Q2 2026)
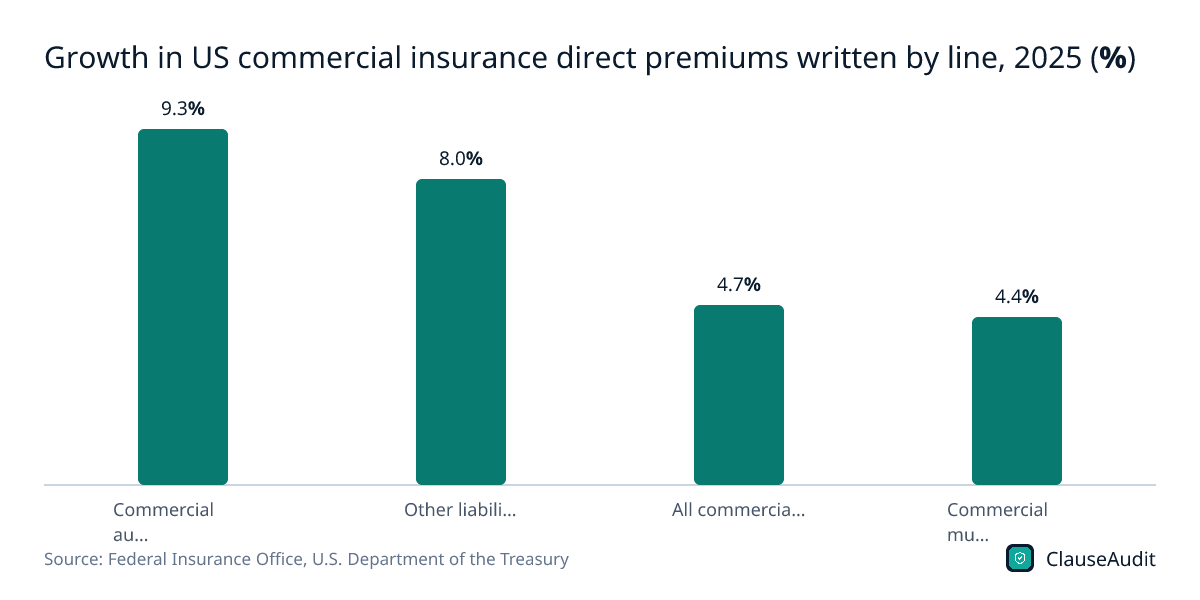
- 8.0% increase in US other liability direct premiums written in 2025, driven by rate increases to counter underwriting losses. (Federal Insurance Office, U.S. Department of the Treasury, Annual Report on the Insurance Industry, 2025)
- 9.3% gain in US commercial auto liability direct premiums written in 2025, the fastest-growing commercial liability line cited by Treasury. (Federal Insurance Office, U.S. Department of the Treasury, Annual Report on the Insurance Industry, 2025)
- 4.7% increase in US commercial lines direct premiums written in 2025. (Federal Insurance Office, U.S. Department of the Treasury, Annual Report on the Insurance Industry, 2025)
- $257 per month is the average employment practices liability insurance premium paid by small businesses buying through Insureon. (Insureon, How Much Does Employment Practices Liability Insurance Cost?, 2026)
- $10,000 is the average EPLI deductible Insureon's small business customers select. (Insureon, How Much Does Employment Practices Liability Insurance Cost?, 2026)
- $45 per month is the average general liability premium for small businesses buying through Insureon; 22% pay less than $30. (Insureon, How Much Does General Liability Insurance Cost?, 2026)
- 1,288 nuclear verdicts of $10 million or more were awarded by US juries from 2013 to 2022. (U.S. Chamber of Commerce Institute for Legal Reform, Nuclear Verdicts: An Update on Trends, Causes, and Solutions, 2013-2022)
- 19% of US company drivers say their employer has faced legal action over a driving-related incident, in a 2025 survey of 400 drivers. (Nationwide, Accident anxiety: 7 in 10 company drivers fear injury, death or lawsuits, 2025)
Arbitration, Mediation and ADR Statistics for Business Disputes
Many business contracts send disputes to arbitration or mediation instead of court. These figures cover caseloads, amounts in dispute, costs, duration and settlement rates at major US and international institutions.
- 580,000 cases were filed with the American Arbitration Association in 2025. (American Arbitration Association, American Arbitration Association - homepage figures, 2025)
- $29 billion in business-to-business claims and counterclaims was filed with the American Arbitration Association in 2025. (American Arbitration Association, American Arbitration Association - homepage figures, 2025)
- nearly 22,000 new cases were filed with JAMS in 2025, and it handled more than 28,000 matters during the year. (JAMS, About JAMS, 2025)
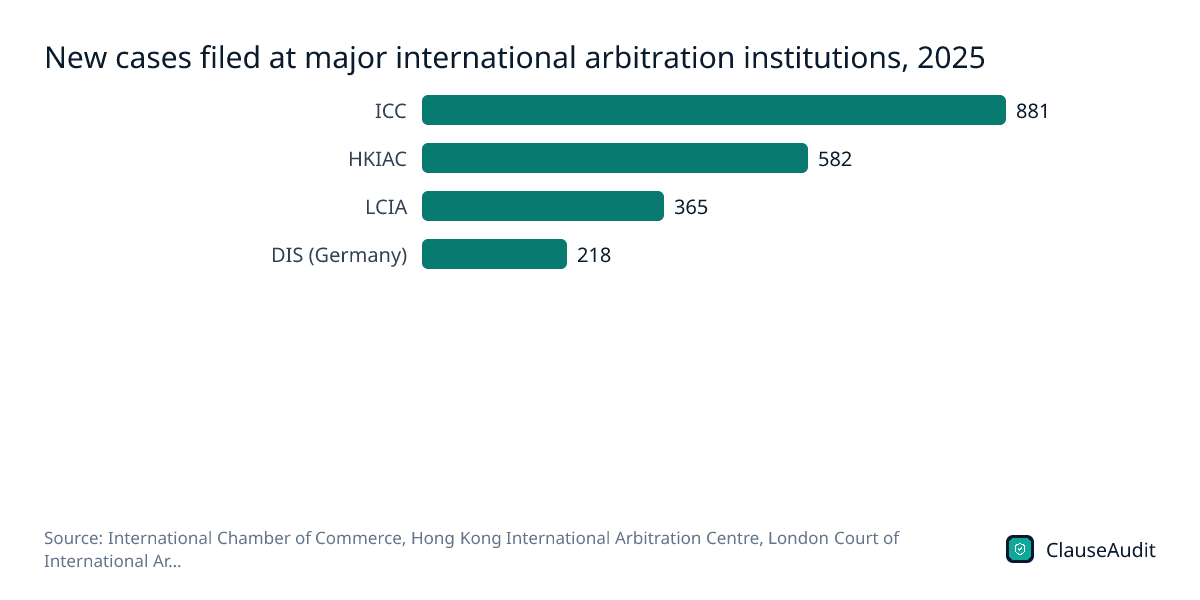
- 881 cases were filed under the ICC Arbitration Rules in 2025. (International Chamber of Commerce, ICC Dispute Resolution 2025 Statistics Report, 2025)
- 36% of new ICC arbitrations registered in 2025 involved US$3 million or less, the threshold for its expedited procedure. (International Chamber of Commerce, ICC Dispute Resolution 2025 Statistics Report, 2025)
- US$5 million was the median amount in dispute in new ICC arbitration cases in 2025. (International Chamber of Commerce, ICC Dispute Resolution 2025 Statistics Report, 2025)
- 365 referrals were received by the London Court of International Arbitration in 2025, including 320 LCIA Rules arbitrations. (London Court of International Arbitration, LCIA Annual Casework Report 2025, 2025)
- USD 117,653 was the median cost of an LCIA arbitration for cases reaching a final award between January 2017 and May 2024. (London Court of International Arbitration, LCIA Annual Casework Report 2025, 2017 to May 2024)
- 20 months was the median duration of LCIA arbitrations reaching a final award between January 2017 and May 2024. (London Court of International Arbitration, LCIA Annual Casework Report 2025, 2017 to May 2024)
- 582 cases were submitted to the Hong Kong International Arbitration Centre in 2025, 388 of them arbitrations. (Hong Kong International Arbitration Centre, HKIAC Statistics, 2025)
- 82% of the 288 FINRA mediation cases closed from January to August 2026 settled, the same rate as a year earlier. (FINRA Dispute Resolution Services, Dispute Resolution Statistics, January to August 2026)
- 2,597 arbitration cases were filed with FINRA Dispute Resolution Services in 2025, up from 2,469 in 2024. (FINRA Dispute Resolution Services, Dispute Resolution Statistics, 2025)
- 218 new proceedings were initiated at the German Arbitration Institute in 2025, up from 158 in 2024, with a median dispute value of 913,320 euros. (German Arbitration Institute (DIS), Our work in numbers, 2025)
- 70% of WIPO mediation cases have ended in settlement, against 33% of WIPO arbitration cases, across its IP and technology docket. (World Intellectual Property Organization, WIPO Arbitration and Mediation Center Caseload Summary, Cumulative to 2026)
- 213 new cases were registered by the SCC Arbitration Institute in Stockholm in 2025, 38% of them under its expedited rules. (SCC Arbitration Institute, SCC Statistics 2025, 2025)
- EUR 2,489,919 was the average amount in dispute under the SCC Expedited Arbitration Rules in 2025, the track built for smaller claims. (SCC Arbitration Institute, SCC Statistics 2025, 2025)
- $75,530 was the median annual wage for US arbitrators, mediators and conciliators in May 2025. (U.S. Bureau of Labor Statistics, Occupational Outlook Handbook: Arbitrators, Mediators, and Conciliators, May 2025)
Figure 11: New cases filed at major international arbitration institutions, 2025
Chart data
| Label | Value |
|---|---|
| ICC | 881 |
| HKIAC | 582 |
| LCIA | 365 |
| DIS (Germany) | 218 |
India Commercial Court and MSME Dispute Statistics
More than 5 crore cases were pending in India's district courts in October 2026. This section covers pending cases, MSME delayed-payment claims, Lok Adalat settlements and the cost and time to enforce a contract.
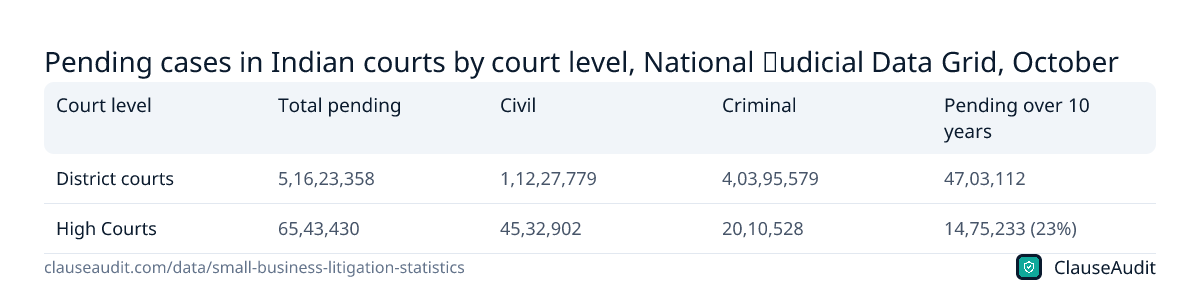
- 5,16,23,358 cases were pending in India's district courts in October 2026, according to the National Judicial Data Grid. (eCourts Services / National Judicial Data Grid, National Judicial Data Grid: District Courts of India, October 2026)
- 1,12,27,779 civil cases, the category covering contract and commercial suits, were pending in India's district courts in October 2026. (eCourts Services / National Judicial Data Grid, National Judicial Data Grid: District Courts of India, October 2026)
- 47,03,112 district court cases in India had been pending for more than 10 years, including 8,10,629 civil cases. (eCourts Services / National Judicial Data Grid, National Judicial Data Grid: District Courts of India, October 2026)
- 41,38,325 new cases entered India's district courts in the latest month, against 34,21,828 disposed, so the backlog kept growing. (eCourts Services / National Judicial Data Grid, National Judicial Data Grid: District Courts of India, September to October 2026)
- 65,43,430 cases were pending in India's High Courts, of which 45,32,902 were civil matters. (eCourts Services / National Judicial Data Grid, HC NJDG: National Judicial Data Grid (High Courts), October 2026)
- 23% of cases pending in India's High Courts, or 14,75,233 cases, were more than 10 years old. (eCourts Services / National Judicial Data Grid, HC NJDG: National Judicial Data Grid (High Courts), October 2026)
- 2,56,892 delayed-payment applications have been filed by micro and small enterprises on India's MSME Samadhaan portal. (Ministry of Micro, Small and Medium Enterprises, Government of India, MSME Samadhaan: Delayed Payment Monitoring System dashboard, Cumulative to October 2026)
- 24,240 MSME delayed-payment applications have been mutually settled between buyers and suppliers on the Samadhaan portal. (Ministry of Micro, Small and Medium Enterprises, Government of India, MSME Samadhaan: Delayed Payment Monitoring System dashboard, Cumulative to October 2026)
- 44,795 delayed-payment cases were under consideration by MSE Facilitation Councils, out of 1,07,995 cases filed with them. (Ministry of Micro, Small and Medium Enterprises, Government of India, MSME Samadhaan: Delayed Payment Monitoring System dashboard, Cumulative to October 2026)
- 3,91,30,051 cases were disposed of at the National Lok Adalat held on 9 May 2026, including 3,37,10,979 pre-litigation matters. (National Legal Services Authority (NALSA), Disposal of National Lok Adalat held on 09.05.2026 (All Types of Cases), May 9, 2026)
- Rs. 17,299.65 crore in settlements was recorded at the 9 May 2026 National Lok Adalat across pre-litigation and pending cases. (National Legal Services Authority (NALSA), Disposal of National Lok Adalat held on 09.05.2026 (All Types of Cases), May 9, 2026)
- 1,445 days was the time to enforce a commercial contract through a first-instance court in India in the World Bank's Doing Business 2020 (2019 data). (World Bank, Doing Business 2020: India economy profile, 2019)
- 31.0% of the claim value was the cost of enforcing a commercial contract in India, per Doing Business 2020 (2019 data). (World Bank, Doing Business 2020: India economy profile, 2019)
- 35% of cases in India's State Consumer Dispute Redressal Commissions had been pending for more than three years, on average, per the India Justice Report. (India Justice Report, India Justice Report: Consumer Justice Report 2026, Consumer Justice Report 2026)
| Court level | Total pending | Civil | Criminal | Pending over 10 years |
|---|---|---|---|---|
| District courts | 5,16,23,358 | 1,12,27,779 | 4,03,95,579 | 47,03,112 |
| High Courts | 65,43,430 | 45,32,902 | 20,10,528 | 14,75,233 (23%) |
Small firms carry more of the legal cost burden than their size suggests
Businesses earning $10 million or less a year earned 20% of US commercial revenue in 2021 but bore 48% of commercial tort costs, about $160 billion. The gap is widest at the bottom. Businesses earning $1 million or less faced about $35 in tort costs for every $1,000 of revenue, against less than $5 for businesses making $50 million or more, and overall the smallest businesses faced 7 times the tort costs of the largest relative to revenue.
Legal problems are also common. In the State Bar of California's survey, 40% of small business owners had at least one legal need in 2023, and 50% of those with a need had one involving contracts and agreements, the most common type. Among surveyed owners whose most recent need went unmet, 85% said they were hurt financially, such as through lost business or revenue.
Most of the cost comes before any trial
One of the few direct measures of case costs is a Federal Judicial Center survey of federal civil cases closed in 2008. Defense attorneys reported a median cost of $20,000 including fees, plaintiff attorneys $15,000, and defendants at the 95th percentile $300,000. Rates have risen since. Law firm worked billing rates grew 7.3% in 2025, and the 2026 Fitzpatrick Matrix for complex federal litigation in Washington, DC sets $578 an hour for a new lawyer and $998 for one with 35 or more years of experience.
Few cases reach a verdict. Only 0.4% of the 407,379 federal civil cases closed in FY2025 reached trial. The rest ended before or without one. Time still adds up. The median federal civil case took 15.6 months to resolve in FY2025, cases that ended with no court action closed in a median 5.1 months, and cases resolved during trial took 30.7 months.
What to do before a dispute starts
Your contract shapes much of what a dispute will cost: where it is heard, who pays fees, and how much you can lose. If a contract sends disputes to arbitration, check the fee terms. JAMS charges a $2,500 filing fee for a two-party case. Mediation can be faster: EEOC mediation resolves a charge in less than 3 months on average, against 10 months or longer for an investigation. In California, a business can sue for up to $6,250 in small claims court, so a clause that sends every dispute to arbitration can mean a $2,500 filing fee on a claim small claims court could hear.
Employment and accessibility claims deserve particular attention. Retaliation appeared in 61.6% of EEOC charges in FY2025, and 3,117 federal website accessibility lawsuits were filed in 2025, with 69% of digital accessibility suits in the first half of 2025 aimed at eCommerce businesses. Practical steps:
- Cap your liability in customer contracts and check that the cap is mutual.
- Limit indemnities to claims caused by your own fault, and ask vendors to indemnify you for theirs.
- Agree on a mediation step before arbitration or court, and on who pays filing fees.
- Make website and software vendors responsible for accessibility and for defects in their work.
- Check if your insurance covers employment claims; Insureon reports an average EPLI premium of $257 a month for small business customers.
Check the clauses that decide what a dispute costs
Half of California small business owners with a legal need in 2023 had one involving contracts and agreements. An automated review reads a customer, vendor or service contract before you sign and flags the clauses that drive dispute costs, such as one-sided indemnities, missing liability caps and arbitration terms, and explains each one in plain English with a change to ask for.
- Limitation of liability caps and what they exclude
- Indemnification scope and whether it is mutual
- Arbitration, mediation, venue and governing law clauses
- Who pays attorney fees and filing costs if there is a dispute
- Class action and jury trial waivers
- Payment terms, late fees and the right to stop work for non-payment
- Warranty, acceptance and defect responsibility terms
- Insurance requirements placed on you or the other side
- Notice periods and termination rights
Frequently asked questions
How much does it cost to defend a lawsuit as a small business?
In a Federal Judicial Center survey of federal civil cases closed in 2008, defense attorneys reported a median cost of $20,000 including fees, and $300,000 at the 95th percentile. Hourly rates have risen since: law firm worked billing rates grew 7.3% in 2025 alone.
How often do small businesses get sued?
No public source counts lawsuits against all small firms. In California, 40% of small business owners had at least one legal need in 2023. The Hartford projected in 2015 that 4 in 10 small businesses would face a property or general liability claim within 10 years, and 35% of its general liability claims ended in a lawsuit.
How long does a business lawsuit take?
The median federal civil case took 15.6 months from filing to disposition in FY2025, up from 13.7 months in 2024. Cases that go to trial take much longer: the median time from filing to trial was 33.7 months in the 12 months ending June 30, 2026.
How much does it cost to file a lawsuit in federal court?
The statutory filing fee for a civil case in a US district court is $350 under 28 U.S.C. 1914(a), plus a $55 administrative fee set by the Judicial Conference fee schedule.
How many ADA lawsuits are filed against businesses each year?
Seyfarth Shaw counted 8,667 federal ADA Title III lawsuits in 2025, 2% fewer than in 2024. Website accessibility cases made up 3,117 of the federal filings, a 27% increase from 2,452 in 2024.
How many employment discrimination charges are filed with the EEOC?
The EEOC received 88,201 discrimination charges in FY2025, close to FY2024's 88,531. Retaliation was the most common basis, alleged in 54,350 charges or 61.6% of the total.
How much does arbitration cost?
JAMS charges a $2,500 filing fee for a two-party arbitration, rising to $4,000 with three or more parties. For international cases, the median cost of an LCIA arbitration reaching a final award between January 2017 and May 2024 was USD 117,653.
Use this data
Every chart and card below is free to reuse under CC BY 4.0. Download what you need and link back to this page.
 Stat cards
 Key findings card
 Infographic
 Median final awards to plaintiff winners in US state court trials, 2005 (USD)
 Share of PTAB patent challenge petitions instituted for trial, FY2022 to FY2026 (%)
 Growth in US commercial insurance direct premiums written by line, 2025 (%)
 Median months from filing to disposition by stage, US district court civil cases, FY2025
 EEOC charge receipts by fiscal year, FY2020 to FY2025 (charges)
 Median months from filing to trial, US district court civil cases, 2021 to 2026
 New cases filed at major international arbitration institutions, 2025
 Share of businesses reporting a legal issue or lawsuit in the past year, by survey (%)
 Federal ADA Title III lawsuits filed per year, 2013 to 2025
 Hourly rates for complex federal litigation in Washington, DC by years of experience, 2026 (USD per hour)
 How the US tort burden falls on small businesses (2021 data, Brattle for the U.S. Chamber Institute for Legal Reform)
 Pending cases in Indian courts by court level, National Judicial Data Grid, October 2026
Embed the infographic
Free to share on your site, blog or slides under CC BY 4.0. Please keep the credit link.
Sources and method
Every number on this page comes from the sources below, each opened and read on or before October 17, 2026. A second, independent review checked every figure against its source and corrected anything that did not match. Figures that could not be confirmed were left out.
- U.S. Chamber of Commerce Institute for Legal Reform, Tort Costs for Small Businesses (December 5, 2023)
- The Brattle Group, Tort Costs for Small Businesses (Brattle publication summary) (December 11, 2023)
- U.S. Chamber of Commerce Institute for Legal Reform, Tort Costs in America: An Empirical Analysis of Costs and Compensation of the U.S. Tort System, Third Edition (November 20, 2024)
- The Brattle Group, Brattle Principals Co-Author Report on Tort Costs in America (December 4, 2024)
- Casualty Actuarial Society, Triple-I/CAS Analysis Finds Motor Vehicle Tort Filings Reach 30-Year High (October 8, 2026)
- Westfleet Advisors, The Westfleet Insider: 2025 Litigation Finance Market Report (2025 edition (covers 2025 activity))
- U.S. Bureau of Justice Statistics, Contract Bench and Jury Trials in State Courts, 2005 (NCJ 225634) (September 2009 (2005 data))
- U.S. Bureau of Justice Statistics, Civil Bench and Jury Trials in State Courts, 2005 (October 2008 (2005 data))
- Administrative Office of the U.S. Courts, Federal Judicial Caseload Statistics 2025 (2025 (12 months ending March 31, 2025))
- World Commerce & Contracting, Contract Management Whitepaper (August 2025)
- World Commerce & Contracting, Contracting: The Overlooked Source of Procurement Value (January 23, 2026)
- NYC Department of Consumer and Worker Protection, Freelance Isn't Free Act Five-Year Report (November 1, 2023)
- Judicial Council of California, 2026 Court Statistics Report: Statewide Caseload Trends (2026 (FY 2024-25 data))
- Legal Services Board (UK), Small Business Legal Needs Survey (2021 survey wave)
- Unified Patents, Patent Dispute Report: Q3 2026 (October 16, 2026)
- Administrative Office of the U.S. Courts, U.S. District Courts: Judicial Business 2025 (FY2025 (year ending September 30, 2025))
- U.S. Patent and Trademark Office, Patent Trial and Appeal Board, PTAB Trial Statistics, September 2026 (September 2026 (FY2026))
- U.S. Government Accountability Office, Intellectual Property: Assessing Factors That Affect Patent Infringement Litigation Could Help Improve Patent Quality (GAO-13-465) (August 22, 2013)
- U.S. Copyright Office, Copyright Claims Board, Copyright Claims Board Key Statistics, 06/2022 to 03/2026 (Updated March 2026)
- U.S. Copyright Office, CASE Act Report: A Report of the Register of Copyrights (February 2026)
- Casualty Actuarial Society, New CAS and Triple-I Analysis Quantifies Impact of Legal System Abuse on Liability Insurance (October 31, 2025)
- Casualty Actuarial Society, New Joint CAS and Triple-I Report: Increasing Economic and Social Inflation Continue (October 29, 2024)
- Marsh, Global Insurance Market Index, Q2 2026 (Q2 2026)
- Federal Insurance Office, U.S. Department of the Treasury, Annual Report on the Insurance Industry (September 2026)
- Insureon, How Much Does Employment Practices Liability Insurance Cost? (Updated July 13, 2026)
- Insureon, How Much Does General Liability Insurance Cost? (Updated March 30, 2026)
- U.S. Chamber of Commerce Institute for Legal Reform, Nuclear Verdicts: An Update on Trends, Causes, and Solutions (May 30, 2024)
- Nationwide, Accident anxiety: 7 in 10 company drivers fear injury, death or lawsuits (April 3, 2025)
- U.S. Government Publishing Office (GovInfo), 28 U.S.C. 1914 - District court; filing and miscellaneous fees (United States Code, 2023 edition) (United States Code, 2023 edition, accessed October 2026)
- Administrative Office of the U.S. Courts, District Court Miscellaneous Fee Schedule (Effective December 1, 2023, accessed October 2026)
- Judicial Branch of California (California Courts Self-Help Guide), Small claims in California (Accessed October 2026)
- JAMS, Arbitration Fees (Current schedule, accessed October 2026)
- Federal Judicial Center, Litigation Costs in Civil Cases: Multivariate Analysis (March 2010)
- Administrative Office of the U.S. Courts, Table C-5: Median Time Intervals From Filing to Disposition of Civil Cases Terminated, by District and Method of Disposition (12-month period ending September 30, 2025)
- U.S. Equal Employment Opportunity Commission, Mediation (Accessed October 2026)
- U.S. Equal Employment Opportunity Commission, Table E1c. Charge Receipts and Resolutions by Type (All Statutes), FY 1997 - FY 2025 (March 2026)
- U.S. Equal Employment Opportunity Commission, Table E1a. Charge Receipts by Basis or Statute (All Statutes) FY 1997 - FY 2025 (April 2026)
- U.S. Equal Employment Opportunity Commission, Table L1. Litigation Statistics FY 1997 - FY 2025 (March 2026)
- U.S. Department of Labor, Wage and Hour Division, WHD Enforcement Statistics: All Acts (FY2025 data, accessed October 2026)
- U.S. Department of Labor, Wage and Hour Division, Wage and Hour Division Data (FY2025 data, accessed October 2026)
- California Civil Rights Department, California Civil Rights Department 2024 Annual Report (November 2025)
- Administrative Office of the U.S. Courts, Table C-4: Civil Cases Terminated, by Nature of Suit and Action Taken (12-month period ending September 30, 2025)
- Administrative Office of the U.S. Courts, U.S. District Court - Judicial Caseload Profile (Federal Court Management Statistics, June 2026) (12-month period ending June 30, 2026)
- National Center for State Courts, Court caseload data (Accessed October 2026 (2024 data))
- UK Ministry of Justice, Civil Justice Statistics Quarterly: April to June 2026 (3 September 2026)
- American Arbitration Association, American Arbitration Association - homepage figures (Accessed October 2026 (2025 data))
- JAMS, About JAMS (Accessed October 2026 (2025 data))
- International Chamber of Commerce, ICC Dispute Resolution 2025 Statistics Report (August 2026)
- London Court of International Arbitration, LCIA Annual Casework Report 2025 (October 2026)
- Hong Kong International Arbitration Centre, HKIAC Statistics (2025 statistics, accessed October 2026)
- FINRA Dispute Resolution Services, Dispute Resolution Statistics (Through August 2026)
- German Arbitration Institute (DIS), Our work in numbers (2025 statistics, accessed October 2026)
- Federal Judicial Center, Federal Judicial Center National, Case-Based Civil Rules Survey: Preliminary Report to the Judicial Conference Advisory Committee on Civil Rules (October 2009)
- State Bar of California, 2024 California Justice Gap Study: Legal Needs of Small Business Owners (2024 (survey of 2023 calendar year))
- Norton Rose Fulbright, 2026 Annual Litigation Trends Survey: Perspectives from Corporate Counsel (January 2026)
- The Hartford, The Hartford Reports More Than 40 Percent Of Small Businesses Will Experience A Claim In The Next 10 Years (March 30, 2015)
- California Labor and Workforce Development Agency, Initial Statement of Reasons, Proposed PAGA Regulations (Z2026-0121-03) (February 6, 2026)
- Seyfarth Shaw LLP (ADA Title III News & Insights), ADA Title III Federal Lawsuit Filings Fall Slightly to 8,667 in 2025 (February 2026)
- Seyfarth Shaw LLP (ADA Title III News & Insights), Federal Court Website Accessibility Lawsuit Filings Bounce Back in 2025 (March 25, 2026)
- Seyfarth Shaw LLP (ADA Title III News & Insights), 2026 Mid-Year Report: ADA Title III Federal Lawsuit Numbers Are Climbing (September 9, 2026)
- UsableNet, ADA Website Compliance Lawsuit Tracker (Updated through September 2026)
- UsableNet, 2026 Midyear Report on Digital Accessibility Lawsuits in the US (2026)
- UsableNet via Newswire.com, Digital Accessibility Lawsuits Surge in 2025 (press release) (August 4, 2025)
- California Commission on Disability Access (Department of General Services), 2025 CCDA Annual Report (2026 (covers calendar 2025))
- U.S. Attorney's Office for the District of Columbia, Civil Division, The Fitzpatrick Matrix, 2013-2026 (2026 edition)
- Thomson Reuters Institute, 2026 State of the US Legal Market (January 7, 2026)
- LexisNexis CounselLink, LexisNexis CounselLink Releases 2026 Trends Report (April 22, 2026)
- U.S. Bureau of Labor Statistics, Occupational Outlook Handbook: Lawyers (2025 pay data)
- U.S. Census Bureau, Quarterly Selected Services Estimates, Second Quarter 2026 (CB26-146) (September 9, 2026)
- eCourts Services / National Judicial Data Grid, National Judicial Data Grid: District Courts of India (Last updated October 14, 2026)
- eCourts Services / National Judicial Data Grid, HC NJDG: National Judicial Data Grid (High Courts) (Live dashboard, read October 2026)
- Ministry of Micro, Small and Medium Enterprises, Government of India, MSME Samadhaan: Delayed Payment Monitoring System dashboard (Cumulative, read October 2026)
- National Legal Services Authority (NALSA), Disposal of National Lok Adalat held on 09.05.2026 (All Types of Cases) (July 2026)
- World Bank, Doing Business 2020: India economy profile (2019 (Doing Business 2020))
- World Intellectual Property Organization, WIPO Arbitration and Mediation Center Caseload Summary (Accessed October 2026)
- U.S. Bureau of Labor Statistics, Occupational Outlook Handbook: Arbitrators, Mediators, and Conciliators (May 2025 pay data)
- U.S. Bureau of Labor Statistics, Occupational Outlook Handbook: Paralegals and Legal Assistants (May 2025 pay data)
- U.S. Department of Labor, Wage and Hour Division, WHD Enforcement Statistics: Fair Labor Standards Act (FY2025 data, accessed October 2026)
- SCC Arbitration Institute, SCC Statistics 2025 (2026 (2025 data))
- India Justice Report, India Justice Report: Consumer Justice Report 2026 (2026)
Cite this page
ClauseAudit, “Legal Costs and Litigation Statistics for Small Businesses 2026: 160 Numbers on Lawsuits, Fees and Disputes”, updated October 17, 2026, https://clauseaudit.com/data/small-business-litigation-statistics. Free to reuse with a link back (CC BY 4.0).
This page summarises published data and law as checked on October 17, 2026. Figures are updated as new editions are released, and your own situation may differ. It is general information, not legal, tax or financial advice.