Small Business Failure Rate: Survival Rates by Year and Industry
By ClauseAudit Research · 3 sources ·
What is the small business failure rate?
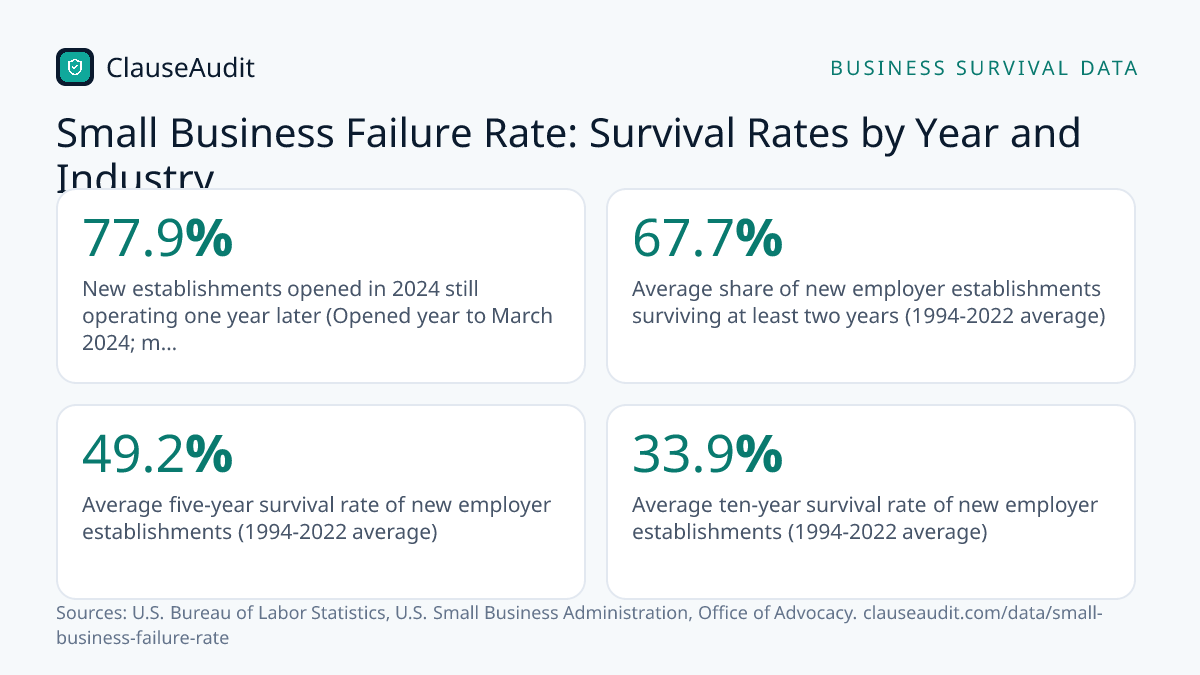
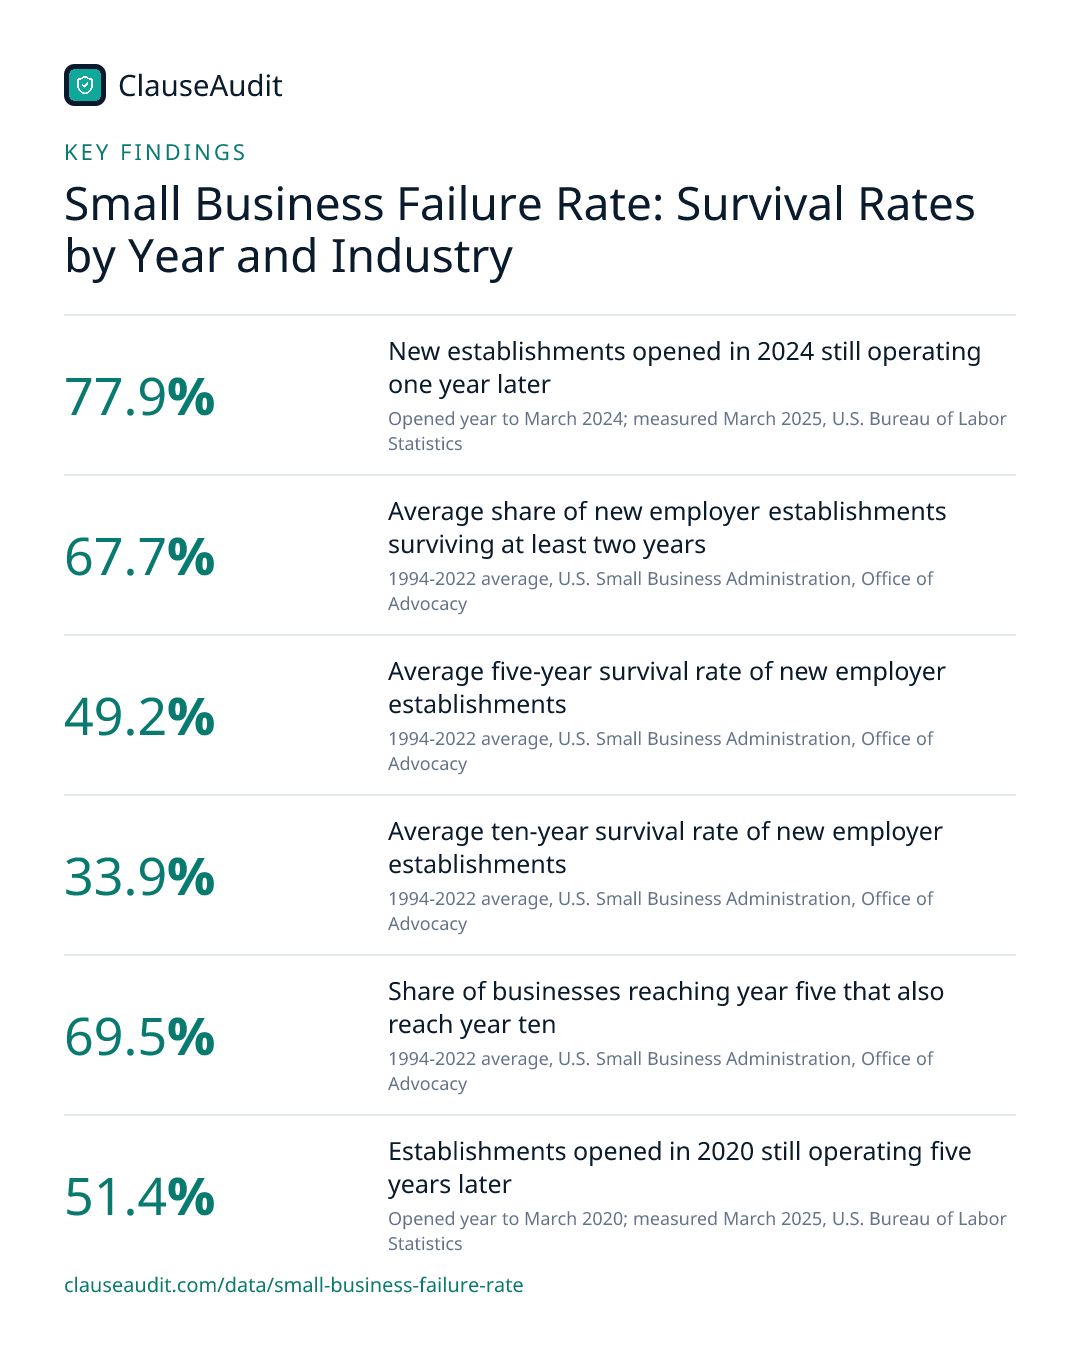
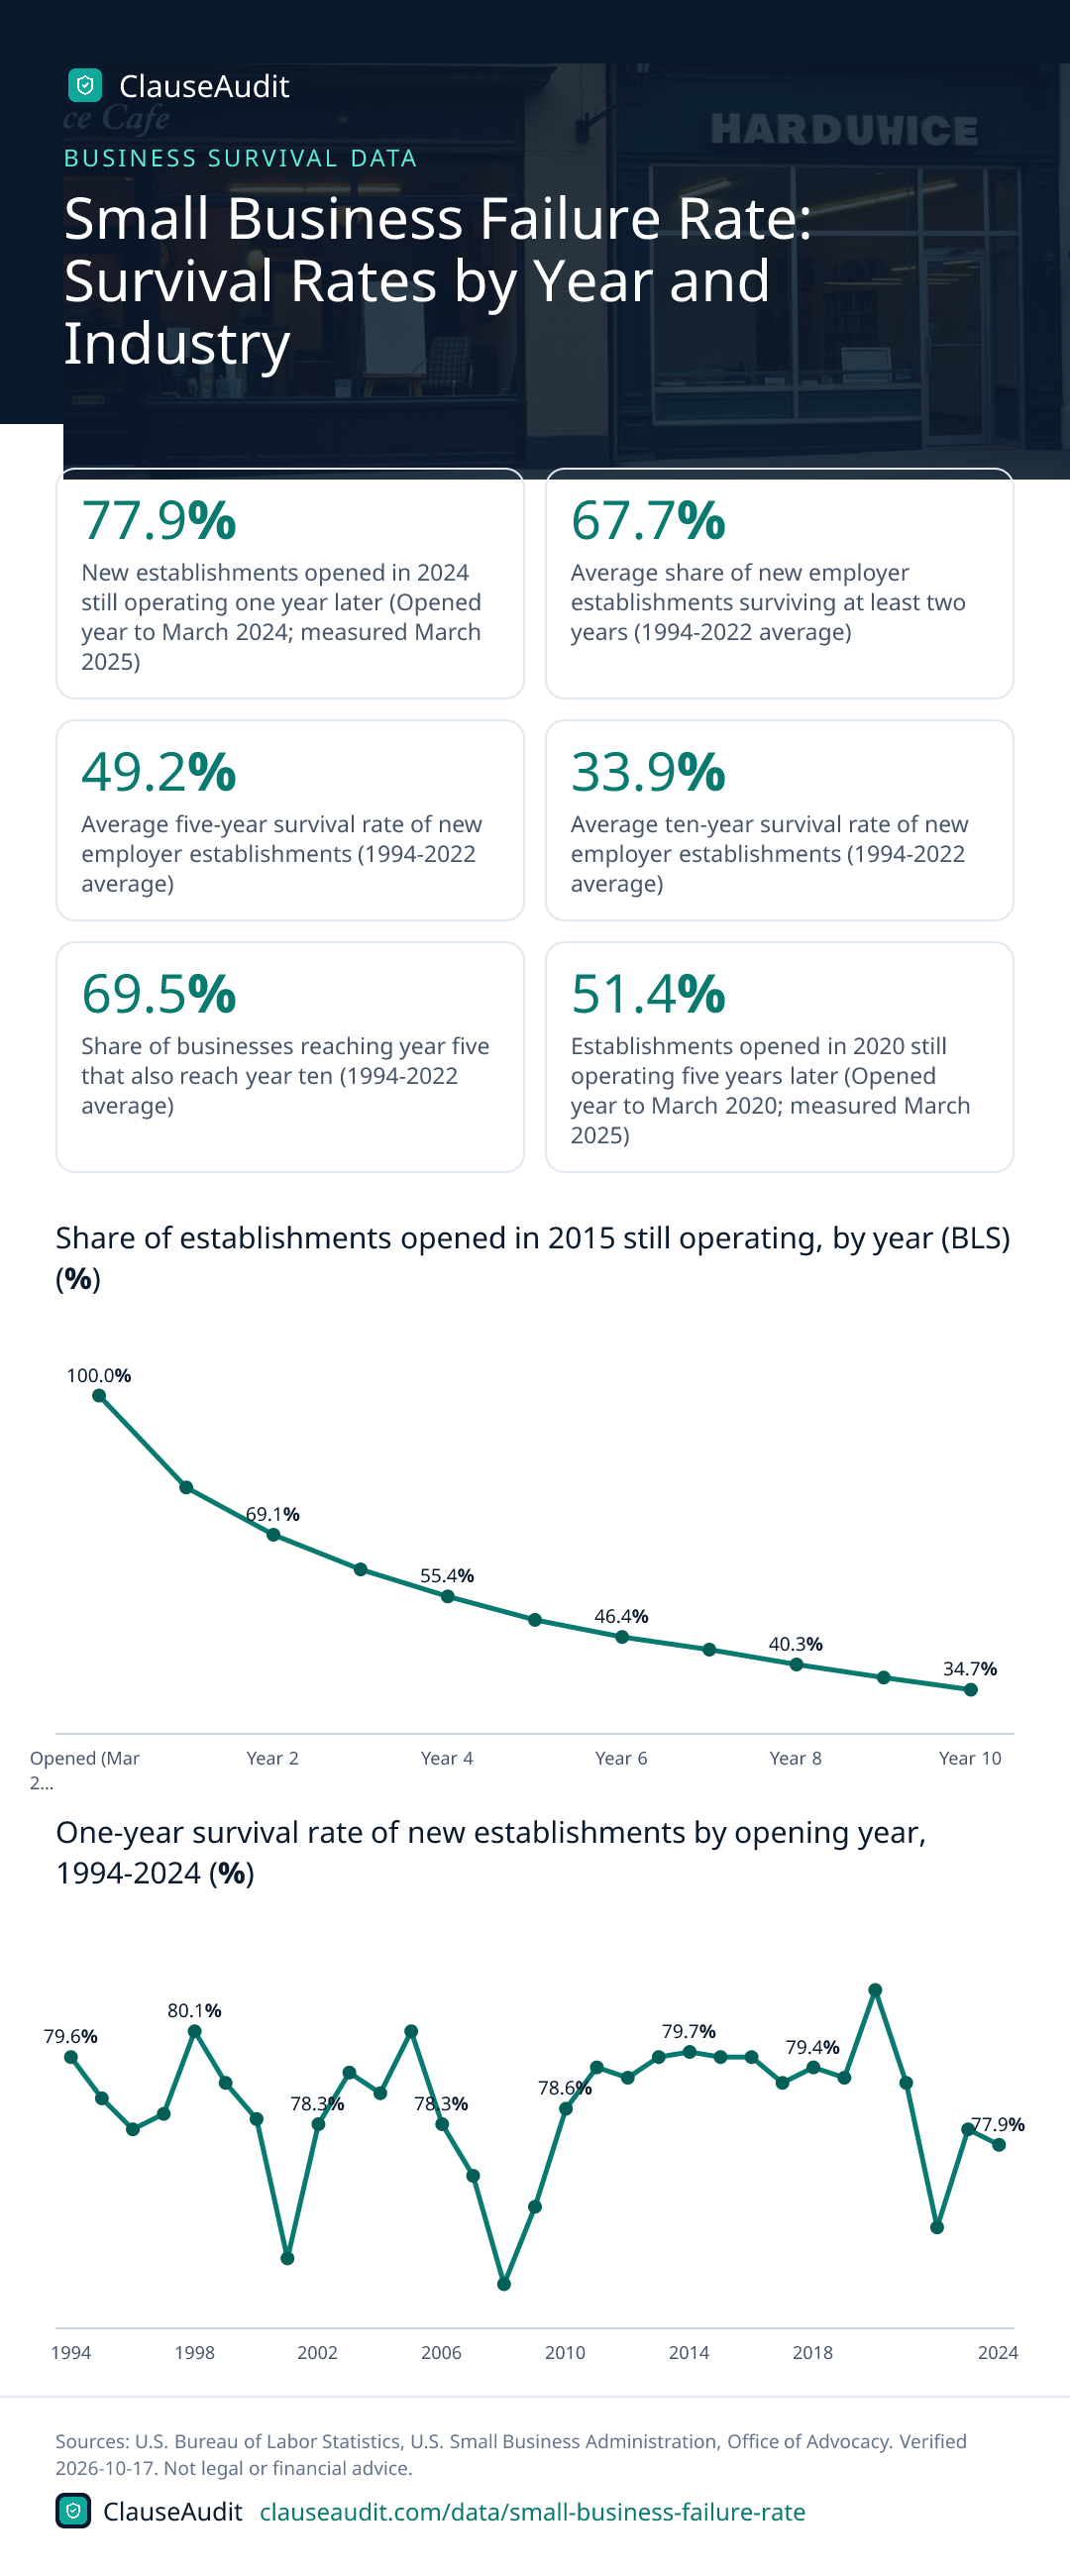
Most new businesses do not fail in year one. Of US establishments opened in 2024, 77.9% were still running a year later, so 22.1% closed. Failure builds slowly after that: on 1994-2022 averages, 49.2% survive five years and 33.9% survive ten, according to BLS data published by the SBA.

- New establishments opened in 2024 still operating one year later (Opened year to March 2024; measured March 2025, U.S. Bureau of Labor Statistics)
- 77.9%
- Average share of new employer establishments surviving at least two years (1994-2022 average, U.S. Small Business Administration, Office of Advocacy)
- 67.7%
- Average five-year survival rate of new employer establishments (1994-2022 average, U.S. Small Business Administration, Office of Advocacy)
- 49.2%
- Average ten-year survival rate of new employer establishments (1994-2022 average, U.S. Small Business Administration, Office of Advocacy)
- 33.9%
- Share of businesses reaching year five that also reach year ten (1994-2022 average, U.S. Small Business Administration, Office of Advocacy)
- 69.5%
- Establishments opened in 2020 still operating five years later (Opened year to March 2020; measured March 2025, U.S. Bureau of Labor Statistics)
- 51.4%
- Establishments opened in 2015 still operating ten years later (Opened year to March 2015; measured March 2025, U.S. Bureau of Labor Statistics)
- 34.7%
- Business establishments that closed permanently in 2023 (2023, U.S. Small Business Administration, Office of Advocacy)
- 1.2 million
The line you hear at every networking event is that most small businesses fail in their first year. The federal numbers say otherwise. Of the new establishments that opened in 2024, 77.9% were still open a year later. The real pattern is a slow leak, not a cliff, and it takes about five years to claim half of all new businesses.
Everything here comes from the Bureau of Labor Statistics Business Employment Dynamics program, which follows new private-sector employer locations year by year from the year they open. Below you will find what the survival curve means in practice, which industries hold up best, and which contract terms decide how much a closure costs you personally.
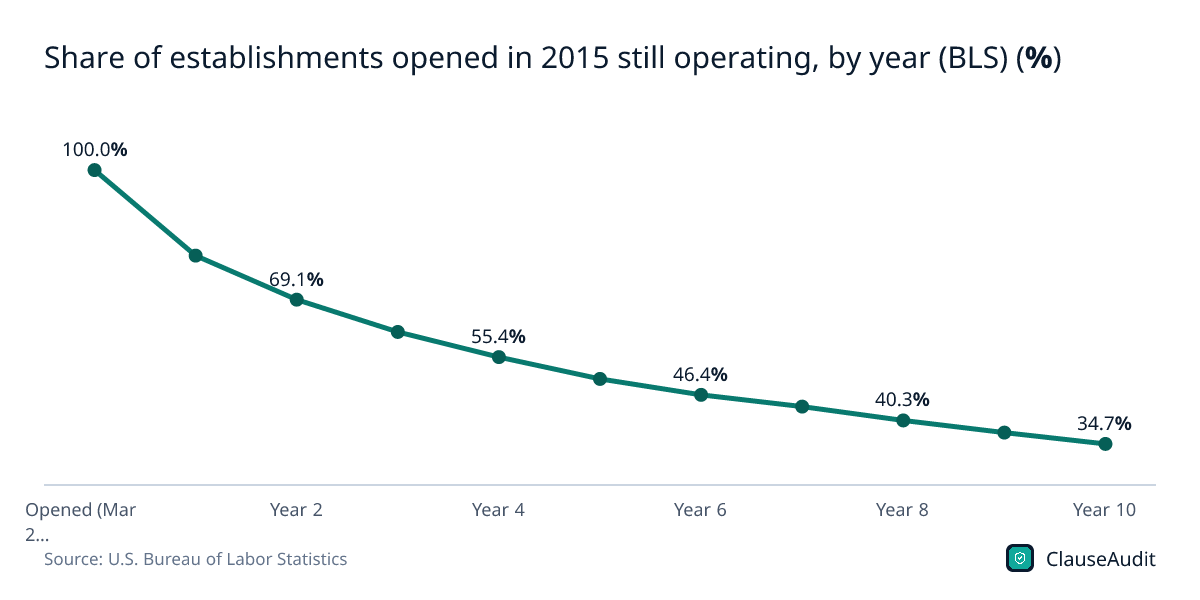
Share of establishments opened in 2015 still operating, by year (BLS) (%)
Chart data
| Label | Value (%) |
|---|---|
| Opened (Mar 2015) | 100.0% |
| Year 1 | 79.6% |
| Year 2 | 69.1% |
| Year 3 | 61.4% |
| Year 4 | 55.4% |
| Year 5 | 50.2% |
| Year 6 | 46.4% |
| Year 7 | 43.6% |
| Year 8 | 40.3% |
| Year 9 | 37.4% |
| Year 10 | 34.7% |
Year one is the steepest drop on the curve, from opening to 79.6% still operating. After year five the line flattens out, sliding from 50.2% to 34.7% over the next five years.
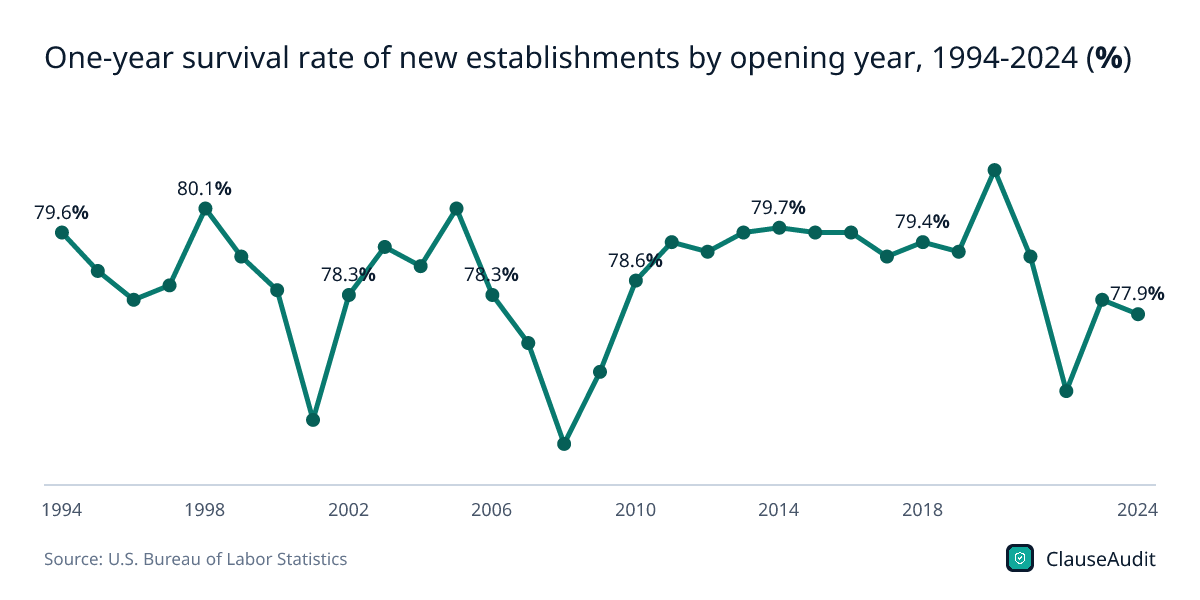
Download this chart (PNG)One-year survival rate of new establishments by opening year, 1994-2024 (%)
Chart data
| Label | Value (%) |
|---|---|
| 1994 | 79.6% |
| 1995 | 78.8% |
| 1996 | 78.2% |
| 1997 | 78.5% |
| 1998 | 80.1% |
| 1999 | 79.1% |
| 2000 | 78.4% |
| 2001 | 75.7% |
| 2002 | 78.3% |
| 2003 | 79.3% |
| 2004 | 78.9% |
| 2005 | 80.1% |
| 2006 | 78.3% |
| 2007 | 77.3% |
| 2008 | 75.2% |
| 2009 | 76.7% |
| 2010 | 78.6% |
| 2011 | 79.4% |
| 2012 | 79.2% |
| 2013 | 79.6% |
| 2014 | 79.7% |
| 2015 | 79.6% |
| 2016 | 79.6% |
| 2017 | 79.1% |
| 2018 | 79.4% |
| 2019 | 79.2% |
| 2020 | 80.9% |
| 2021 | 79.1% |
| 2022 | 76.3% |
| 2023 | 78.2% |
| 2024 | 77.9% |
First-year survival has barely moved in three decades, staying between 75.2% and 80.9%. The two lowest points, 75.7% for the 2001 cohort and 75.2% for 2008, line up with recessions.
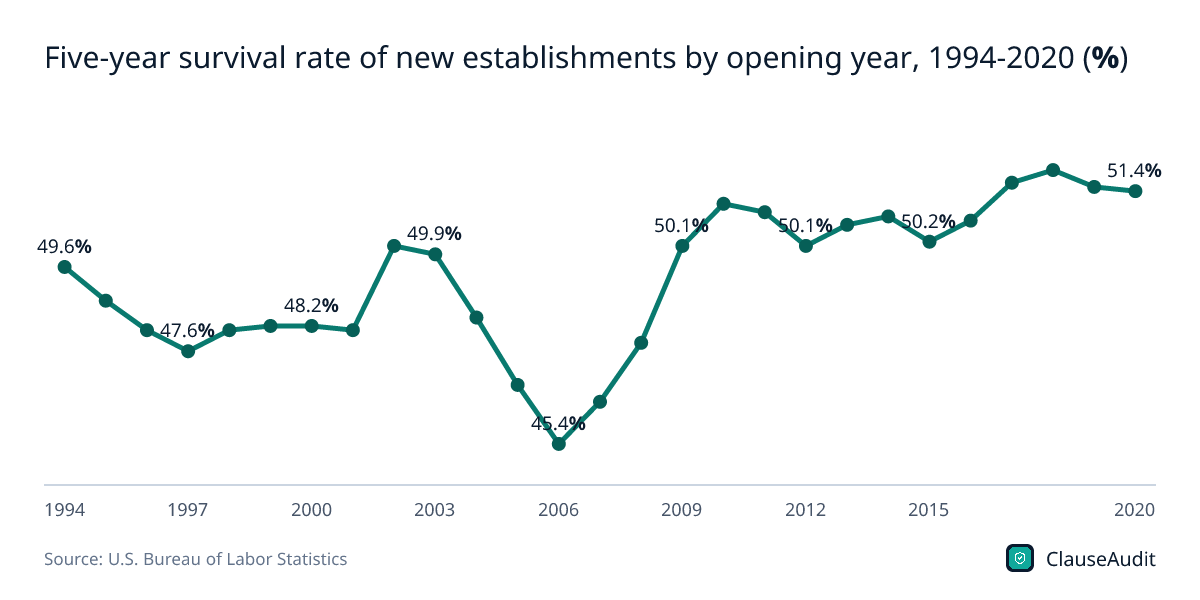
Download this chart (PNG)Five-year survival rate of new establishments by opening year, 1994-2020 (%)
Chart data
| Label | Value (%) |
|---|---|
| 1994 | 49.6% |
| 1995 | 48.8% |
| 1996 | 48.1% |
| 1997 | 47.6% |
| 1998 | 48.1% |
| 1999 | 48.2% |
| 2000 | 48.2% |
| 2001 | 48.1% |
| 2002 | 50.1% |
| 2003 | 49.9% |
| 2004 | 48.4% |
| 2005 | 46.8% |
| 2006 | 45.4% |
| 2007 | 46.4% |
| 2008 | 47.8% |
| 2009 | 50.1% |
| 2010 | 51.1% |
| 2011 | 50.9% |
| 2012 | 50.1% |
| 2013 | 50.6% |
| 2014 | 50.8% |
| 2015 | 50.2% |
| 2016 | 50.7% |
| 2017 | 51.6% |
| 2018 | 51.9% |
| 2019 | 51.5% |
| 2020 | 51.4% |
Newer cohorts have done a bit better than older ones. The 2020 cohort reached 51.4% at five years, compared with a low of 45.4% for businesses that opened in 2006.
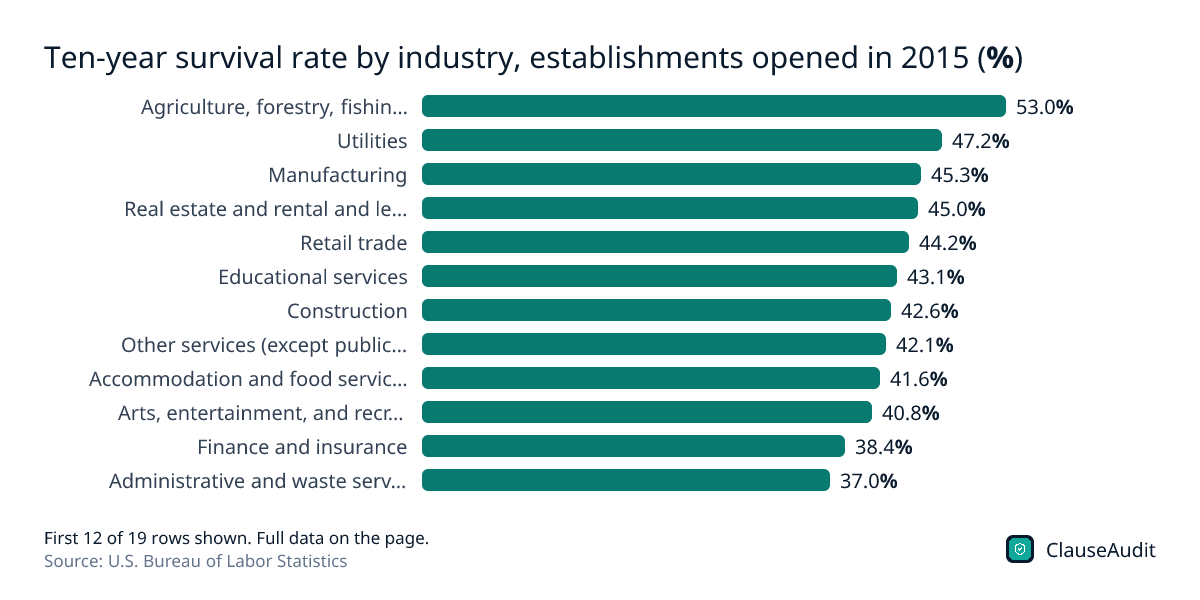
Download this chart (PNG)Ten-year survival rate by industry, establishments opened in 2015 (%)
Chart data
| Label | Value |
|---|---|
| Agriculture, forestry, fishing and hunting | 53.0% |
| Utilities | 47.2% |
| Manufacturing | 45.3% |
| Real estate and rental and leasing | 45.0% |
| Retail trade | 44.2% |
| Educational services | 43.1% |
| Construction | 42.6% |
| Other services (except public administration) | 42.1% |
| Accommodation and food services | 41.6% |
| Arts, entertainment, and recreation | 40.8% |
| Finance and insurance | 38.4% |
| Administrative and waste services | 37.0% |
| Health care and social assistance | 36.4% |
| Transportation and warehousing | 36.1% |
| Management of companies and enterprises | 35.8% |
| Wholesale trade | 34.4% |
| Professional, scientific, and technical services | 34.3% |
| Information | 30.0% |
| Mining, quarrying, and oil and gas extraction | 24.5% |
Agriculture leads at 53.0% and mining trails at 24.5%. Compare sectors with each other rather than with the all-industry 34.7%, because the sector tables do not add up to the total.
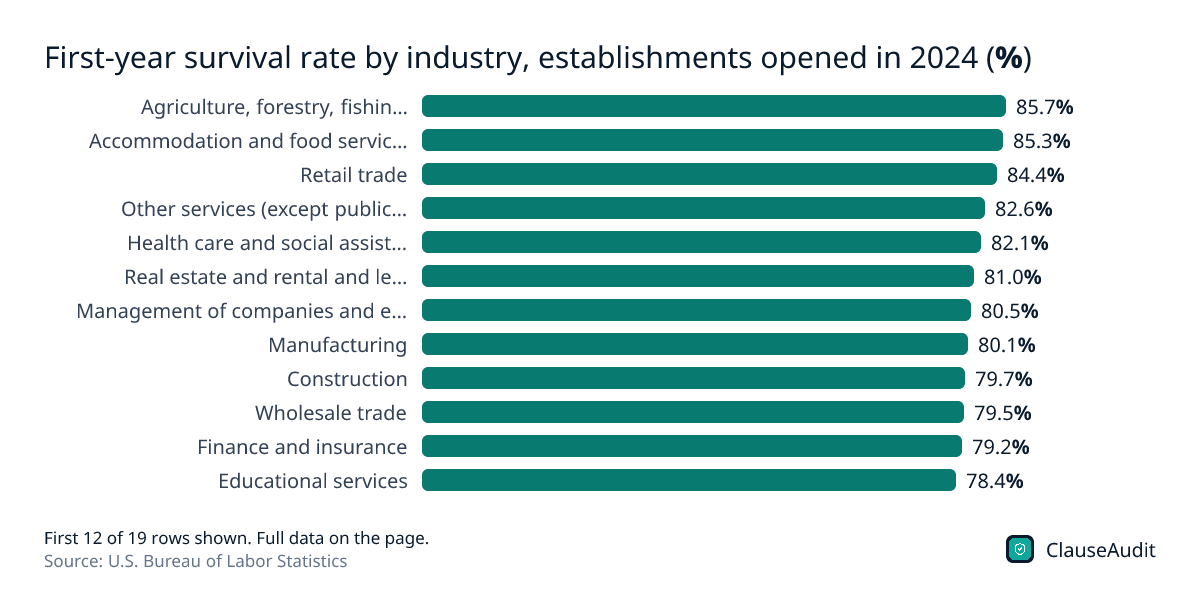
Download this chart (PNG)First-year survival rate by industry, establishments opened in 2024 (%)
Chart data
| Label | Value |
|---|---|
| Agriculture, forestry, fishing and hunting | 85.7% |
| Accommodation and food services | 85.3% |
| Retail trade | 84.4% |
| Other services (except public administration) | 82.6% |
| Health care and social assistance | 82.1% |
| Real estate and rental and leasing | 81.0% |
| Management of companies and enterprises | 80.5% |
| Manufacturing | 80.1% |
| Construction | 79.7% |
| Wholesale trade | 79.5% |
| Finance and insurance | 79.2% |
| Educational services | 78.4% |
| Arts, entertainment, and recreation | 78.4% |
| Mining, quarrying, and oil and gas extraction | 77.7% |
| Transportation and warehousing | 77.0% |
| Utilities | 76.9% |
| Administrative and waste services | 75.7% |
| Professional, scientific, and technical services | 74.5% |
| Information | 71.6% |
Accommodation and food services, which covers restaurants and bars, kept 85.3% of its 2024 openings for a full year. Information had the weakest first year at 71.6%.
Download this chart (PNG)New private-sector establishments opened per year, 1994-2025 (BLS)
Chart data
| Label | Value |
|---|---|
| 1994 | 569,387 |
| 1995 | 604,381 |
| 1996 | 609,571 |
| 1997 | 639,071 |
| 1998 | 642,965 |
| 1999 | 650,661 |
| 2000 | 674,530 |
| 2001 | 671,299 |
| 2002 | 659,111 |
| 2003 | 662,416 |
| 2004 | 653,766 |
| 2005 | 679,797 |
| 2006 | 715,597 |
| 2007 | 703,704 |
| 2008 | 677,939 |
| 2009 | 608,547 |
| 2010 | 560,391 |
| 2011 | 582,349 |
| 2012 | 631,634 |
| 2013 | 628,840 |
| 2014 | 652,518 |
| 2015 | 677,876 |
| 2016 | 732,856 |
| 2017 | 733,286 |
| 2018 | 733,721 |
| 2019 | 770,523 |
| 2020 | 767,573 |
| 2021 | 839,297 |
| 2022 | 1,065,228 |
| 2023 | 1,049,106 |
| 2024 | 988,310 |
| 2025 | 980,333 |
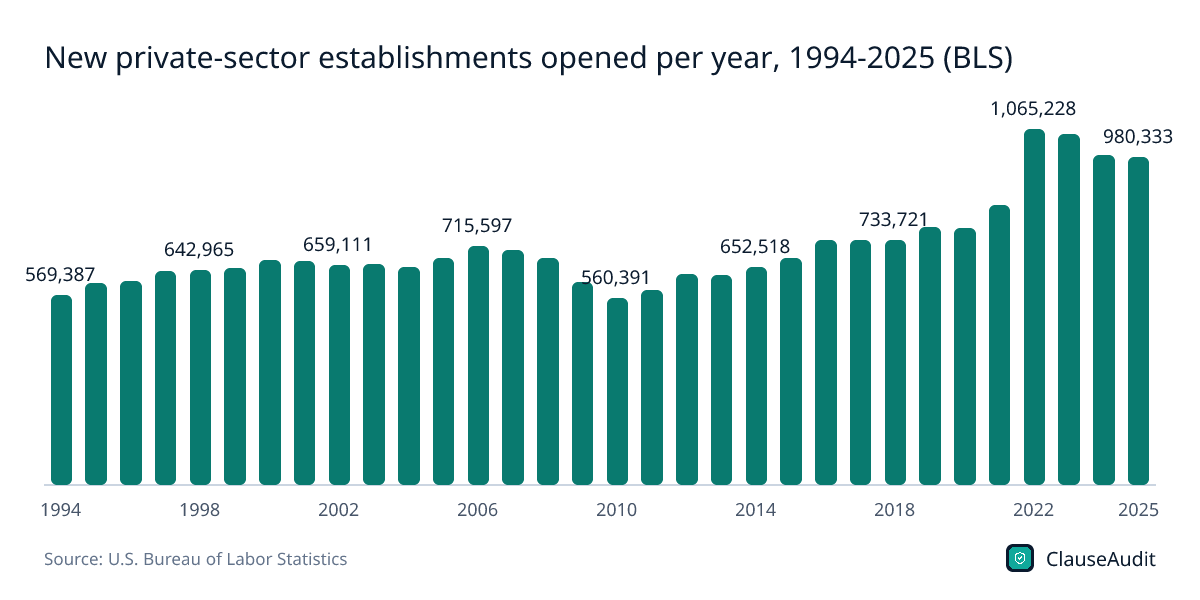
Openings jumped from 767,573 in 2020 to 1,065,228 in 2022 and have stayed close to that level since. More openings means more closures in raw numbers, even when survival rates hold steady.
Download this chart (PNG)Establishment survival rates by industry (BLS Business Employment Dynamics, data through March 2025)
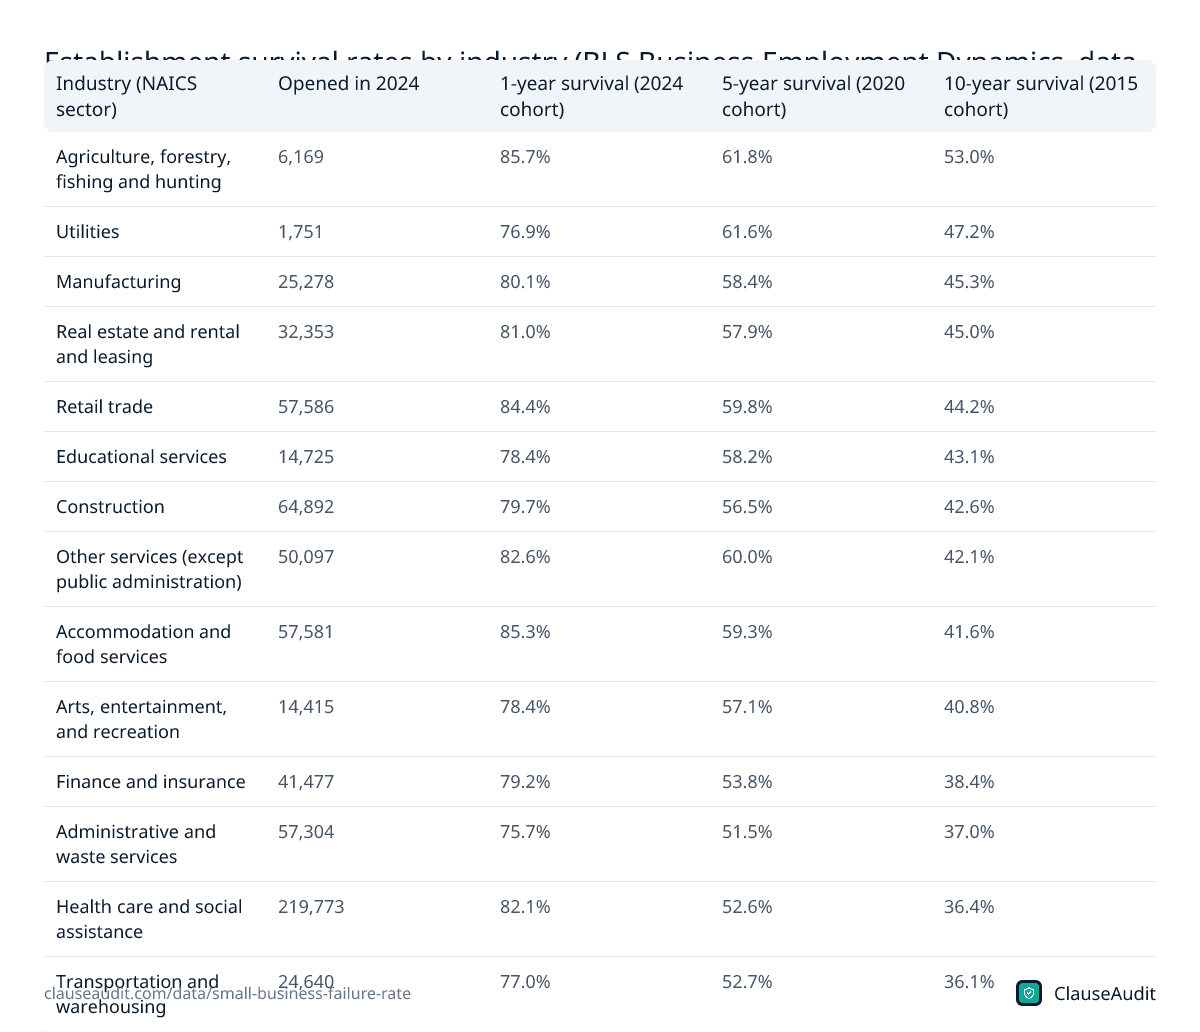
| Industry (NAICS sector) | Opened in 2024 | 1-year survival (2024 cohort) | 5-year survival (2020 cohort) | 10-year survival (2015 cohort) |
|---|---|---|---|---|
| Agriculture, forestry, fishing and hunting | 6,169 | 85.7% | 61.8% | 53.0% |
| Utilities | 1,751 | 76.9% | 61.6% | 47.2% |
| Manufacturing | 25,278 | 80.1% | 58.4% | 45.3% |
| Real estate and rental and leasing | 32,353 | 81.0% | 57.9% | 45.0% |
| Retail trade | 57,586 | 84.4% | 59.8% | 44.2% |
| Educational services | 14,725 | 78.4% | 58.2% | 43.1% |
| Construction | 64,892 | 79.7% | 56.5% | 42.6% |
| Other services (except public administration) | 50,097 | 82.6% | 60.0% | 42.1% |
| Accommodation and food services | 57,581 | 85.3% | 59.3% | 41.6% |
| Arts, entertainment, and recreation | 14,415 | 78.4% | 57.1% | 40.8% |
| Finance and insurance | 41,477 | 79.2% | 53.8% | 38.4% |
| Administrative and waste services | 57,304 | 75.7% | 51.5% | 37.0% |
| Health care and social assistance | 219,773 | 82.1% | 52.6% | 36.4% |
| Transportation and warehousing | 24,640 | 77.0% | 52.7% | 36.1% |
| Management of companies and enterprises | 10,397 | 80.5% | 52.1% | 35.8% |
| Wholesale trade | 40,970 | 79.5% | 51.2% | 34.4% |
| Professional, scientific, and technical services | 175,321 | 74.5% | 50.8% | 34.3% |
| Information | 32,515 | 71.6% | 45.7% | 30.0% |
| Mining, quarrying, and oil and gas extraction | 1,962 | 77.7% | 48.5% | 24.5% |
| Total private (all industries) | 988,310 | 77.9% | 51.4% | 34.7% |
Source: U.S. Bureau of Labor Statistics, Business Employment Dynamics: Table 7. Survival of private sector establishments by opening year, by NAICS sector (19 tables, e.g. Retail Trade); U.S. Bureau of Labor Statistics, Business Employment Dynamics: Table 7. Survival of private sector establishments by opening year, Total Private. Download as image
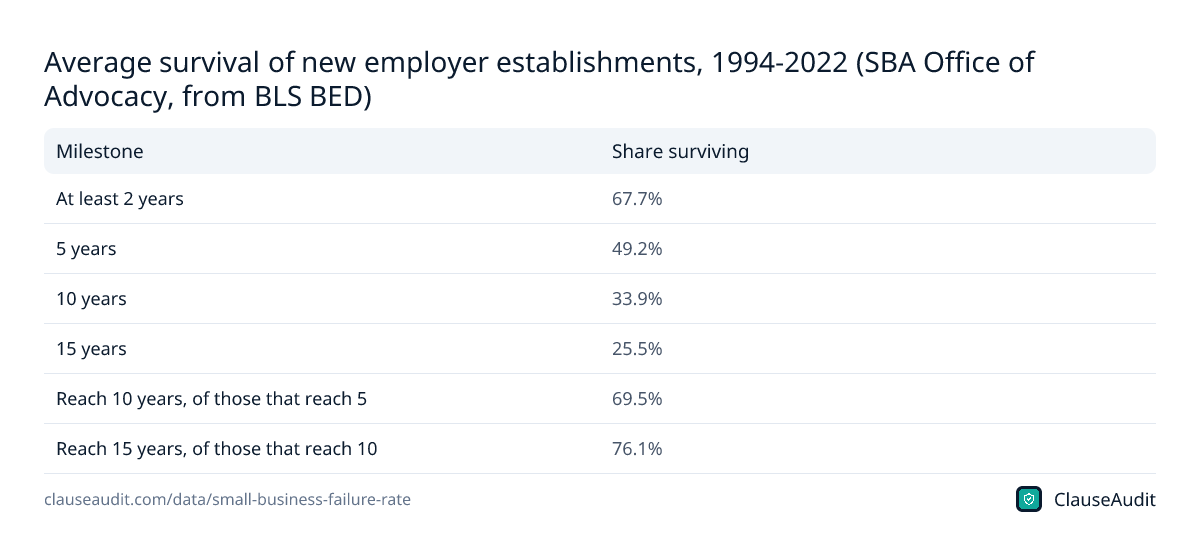
Average survival of new employer establishments, 1994-2022 (SBA Office of Advocacy, from BLS BED)
| Milestone | Share surviving |
|---|---|
| At least 2 years | 67.7% |
| 5 years | 49.2% |
| 10 years | 33.9% |
| 15 years | 25.5% |
| Reach 10 years, of those that reach 5 | 69.5% |
| Reach 15 years, of those that reach 10 | 76.1% |
Source: U.S. Small Business Administration, Office of Advocacy, Frequently Asked Questions About Small Business (Question 9: new business survival rate; Question 10: openings and closings). Download as image
What percentage of small businesses fail in the first year?
For businesses opened in 2024, 22.1% had closed by March 2025. That is roughly one in five, far below the doom figures that get repeated online. And it is not a fluke year. Since 1994, first-year survival has stayed in a tight band, from 75.2% for the 2008 cohort to 80.9% for the 2020 cohort.
Year one is still the single most dangerous year. In the 2015 cohort, survival fell to 79.6% after the first year, a bigger drop than in any later year. But most owners who get through it are not out of the woods yet. The losses keep coming, just more slowly.
One caveat before you lean on these figures. BLS counts establishments, meaning physical locations with at least one employee. A solo freelancer without payroll is not in this data. A chain that shuts one of its stores counts as one closure. So read these numbers as a picture of employer businesses, not of every side gig or one-person shop.
How many businesses fail within five and ten years?
From 1994 to 2022, an average of 67.7% of new employer establishments lasted at least two years. Just 49.2% made it to five, and 33.9% reached ten. Said plainly, about half are gone by year five and about two thirds are gone by year ten.
The more encouraging number is what happens once a business has some history. Of those that reach year five, 69.5% go on to reach year ten. Of those that reach ten, 76.1% make it to fifteen. Age does not make a business safe, but it makes it a lot safer.
Recent cohorts are running slightly ahead of the long-run averages. Businesses opened in 2020 posted 51.4% five-year survival, and the 2015 group reached 34.7% at ten years. Neither is a dramatic change, but neither supports the idea that starting a business has become a worse bet.
Which industries have the highest failure rate?
Over ten years, the weakest sectors in the 2015 cohort were mining and oil and gas at 24.5%, information at 30.0%, and professional, scientific and technical services at 34.3%. The strongest were agriculture at 53.0%, utilities at 47.2% and manufacturing at 45.3%.
Restaurants are the industry everyone assumes is a graveyard. The data is kinder. Accommodation and food services kept 85.3% of its 2024 openings through the first year, near the top of the list, and 41.6% of its 2015 openings were still running a decade later. Plenty of restaurants close. They just do not close faster than most other kinds of business.
Professional services is the opposite story. It had 175,321 new establishments in 2024 and one of the weakest first years at 74.5%. A consulting firm or design agency is cheap to start, which also makes it easy to shut down when the anchor client walks.
Why do small businesses fail?
The BLS survey records when a location closes, not why. So any list of causes is informed guesswork. A business that closes early may never have found enough paying customers, or ran out of cash before it did. One that closes later may have lost a big client, faced a lease renewal with a steep rent increase, or had an owner who decided to do something else.
Not every closure is a failure. Some owners sell. Some retire. Some fold a second location into the first. A closed establishment in this data could be a profitable shop whose owner took a good job offer.
What the data does show clearly is that recessions hurt new businesses. First-year survival dropped to 75.7% for the 2001 cohort and 75.2% for the 2008 cohort, the two lowest readings in the series. If you are opening during a slowdown, build in a longer runway than your spreadsheet says you need.
What the numbers mean for owners, freelancers and workers
- Opening a business: plan for five years of real risk, not one. The commitments you sign in month one, like a multi-year lease or a loan with a personal guarantee, will run through the riskiest stretch of your company's life.
- Freelancing or running an agency: your clients sit on this curve too. A client in its first couple of years is more likely to close, so ask for a deposit, shorter payment terms and a written late fee before you start work.
- Taking a job at a young company: ask how long it has been operating and how it is funded. Stock options with a long vesting schedule are worth less at a company with roughly even odds of reaching year five.
- Signing with a landlord, lender or equipment vendor: expect to be asked for a personal guarantee. That request exists because young businesses close often. It is also where most of your negotiating room sits.
How can you limit the damage if your business closes?
You cannot control the economy. You can control what a closure costs you, and most of that cost is locked in by contracts you sign before you open the doors. A business that closes cleanly hands back the keys, returns the leased equipment and pays off a short list of debts. One that signed the wrong terms leaves the owner paying for years.
Start with personal guarantees. Landlords, lenders and equipment lessors routinely ask owners to back the business with personal assets. Ask for a dollar cap, a burn-off after a stretch of on-time payments, or a good guy clause on a lease that ends your exposure once you give proper notice, pay rent through your move-out date and hand back the space.
Then read the exit terms. Can you assign or sublet the lease? Do your software and service contracts auto-renew for a full year? Does any financing include a confession of judgment or an acceleration clause? Those few lines decide whether closing is a setback or a personal financial crisis.
How ClauseAudit helps
Survival rates tell you the odds. Your contracts decide what happens if the odds go against you. Upload a lease, loan, vendor or service agreement and ClauseAudit runs an automated review that flags the terms that would follow you after a closure, explained in plain English.
You get a short list of clauses to push back on before you sign, while the other side still has a reason to agree.
- Personal guarantees on leases and loans, including caps, burn-off dates and good guy terms
- Lease length, renewal options, and your right to assign, sublet or end the lease early
- Auto-renewal terms and cancellation notice windows on software and service contracts
- Default, acceleration and confession of judgment clauses in financing agreements
- Payment terms, deposits and late fees when your client is a young business
- Liability caps and indemnities that could exceed what the business is worth
Frequently asked questions
Do most small businesses fail?
Not early on. Most new employer businesses are still open after two years. Over the long run the picture is harder: from 1994 to 2022, only 33.9% of new establishments were still operating after ten years. Keep in mind that a closure is not always a failure, since some owners sell, merge locations or retire.
What percentage of businesses fail in the first year?
For businesses opened in 2024, 22.1% had closed within a year, according to the Bureau of Labor Statistics. The other 77.9% were still operating in March 2025. That rate has held fairly steady since 1994, ranging from 75.2% survival for the 2008 cohort to 80.9% for the 2020 cohort.
What percentage of businesses survive five years?
On average, 49.2% of new employer establishments survived five years between 1994 and 2022, according to the SBA Office of Advocacy's summary of BLS data. More recent groups did a little better. Businesses opened in 2020 had 51.4% five-year survival as of March 2025.
What is the failure rate for restaurants?
Lower than most people expect. Accommodation and food services, the BLS sector that covers restaurants and bars, kept 85.3% of its 2024 openings through the first year, one of the best rates of any industry. Over ten years, 41.6% of its 2015 openings were still running, close to the middle of the pack.
Which industry has the lowest business survival rate?
Over ten years, mining, quarrying, and oil and gas extraction had the lowest rate in the 2015 cohort at 24.5%, followed by information at 30.0%. In the first year, information was weakest at 71.6%, followed by professional, scientific and technical services at 74.5%. Agriculture had the best ten-year rate at 53.0%.
How many businesses close each year in the US?
About 1.2 million business establishments closed permanently in 2023, according to the SBA Office of Advocacy. Openings are running high as well. BLS counted 1,049,106 new private-sector establishments in the year ended March 2023, and 980,333 in the year ended March 2025.
Does this data include freelancers and sole proprietors?
No. BLS Business Employment Dynamics tracks establishments with employees, counted by physical location. A freelancer or sole proprietor without payroll does not show up in these numbers. A business with several locations can show up more than once, since each location is tracked on its own.
Am I personally liable if my small business closes?
It depends on how the business is set up and what you signed. An LLC or corporation usually keeps business debts away from your personal assets. A personal guarantee on a lease, loan or equipment agreement removes that protection for that debt. Read every guarantee before you sign and ask for a cap or an end date.
Use this data
Every chart and card below is free to reuse under CC BY 4.0. Download what you need and link back to this page.
 Stat cards
 Key findings card
 Infographic
 Share of establishments opened in 2015 still operating, by year (BLS) (%)
 One-year survival rate of new establishments by opening year, 1994-2024 (%)
 Five-year survival rate of new establishments by opening year, 1994-2020 (%)
 Ten-year survival rate by industry, establishments opened in 2015 (%)
 First-year survival rate by industry, establishments opened in 2024 (%)
 New private-sector establishments opened per year, 1994-2025 (BLS)
 Establishment survival rates by industry (BLS Business Employment Dynamics, data through March 2025)
 Average survival of new employer establishments, 1994-2022 (SBA Office of Advocacy, from BLS BED)
Embed the infographic
Free to share on your site, blog or slides under CC BY 4.0. Please keep the credit link.
Sources and method
Every number on this page comes from the sources below, each opened and read on or before October 17, 2026. A second, independent review checked every figure against its source and corrected anything that did not match. Figures that could not be confirmed were left out.
- U.S. Bureau of Labor Statistics, Business Employment Dynamics: Table 7. Survival of private sector establishments by opening year, Total Private (Establishment age and survival data, data through March 2025 (index page last modified December 17, 2025))
- U.S. Bureau of Labor Statistics, Business Employment Dynamics: Table 7. Survival of private sector establishments by opening year, by NAICS sector (19 tables, e.g. Retail Trade) (Data through March 2025 (index page last modified December 17, 2025); files at https://www.bls.gov/bdm/us_age_naics_[NAICS]_table7.txt)
- U.S. Small Business Administration, Office of Advocacy, Frequently Asked Questions About Small Business (Question 9: new business survival rate; Question 10: openings and closings) (February 2026)
Cite this page
ClauseAudit, “Small Business Failure Rate: Survival Rates by Year and Industry”, updated October 17, 2026, https://clauseaudit.com/data/small-business-failure-rate. Free to reuse with a link back (CC BY 4.0).
This page summarises published data and law as checked on October 17, 2026. Figures are updated as new editions are released, and your own situation may differ. It is general information, not legal, tax or financial advice.