SBA Loan Default Rates by Industry (Charge-Off Data From SBA Loan Records)
By ClauseAudit Research · 4 sources ·
What are the SBA loan default rates by industry?
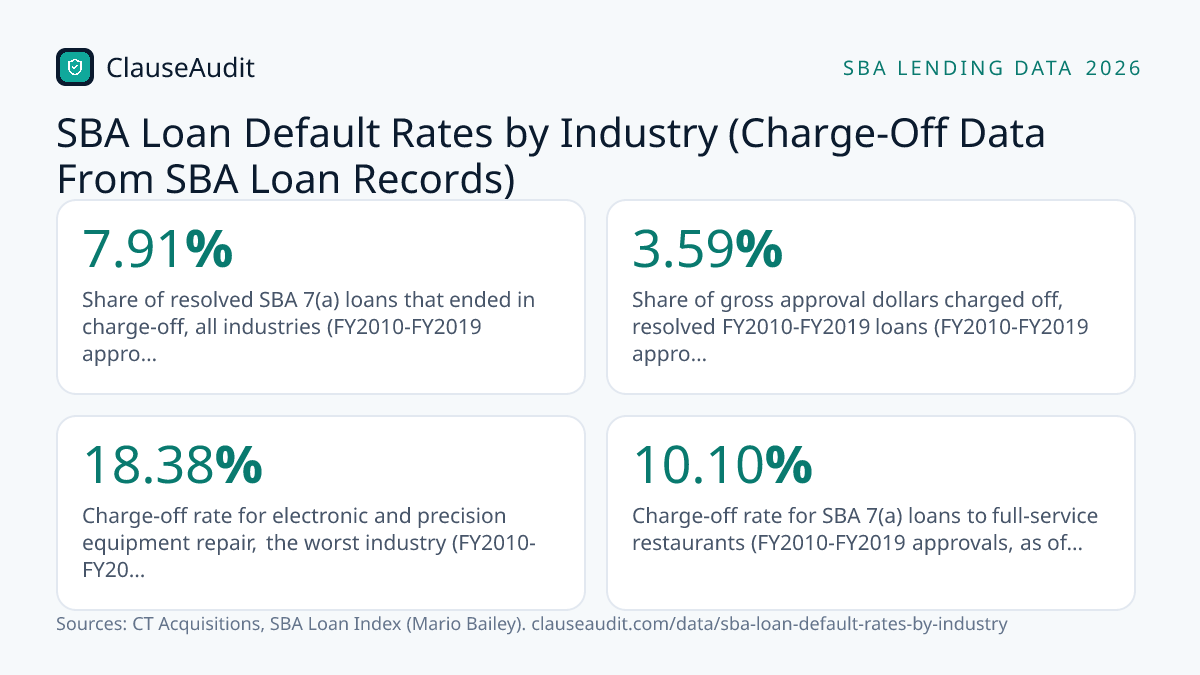
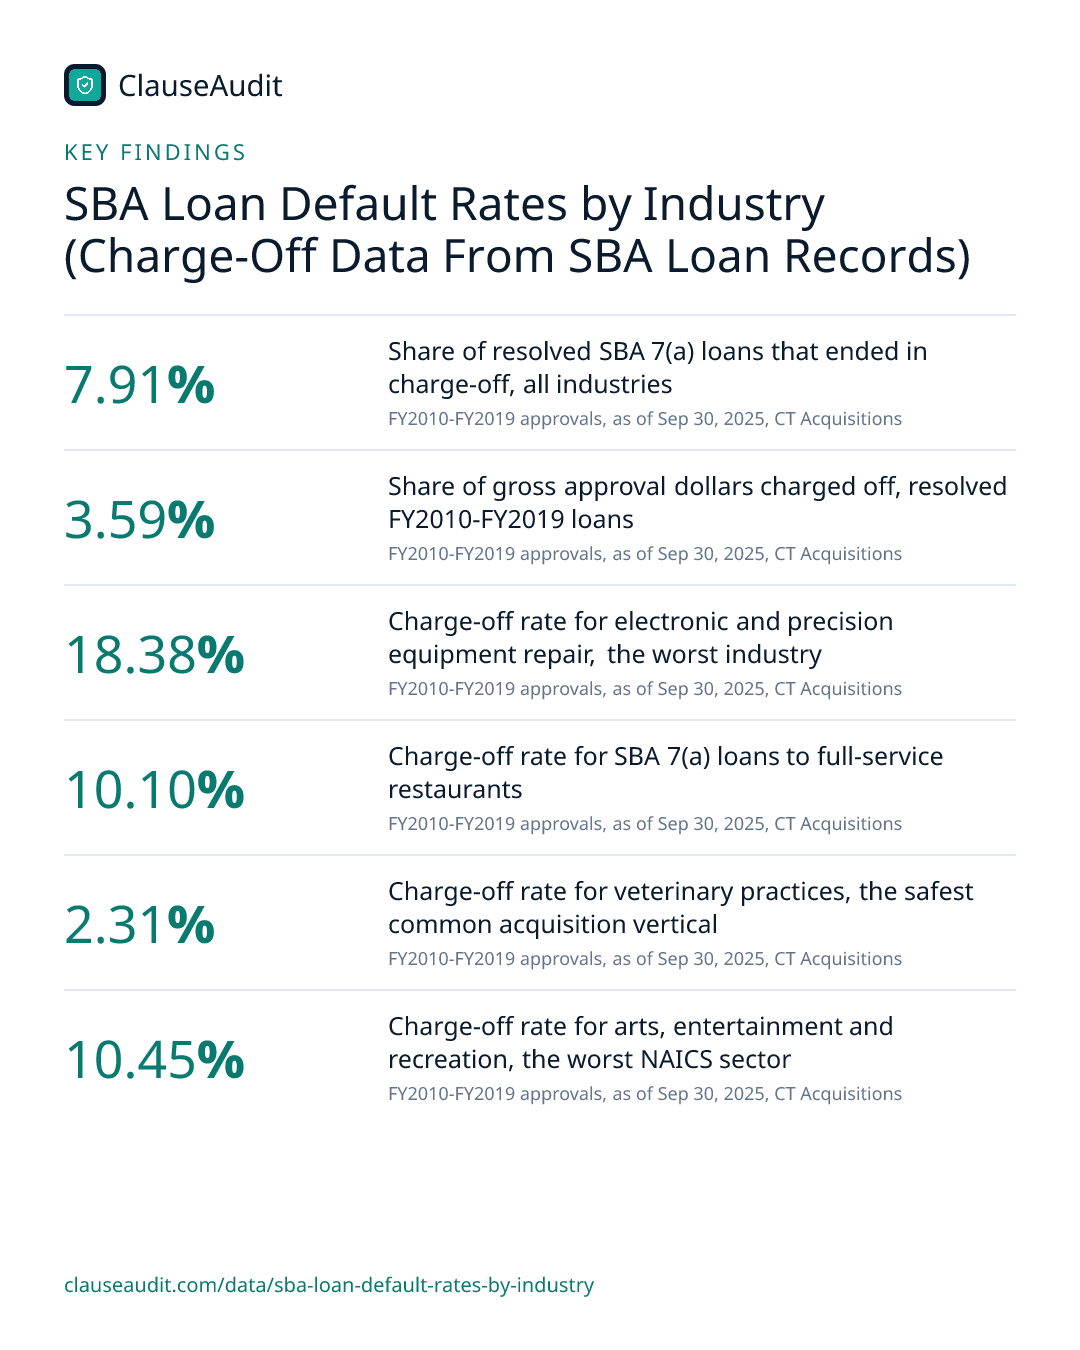
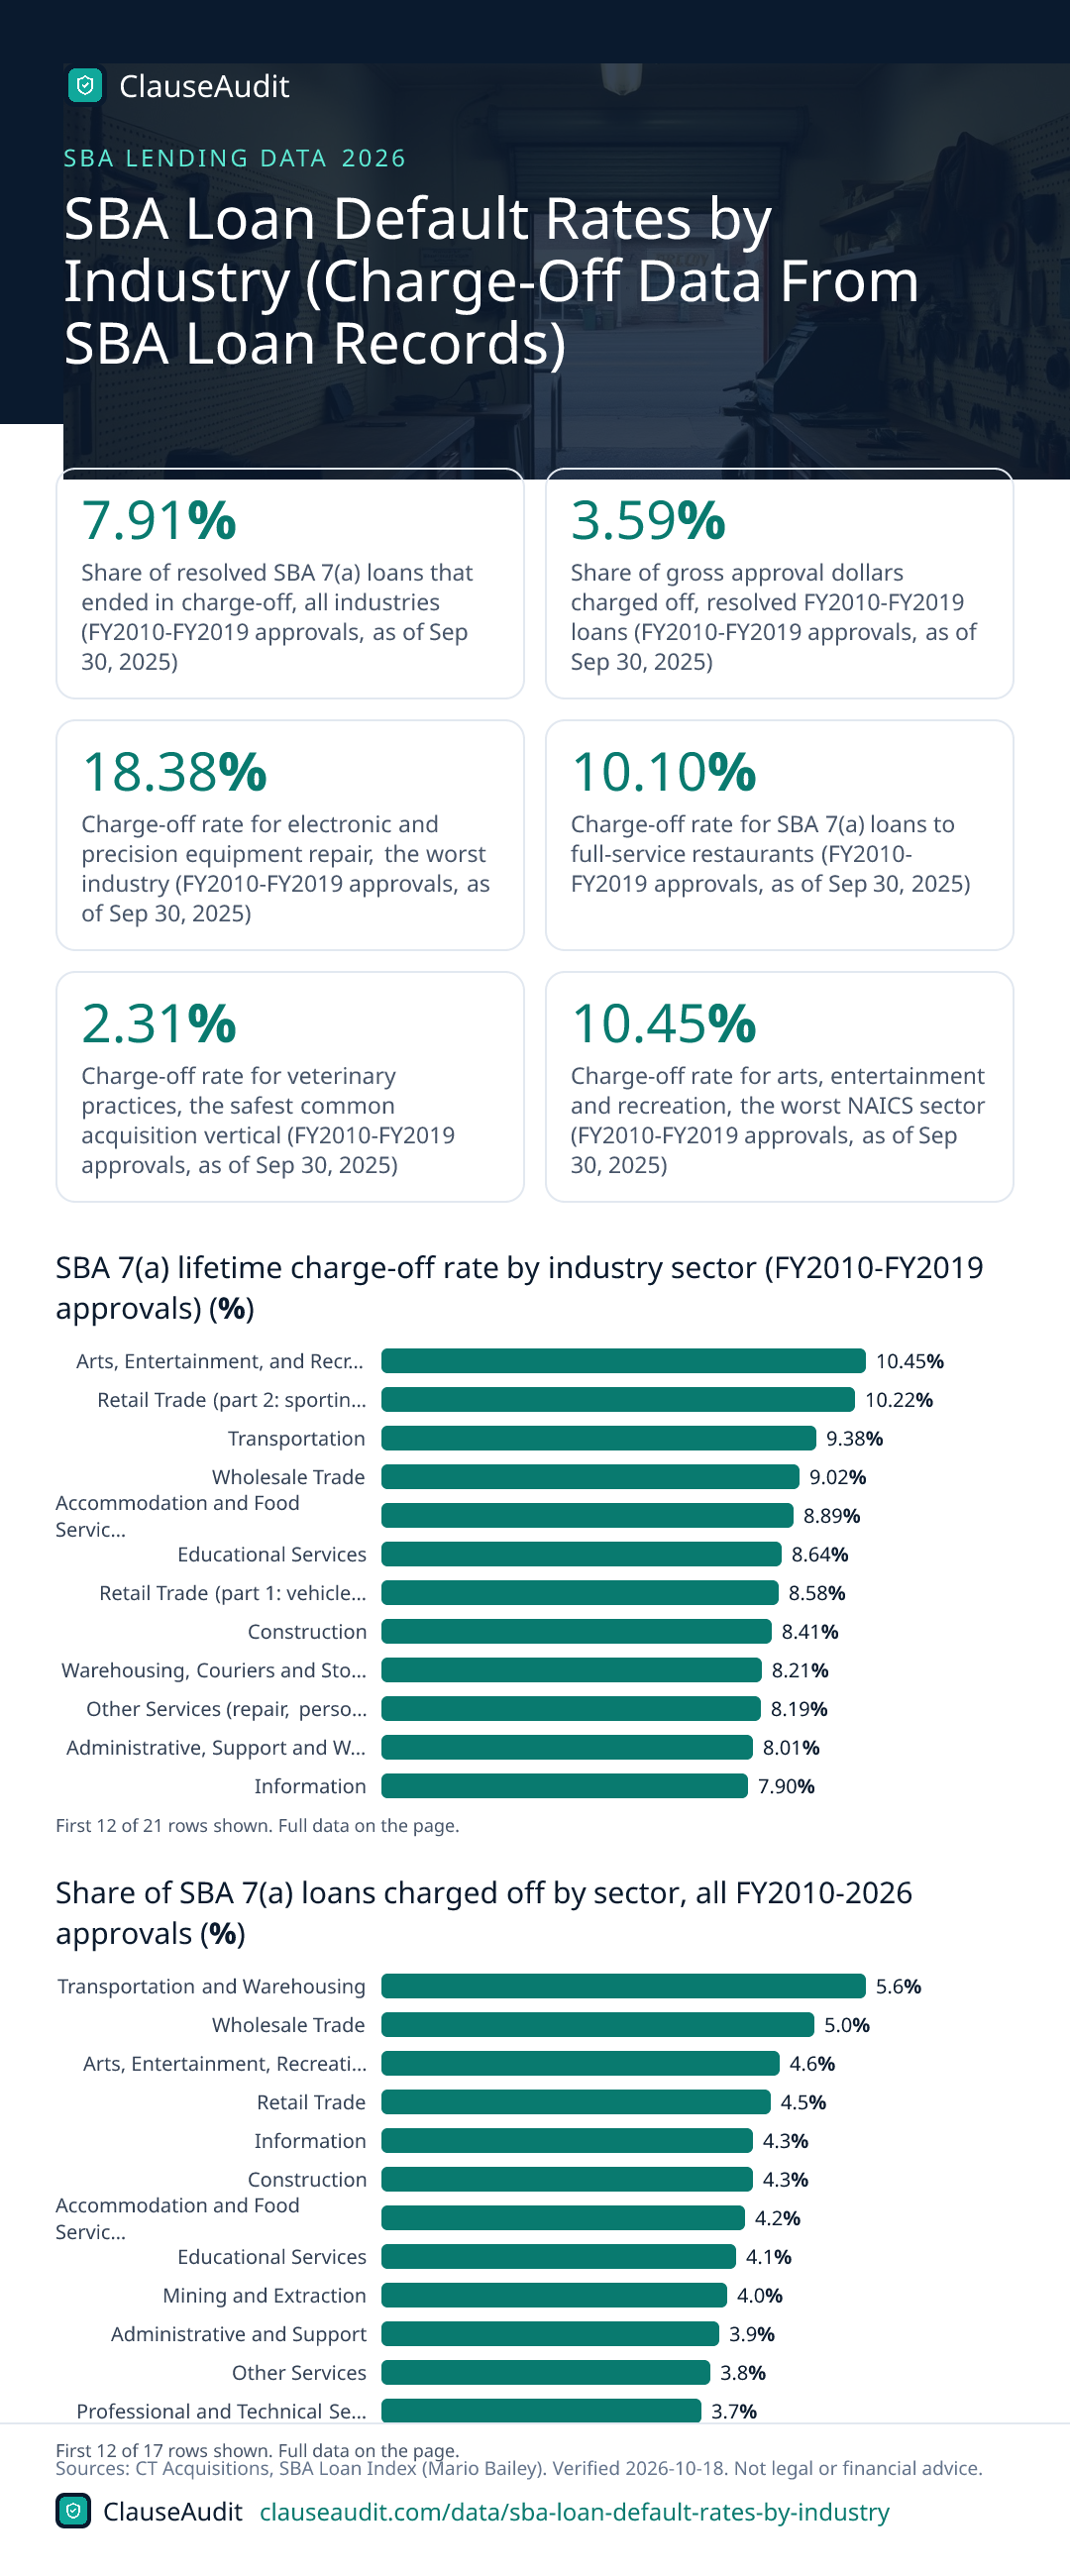
Across all industries, 7.91% of resolved SBA 7(a) loans approved in FY2010-FY2019 ended in charge-off. The spread by industry is wide. Electronic and precision equipment repair was worst at 18.38%, full-service restaurants came in at 10.10%, and veterinary practices sat at just 2.31%. Measured by dollars, losses were lower, at 3.59%.
- Share of resolved SBA 7(a) loans that ended in charge-off, all industries (FY2010-FY2019 approvals, as of Sep 30, 2025, CT Acquisitions)
- 7.91%
- Share of gross approval dollars charged off, resolved FY2010-FY2019 loans (FY2010-FY2019 approvals, as of Sep 30, 2025, CT Acquisitions)
- 3.59%
- Charge-off rate for electronic and precision equipment repair, the worst industry (FY2010-FY2019 approvals, as of Sep 30, 2025, CT Acquisitions)
- 18.38%
- Charge-off rate for SBA 7(a) loans to full-service restaurants (FY2010-FY2019 approvals, as of Sep 30, 2025, CT Acquisitions)
- 10.10%
- Charge-off rate for veterinary practices, the safest common acquisition vertical (FY2010-FY2019 approvals, as of Sep 30, 2025, CT Acquisitions)
- 2.31%
- Charge-off rate for arts, entertainment and recreation, the worst NAICS sector (FY2010-FY2019 approvals, as of Sep 30, 2025, CT Acquisitions)
- 10.45%
- Charge-off rate for business-acquisition loans, versus 9.83% for other 7(a) loans (FY2018-FY2019 approvals, as of Sep 30, 2025, CT Acquisitions)
- 6.88%
- Cumulative charge-off share for transportation and warehousing, highest sector (health care lowest, 2.4%) (FY2010-2026 approvals, as of Mar 31, 2026, SBA Loan Index (Mario Bailey))
- 5.6%
A charge-off is the point where the lender gives up on collecting and writes the loan off. For an SBA 7(a) borrower, that usually means the business failed, the collateral got sold, and the owner still faces the personal guarantee. This page ranks industries by how often that happened, using loan-level SBA records.
The industry you are in shapes your odds more than most people expect. A dental office and a residential remodeler can borrow under the same program, sign almost the same paperwork, and end up with charge-off rates several times apart. Knowing where your field sits helps you size the loan, pick your terms, and read the guarantee with clear eyes.
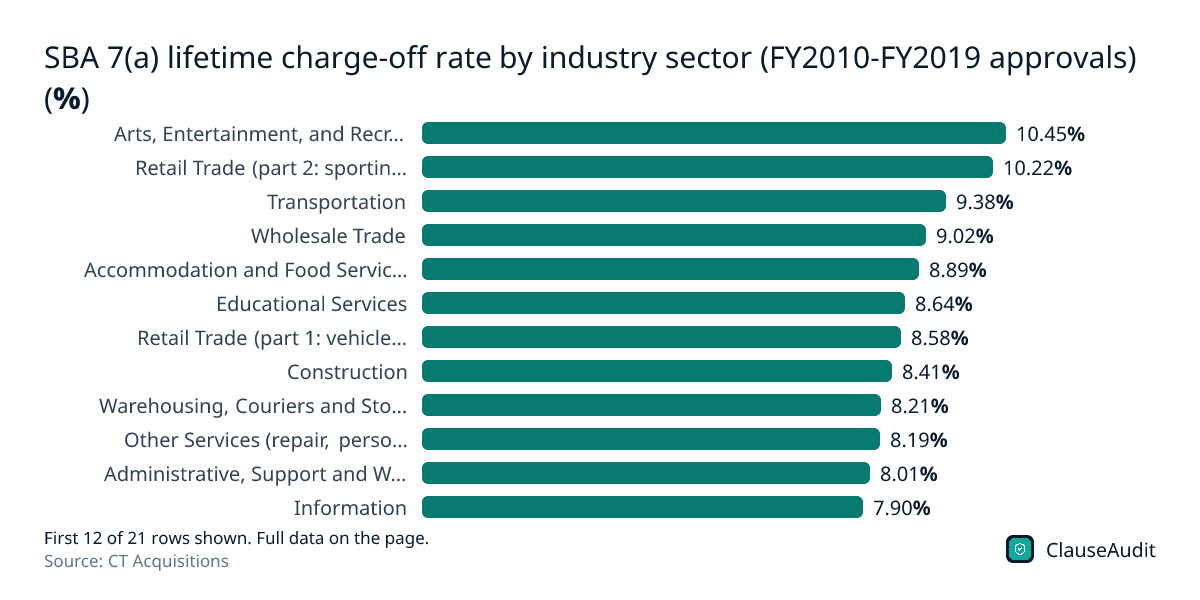
SBA 7(a) lifetime charge-off rate by industry sector (FY2010-FY2019 approvals) (%)
Chart data
| Label | Value |
|---|---|
| Arts, Entertainment, and Recreation | 10.45% |
| Retail Trade (part 2: sporting goods, hobby, general merchandise, online) | 10.22% |
| Transportation | 9.38% |
| Wholesale Trade | 9.02% |
| Accommodation and Food Services | 8.89% |
| Educational Services | 8.64% |
| Retail Trade (part 1: vehicles, food, health, gas) | 8.58% |
| Construction | 8.41% |
| Warehousing, Couriers and Storage | 8.21% |
| Other Services (repair, personal care, laundry) | 8.19% |
| Administrative, Support and Waste Management | 8.01% |
| Information | 7.90% |
| Manufacturing (food, beverage, textiles) | 7.36% |
| Mining, Quarrying, Oil and Gas Extraction | 7.28% |
| Professional, Scientific, and Technical Services | 6.98% |
| Manufacturing (wood, paper, chemicals, plastics) | 6.95% |
| Manufacturing (metals, machinery, electronics) | 6.65% |
| Real Estate and Rental and Leasing | 5.56% |
| Health Care and Social Assistance | 5.24% |
| Agriculture, Forestry, Fishing and Hunting | 4.78% |
| Finance and Insurance | 4.72% |
Arts, entertainment and recreation led the sectors at 10.45%, while finance and insurance had the lowest rate at 4.72%. Retail, transportation and wholesale trade fill out the rest of the top four.
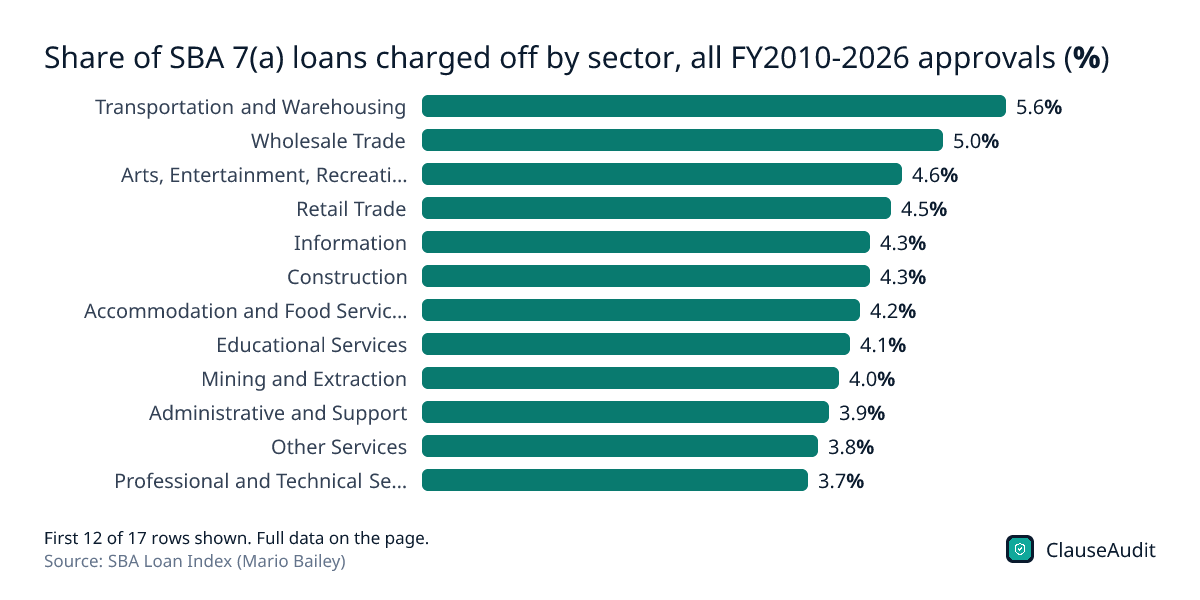
Download this chart (PNG)Share of SBA 7(a) loans charged off by sector, all FY2010-2026 approvals (%)
Chart data
| Label | Value |
|---|---|
| Transportation and Warehousing | 5.6% |
| Wholesale Trade | 5.0% |
| Arts, Entertainment, Recreation | 4.6% |
| Retail Trade | 4.5% |
| Information | 4.3% |
| Construction | 4.3% |
| Accommodation and Food Services | 4.2% |
| Educational Services | 4.1% |
| Mining and Extraction | 4.0% |
| Administrative and Support | 3.9% |
| Other Services | 3.8% |
| Professional and Technical Services | 3.7% |
| Manufacturing | 3.5% |
| Real Estate | 2.9% |
| Agriculture, Forestry, Fishing | 2.6% |
| Finance and Insurance | 2.5% |
| Health Care and Social Assistance | 2.4% |
These shares count every loan approved in FY2010-2026, including loans still being repaid, so they run lower than the resolved-loan rates above. Use them to compare sectors with each other, not with the other chart.
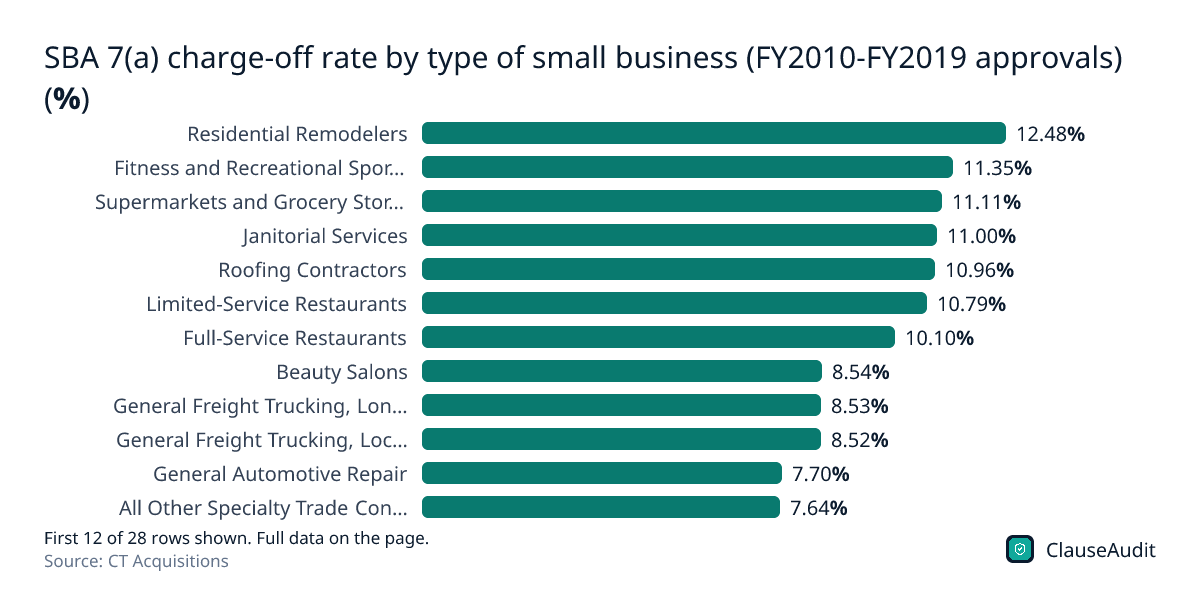
Download this chart (PNG)SBA 7(a) charge-off rate by type of small business (FY2010-FY2019 approvals) (%)
Chart data
| Label | Value |
|---|---|
| Residential Remodelers | 12.48% |
| Fitness and Recreational Sports Centers | 11.35% |
| Supermarkets and Grocery Stores | 11.11% |
| Janitorial Services | 11.00% |
| Roofing Contractors | 10.96% |
| Limited-Service Restaurants | 10.79% |
| Full-Service Restaurants | 10.10% |
| Beauty Salons | 8.54% |
| General Freight Trucking, Long-Distance | 8.53% |
| General Freight Trucking, Local | 8.52% |
| General Automotive Repair | 7.70% |
| All Other Specialty Trade Contractors | 7.64% |
| Electrical Contractors | 7.51% |
| Home Care Services for the Elderly | 7.01% |
| HVAC and Plumbing Contractors | 7.00% |
| Landscaping Services | 6.95% |
| Real Estate Brokerages | 6.02% |
| Nursing Care Facilities | 5.67% |
| Offices of CPAs | 5.53% |
| Offices of Lawyers | 5.45% |
| Pest Control Services | 5.12% |
| Offices of Physicians | 4.95% |
| Laundromats and Drycleaners | 4.65% |
| Child Day Care Services | 4.52% |
| Gas Stations with Convenience Stores | 3.98% |
| Offices of Dentists | 2.99% |
| Hotels and Motels | 2.93% |
| Veterinary Services | 2.31% |
Residential remodelers topped this list at 12.48%, with fitness centers at 11.35%. Dentists, hotels and vets sit at the bottom, with veterinary services lowest at 2.31%.
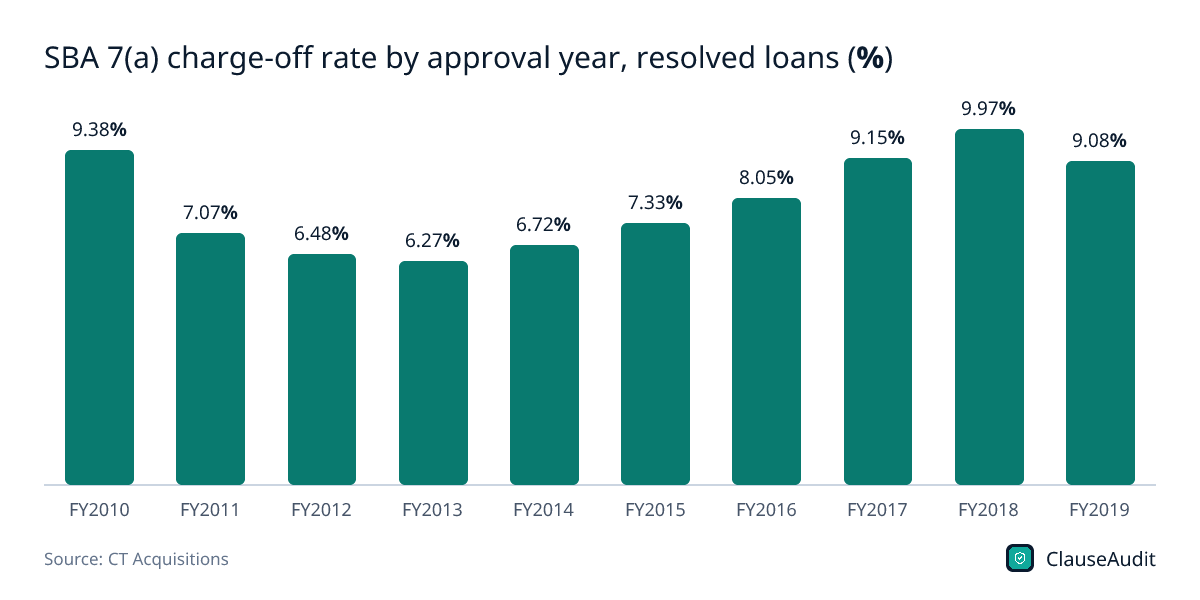
Download this chart (PNG)SBA 7(a) charge-off rate by approval year, resolved loans (%)
Chart data
| Label | Value (%) |
|---|---|
| FY2010 | 9.38% |
| FY2011 | 7.07% |
| FY2012 | 6.48% |
| FY2013 | 6.27% |
| FY2014 | 6.72% |
| FY2015 | 7.33% |
| FY2016 | 8.05% |
| FY2017 | 9.15% |
| FY2018 | 9.97% |
| FY2019 | 9.08% |
Loans approved in FY2013 charged off at 6.27%, while FY2018 loans reached 9.97%. Later cohorts are still partly open, so their rates can still move.
Download this chart (PNG)Share of SBA 7(a) loans charged off by loan size, FY2010-2026 approvals (%)
Chart data
| Label | Value (%) |
|---|---|
| Under $50k | 5.9% |
| $50k to $150k | 4.4% |
| $150k to $350k | 4.1% |
| $350k to $1M | 2.5% |
| $1M to $5M | 1.7% |
| $5M and up | 0.7% |
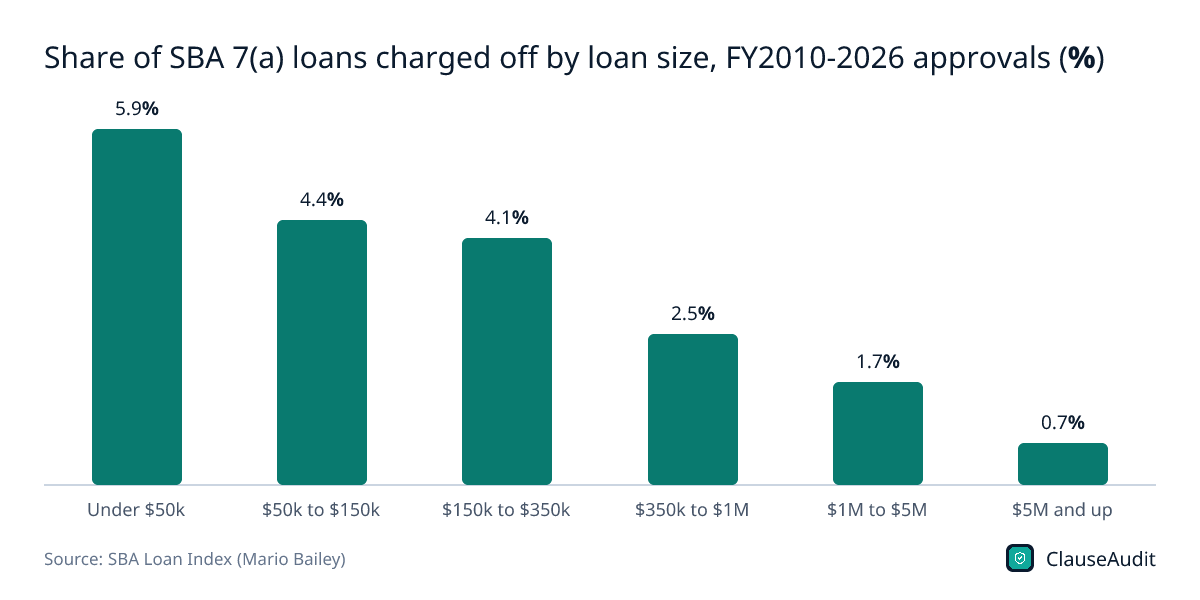
Small loans failed far more often: 5.9% of loans under $50k were charged off, against 0.7% of loans of $5M and up. These are shares of all approvals, including open loans, so compare the bars with each other.
Download this chart (PNG)Full-service restaurant SBA 7(a) charge-off rate by approval year (%)
Chart data
| Label | Value (%) |
|---|---|
| FY2013 | 10.04% |
| FY2014 | 8.32% |
| FY2015 | 9.65% |
| FY2016 | 10.30% |
| FY2017 | 9.92% |
| FY2018 | 10.48% |
| FY2019 | 8.93% |
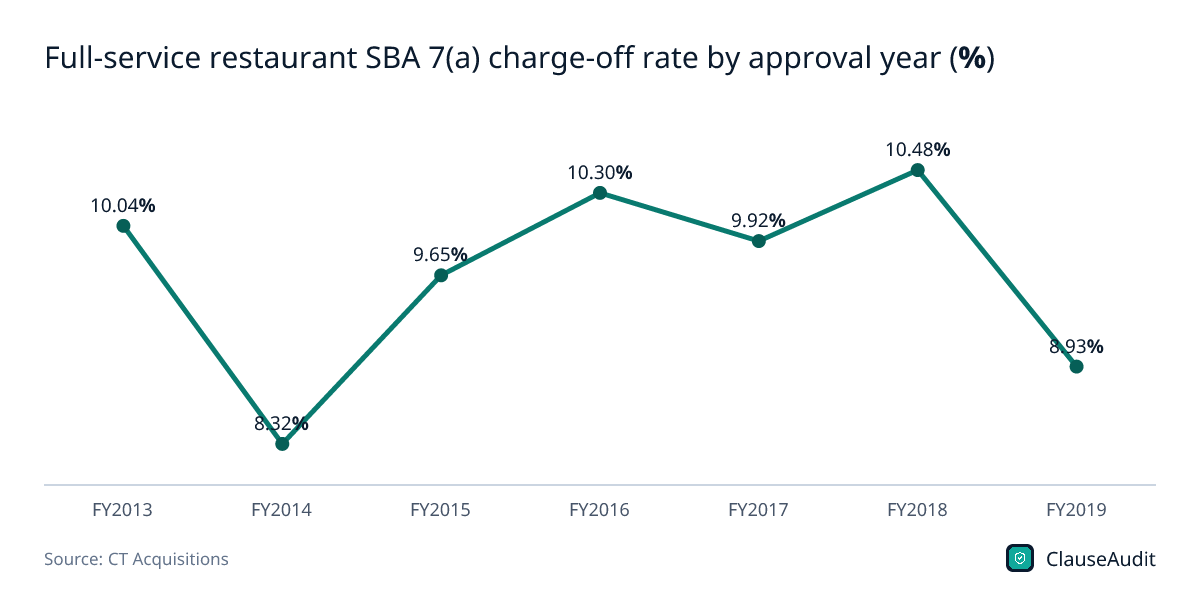
Full-service restaurants stayed between 8.32% and 10.48% in every approval year shown. That consistency suggests the risk is built into the business model, not a single bad year.
Download this chart (PNG)20 industries with the highest SBA 7(a) charge-off rates (four-digit NAICS, FY2010-FY2019 approvals, at least 100 resolved loans)
| Rank | NAICS | Industry | Resolved loans | Charge-off rate | Dollar charge-off rate |
|---|---|---|---|---|---|
| 1 | 8112 | Electronic and Precision Equipment Repair and Maintenance | 963 | 18.38% | 9.90% |
| 2 | 4853 | Taxi and Limousine Service | 848 | 17.22% | 6.66% |
| 3 | 4859 | Other Transit and Ground Passenger Transportation | 577 | 15.77% | 7.96% |
| 4 | 4431 | Electronics and Appliance Stores | 1,373 | 15.73% | 9.66% |
| 5 | 7114 | Agents and Managers for Artists, Athletes, Entertainers | 149 | 14.09% | 3.53% |
| 6 | 3341 | Computer and Peripheral Equipment Manufacturing | 145 | 13.79% | 8.77% |
| 7 | 4541 | Electronic Shopping and Mail-Order Houses | 2,347 | 13.46% | 8.49% |
| 8 | 4482 | Shoe Stores | 508 | 13.39% | 8.94% |
| 9 | 4521 | Department Stores | 136 | 13.24% | 5.42% |
| 10 | 5122 | Sound Recording Industries | 235 | 13.19% | 4.23% |
| 11 | 5615 | Travel Arrangement and Reservation Services | 589 | 13.07% | 5.18% |
| 12 | 4411 | Automobile Dealers | 1,857 | 13.03% | 3.13% |
| 13 | 4243 | Apparel, Piece Goods, and Notions Merchant Wholesalers | 1,507 | 12.87% | 3.83% |
| 14 | 7131 | Amusement Parks and Arcades | 457 | 12.69% | 6.52% |
| 15 | 3256 | Soap, Cleaning Compound, and Toilet Preparation Manufacturing | 213 | 12.68% | 7.30% |
| 16 | 3152 | Cut and Sew Apparel Manufacturing | 596 | 12.58% | 5.16% |
| 17 | 4236 | Household Appliance and Electronics Merchant Wholesalers | 1,268 | 12.46% | 4.25% |
| 18 | 4251 | Wholesale Electronic Markets, Agents and Brokers | 770 | 12.34% | 6.64% |
| 19 | 6219 | Other Ambulatory Health Care Services | 598 | 12.04% | 5.09% |
| 20 | 2361 | Residential Building Construction | 8,522 | 11.90% | 10.11% |
Source: CT Acquisitions, SBA Loan Default Rates by Industry 2026: Charge-Off League Table from 15 Years of 7(a) Data (computed from SBA 7(a) FOIA files as of Sep 30, 2025). Download as image
20 industries with the lowest SBA 7(a) charge-off rates (four-digit NAICS, FY2010-FY2019 approvals, at least 100 resolved loans)
| Rank | NAICS | Industry | Resolved loans | Charge-off rate | Dollar charge-off rate |
|---|---|---|---|---|---|
| 1 | 4872 | Scenic and Sightseeing Transportation, Water | 159 | 1.89% | 0.76% |
| 2 | 6232 | Residential Disability, Mental Health and Substance Abuse Facilities | 276 | 2.17% | 0.43% |
| 3 | 5231 | Securities and Commodity Contracts Intermediation and Brokerage | 136 | 2.21% | 0.77% |
| 4 | 4247 | Petroleum and Petroleum Products Merchant Wholesalers | 211 | 2.37% | 1.65% |
| 5 | 5311 | Lessors of Real Estate | 2,839 | 2.40% | 0.67% |
| 6 | 5511 | Management of Companies and Enterprises | 250 | 2.40% | 0.76% |
| 7 | 1119 | Other Crop Farming | 236 | 2.54% | 0.83% |
| 8 | 3366 | Ship and Boat Building | 157 | 2.55% | 0.99% |
| 9 | 1111 | Oilseed and Grain Farming | 156 | 2.56% | 1.53% |
| 10 | 5239 | Other Financial Investment Activities | 2,150 | 2.60% | 1.21% |
| 11 | 8122 | Death Care Services | 1,216 | 2.71% | 1.48% |
| 12 | 3364 | Aerospace Product and Parts Manufacturing | 218 | 2.75% | 0.39% |
| 13 | 4883 | Support Activities for Water Transportation | 106 | 2.83% | 7.63% |
| 14 | 3259 | Other Chemical Product and Preparation Manufacturing | 238 | 2.94% | 0.37% |
| 15 | 7211 | Traveler Accommodation (hotels and motels) | 6,363 | 2.94% | 1.46% |
| 16 | 6233 | Continuing Care and Assisted Living Facilities | 1,045 | 2.97% | 0.69% |
| 17 | 1121 | Cattle Ranching and Farming | 503 | 2.98% | 3.24% |
| 18 | 6212 | Offices of Dentists | 7,753 | 2.99% | 1.47% |
| 19 | 1113 | Fruit and Tree Nut Farming | 126 | 3.17% | 1.26% |
| 20 | 7212 | RV Parks and Recreational Camps | 406 | 3.20% | 1.03% |
Source: CT Acquisitions, SBA Loan Default Rates by Industry 2026: Charge-Off League Table from 15 Years of 7(a) Data (computed from SBA 7(a) FOIA files as of Sep 30, 2025). Download as image
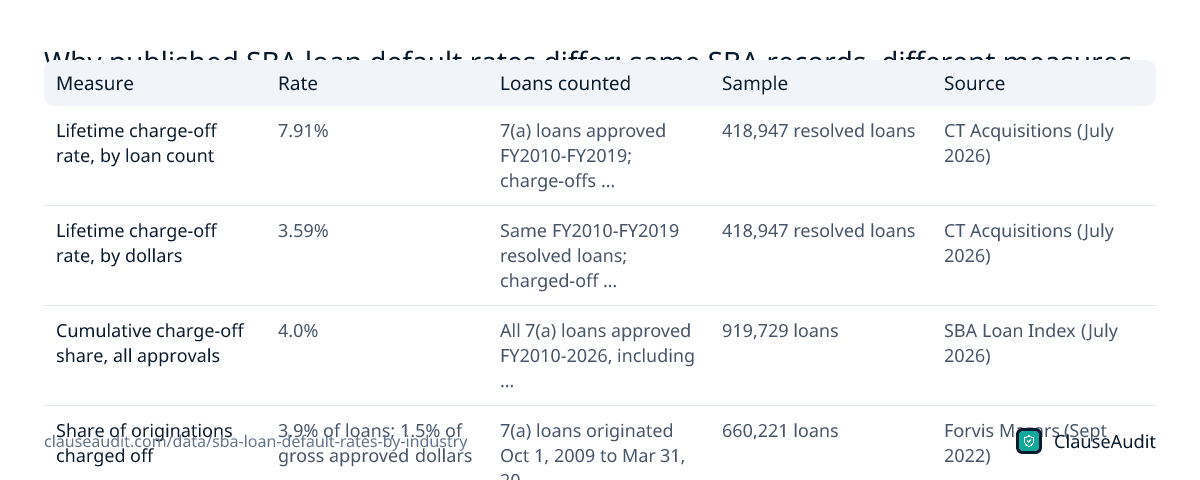
Why published SBA loan default rates differ: same SBA records, different measures
| Measure | Rate | Loans counted | Sample | Source |
|---|---|---|---|---|
| Lifetime charge-off rate, by loan count | 7.91% | 7(a) loans approved FY2010-FY2019; charge-offs divided by resolved loans (paid in full + charged off), as of Sep 30, 2025 | 418,947 resolved loans | CT Acquisitions (July 2026) |
| Lifetime charge-off rate, by dollars | 3.59% | Same FY2010-FY2019 resolved loans; charged-off dollars divided by gross approval dollars | 418,947 resolved loans | CT Acquisitions (July 2026) |
| Cumulative charge-off share, all approvals | 4.0% | All 7(a) loans approved FY2010-2026, including loans still outstanding, as of Mar 31, 2026 | 919,729 loans | SBA Loan Index (July 2026) |
| Share of originations charged off | 3.9% of loans; 1.5% of gross approved dollars | 7(a) loans originated Oct 1, 2009 to Mar 31, 2022 | 660,221 loans | Forvis Mazars (Sept 2022) |
| Charge-off rate of resolved loans, FY1992-2026 | 15.8% independent; 16.0% franchise | Resolved 7(a) loans (paid in full or charged off), approvals FY1992-2026 | 1,363,711 resolved loans | Finance Clearly (Aug 2026) |
Source: CT Acquisitions, SBA Loan Default Rates by Industry 2026: Charge-Off League Table from 15 Years of 7(a) Data (computed from SBA 7(a) FOIA files as of Sep 30, 2025); SBA Loan Index (Mario Bailey), SBA Charge-Off Rate Benchmarks: 919,729 Loans by Industry, Size, State & Vintage (SBA FOIA 7(a) and 504 data, as of 2026-03-31); Forvis Mazars, How to Avoid a Charge Off on Your Next SBA 7(a) Loan; Finance Clearly, SBA 7(a) Charge-Off Rates by Franchise Brand, Industry and State (FY1992-2026, CC BY 4.0). Download as image
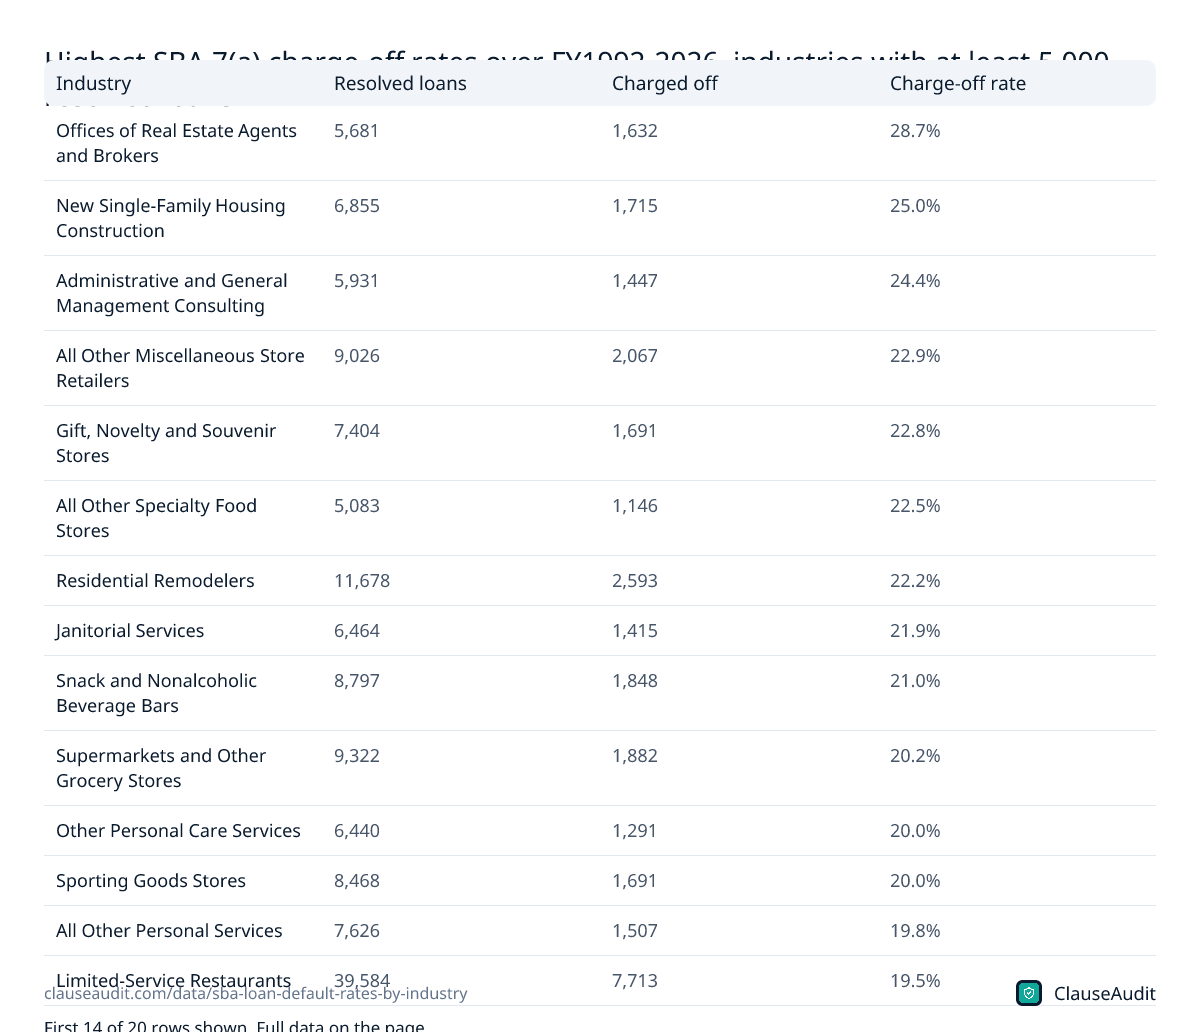
Highest SBA 7(a) charge-off rates over FY1992-2026, industries with at least 5,000 resolved loans
| Industry | Resolved loans | Charged off | Charge-off rate |
|---|---|---|---|
| Offices of Real Estate Agents and Brokers | 5,681 | 1,632 | 28.7% |
| New Single-Family Housing Construction | 6,855 | 1,715 | 25.0% |
| Administrative and General Management Consulting | 5,931 | 1,447 | 24.4% |
| All Other Miscellaneous Store Retailers | 9,026 | 2,067 | 22.9% |
| Gift, Novelty and Souvenir Stores | 7,404 | 1,691 | 22.8% |
| All Other Specialty Food Stores | 5,083 | 1,146 | 22.5% |
| Residential Remodelers | 11,678 | 2,593 | 22.2% |
| Janitorial Services | 6,464 | 1,415 | 21.9% |
| Snack and Nonalcoholic Beverage Bars | 8,797 | 1,848 | 21.0% |
| Supermarkets and Other Grocery Stores | 9,322 | 1,882 | 20.2% |
| Other Personal Care Services | 6,440 | 1,291 | 20.0% |
| Sporting Goods Stores | 8,468 | 1,691 | 20.0% |
| All Other Personal Services | 7,626 | 1,507 | 19.8% |
| Limited-Service Restaurants | 39,584 | 7,713 | 19.5% |
| Drycleaning and Laundry Services | 11,081 | 2,134 | 19.3% |
| Full-Service Restaurants | 55,748 | 10,337 | 18.5% |
| General Freight Trucking, Local | 13,180 | 2,379 | 18.1% |
| Beauty Salons | 17,154 | 3,069 | 17.9% |
| Fitness and Recreational Sports Centers | 14,468 | 2,525 | 17.5% |
| All Other Specialty Trade Contractors | 12,776 | 2,091 | 16.4% |
Source: Finance Clearly, SBA 7(a) Charge-Off Rates by Franchise Brand, Industry and State (FY1992-2026, CC BY 4.0). Download as image
What is the average SBA loan default rate?
It depends on how you count, which is why you see such different numbers quoted online. Measured by loan count, 7.91% of resolved SBA 7(a) loans approved in FY2010-FY2019 ended in charge-off. Resolved means the loan was either paid in full or written off. Loans still being repaid are left out.
Measured by dollars, the same group lost 3.59% of gross approved amounts. The gap tells you something useful: small loans fail more often than large ones, so they push the count-based rate up without moving the dollar rate much.
A third measure counts every approval, including open loans. On that basis, 4.0% of 7(a) loans approved in FY2010-2026 had been charged off as of Mar 31, 2026. That figure looks safer only because many of those loans have not had time to fail yet.
When a lender, broker or seller quotes you a default rate, ask which measure it is. The resolved-loan rate is the closest thing to your real odds over the life of the loan.
Which industries have the highest SBA loan default rates?
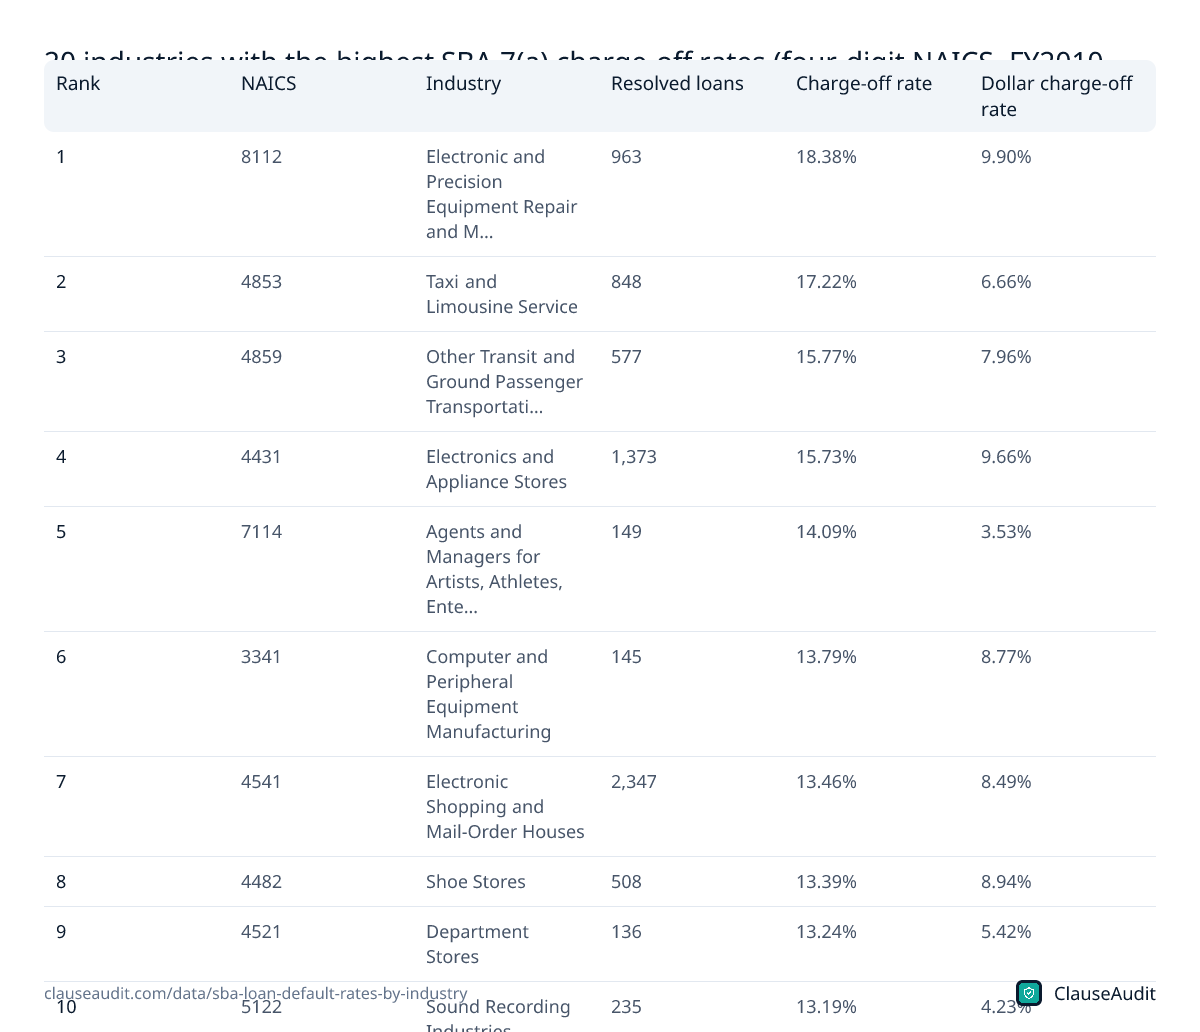
The worst four-digit industry was electronic and precision equipment repair, at 18.38%. Taxi and limousine service followed at 17.22%, then other ground passenger transit at 15.77% and electronics and appliance stores at 15.73%.
A few patterns show up again and again. Businesses that lost ground to a new technology or a new competitor sit high on the list: think taxi fleets after ride-hailing, or shoe and department stores after online shopping. Businesses that depend on discretionary spending, like amusement parks and travel agencies, fall apart fast in a downturn. And many residential construction trades combine lumpy cash flow with fixed equipment costs. Residential building construction charged off at 11.90% across 8,522 resolved loans, so that rate is not a small-sample fluke.
Restaurants deserve their own mention because so many owners use SBA money to open one. Full-service restaurants charged off at 10.10% and limited-service restaurants at 10.79%. That is well above the 7.91% average, and the full-service rate held steady across approval years.
What are the safest businesses to finance with an SBA loan?
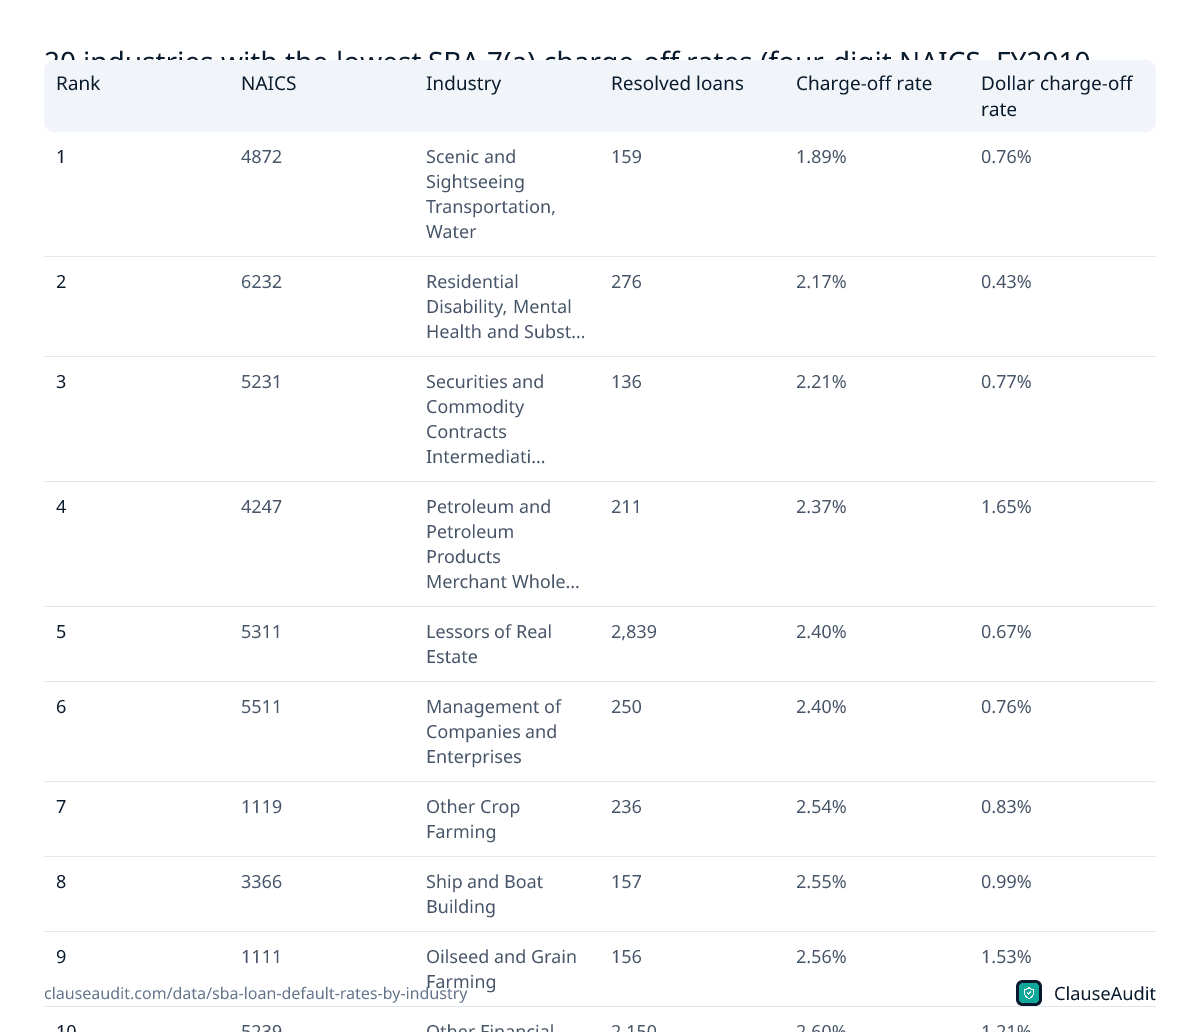
Licensed professional practices and asset-heavy businesses sit at the bottom of the charge-off rankings. Veterinary practices came in at 2.31%, dental offices at 2.99%, and hotels and motels at 2.93%. Lessors of real estate charged off at 2.40% across 2,839 resolved loans.
What these have in common is steady demand and something solid behind the loan. Demand for vet care tends to hold up when the economy slows. A hotel loan is usually backed by the building. A dental practice has patients who come back on a regular schedule and a license that limits new competitors.
At the sector level, health care and social assistance came in at 5.24% and finance and insurance at 4.72%. Low risk is not no risk, though. Even in the safest industry on the list, some owners lost the business and still owed on the guarantee.
Does loan size or deal type change your odds?
Yes, and by a lot. Of loans approved in FY2010-2026, 5.9% of those under $50k had been charged off as of Mar 31, 2026, compared with 0.7% of loans of $5M and up. Small loans tend to go to newer businesses with thin cash reserves and little collateral.
Buying an existing business also helped. Among FY2018-FY2019 approvals, business-acquisition loans charged off at 6.88%, against 9.83% for other 7(a) loans. A going concern comes with customers, staff and a track record, which is easier to underwrite than a startup forecast. Those cohorts are still partly open, so treat the gap as a direction rather than a final score.
Timing matters too. Loans approved in FY2010 charged off at 9.38%, while FY2013 loans came in at 6.27%. You cannot pick your economy, but you can build a cushion into the deal.
How should a buyer or franchisee use these rankings?
If you are buying a business, the industry rate is your starting point, not your answer. A remodeling company with long-standing commercial clients and a full backlog is a different bet from one that lives on walk-in homeowner jobs. Use the ranking to decide how hard to dig, then test the specific business against it.
Look at the longer history too. Over FY1992-2026, residential remodelers charged off at 22.2% of resolved loans and full-service restaurants at 18.5%. Those longer windows include the Great Recession, so they show what a bad cycle can do to a fragile industry.
In a high-risk field, ask the seller for several years of tax returns, not just a broker summary. Check how much revenue comes from the top few customers. Find out whether the lease can be assigned to you, and on what terms. And if the seller will not carry any of the price, ask yourself why.
Franchise buyers should compare their brand with the industry baseline. A brand that runs well above its own category is telling you something the sales deck will not.
What to do if your industry ranks high
A high rate does not mean you should walk away. It means your loan terms carry more weight, because you are more likely to need them. Before you sign, work through these:
- Borrow working capital with the loan, not just the purchase price. Many failures start as a cash crunch in the first year, not a bad business.
- Read the personal guarantee line by line. Find out whether it is unlimited, whether your spouse must sign, and whether your home is pledged as collateral.
- Match your lease to your loan. A long loan on a business with a short lease leaves you exposed if the landlord will not renew.
- Check what counts as a default. Missing a payment is obvious, but some notes also treat a change in ownership, a lien, or a drop in financial condition as a default.
- Ask about the variable rate. If your rate floats, run your cash flow at a higher payment before you commit.
- If you are buying a business, ask the seller to carry part of the price as a seller note, so they share some of the risk if revenue drops after closing.
How ClauseAudit helps
When a loan goes bad, the promissory note, guarantee and security agreement decide what you lose. Those documents are long and dense, and most borrowers sign them at closing without reading every page.
Upload your loan paperwork and the automated review flags the clauses that matter most if your business has a rough year, explained in plain English, with questions to raise before you sign.
- Personal guarantee scope: unlimited or capped, and whether a spouse must sign
- Collateral and liens, including any pledge of your home
- Events of default, cross-default and material adverse change triggers
- Variable rate terms, late fees and default interest
- Prepayment penalties if you sell or refinance early
- Financial reporting and covenant requirements
Frequently asked questions
What percentage of SBA loans default?
Of SBA 7(a) loans approved in FY2010-FY2019 that had been resolved by Sep 30, 2025, 7.91% ended in charge-off. By dollars, the loss was 3.59% of approved amounts. Your own odds depend heavily on your industry, the loan size, and if you are starting a business or buying one that already works.
Which industry has the highest SBA loan default rate?
Among four-digit industries with at least 100 resolved loans, electronic and precision equipment repair ranked worst at 18.38% for FY2010-FY2019 approvals. Taxi and limousine service was next at 17.22%. At the broad sector level, arts, entertainment and recreation had the highest rate at 10.45%.
Do restaurants default on SBA loans more often?
Yes. Full-service restaurants charged off at 10.10% and limited-service restaurants at 10.79%, both above the 7.91% all-industry rate for FY2010-FY2019 approvals. If you are financing a restaurant, borrow enough working capital to get through a slow first year and read the personal guarantee carefully.
What is the difference between a default and a charge-off?
A default happens when you break the loan terms, usually by missing payments. Many defaults get cured or worked out. A charge-off comes later, when the lender decides the debt will not be collected in the normal way and writes it off. A charge-off does not erase what you owe under a personal guarantee.
What happens to my personal assets if my SBA loan is charged off?
Owners usually sign a personal guarantee, so the lender or the SBA can pursue you after the business collateral is sold. That can include liens on your home if you pledged it. Some borrowers settle through an offer in compromise. Read the guarantee and security agreement before closing so you know exactly what is on the line.
Are business acquisition loans safer than startup loans?
In the data, yes. Among FY2018-FY2019 approvals, business-acquisition loans charged off at 6.88%, compared with 9.83% for other 7(a) loans. An existing business has proven revenue and customers. Those cohorts are still partly outstanding, though, so the final rates may shift.
Why do different websites show different SBA default rates?
They measure different things. Some count only resolved loans, some count every approval including loans still being repaid, and some measure dollars instead of loan count. The resolved-loan rate for FY2010-FY2019 approvals was 7.91%, while the cumulative share across FY2010-2026 approvals was 4.0% as of Mar 31, 2026.
Does a small loan carry more risk than a large one?
It tends to. Among FY2010-2026 approvals, 5.9% of loans under $50k had been charged off as of Mar 31, 2026, versus 0.7% of loans of $5M and up. Smaller loans tend to go to younger businesses with less collateral and fewer cash reserves to absorb a bad stretch.
Use this data
Every chart and card below is free to reuse under CC BY 4.0. Download what you need and link back to this page.
 Stat cards
 Key findings card
 Infographic
 SBA 7(a) lifetime charge-off rate by industry sector (FY2010-FY2019 approvals) (%)
 Share of SBA 7(a) loans charged off by sector, all FY2010-2026 approvals (%)
 SBA 7(a) charge-off rate by type of small business (FY2010-FY2019 approvals) (%)
 SBA 7(a) charge-off rate by approval year, resolved loans (%)
 Share of SBA 7(a) loans charged off by loan size, FY2010-2026 approvals (%)
 Full-service restaurant SBA 7(a) charge-off rate by approval year (%)
 20 industries with the highest SBA 7(a) charge-off rates (four-digit NAICS, FY2010-FY2019 approvals, at least 100 resolved loans)
 20 industries with the lowest SBA 7(a) charge-off rates (four-digit NAICS, FY2010-FY2019 approvals, at least 100 resolved loans)
 Why published SBA loan default rates differ: same SBA records, different measures
 Highest SBA 7(a) charge-off rates over FY1992-2026, industries with at least 5,000 resolved loans
Embed the infographic
Free to share on your site, blog or slides under CC BY 4.0. Please keep the credit link.
Sources and method
Every number on this page comes from the sources below, each opened and read on or before October 18, 2026. A second, independent review checked every figure against its source and corrected anything that did not match. Figures that could not be confirmed were left out.
- CT Acquisitions, SBA Loan Default Rates by Industry 2026: Charge-Off League Table from 15 Years of 7(a) Data (computed from SBA 7(a) FOIA files as of Sep 30, 2025) (July 2026 (last verified July 2026; page modified October 14, 2026))
- SBA Loan Index (Mario Bailey), SBA Charge-Off Rate Benchmarks: 919,729 Loans by Industry, Size, State & Vintage (SBA FOIA 7(a) and 504 data, as of 2026-03-31) (Published July 4, 2026; updated July 11, 2026)
- Forvis Mazars, How to Avoid a Charge Off on Your Next SBA 7(a) Loan (September 2022)
- Finance Clearly, SBA 7(a) Charge-Off Rates by Franchise Brand, Industry and State (FY1992-2026, CC BY 4.0) (August 24, 2026 (initial publication))
Cite this page
ClauseAudit, “SBA Loan Default Rates by Industry (Charge-Off Data From SBA Loan Records)”, updated October 18, 2026, https://clauseaudit.com/data/sba-loan-default-rates-by-industry. Free to reuse with a link back (CC BY 4.0).
This page summarises published data and law as checked on October 18, 2026. Figures are updated as new editions are released, and your own situation may differ. It is general information, not legal, tax or financial advice.