SBA Business Acquisition Loan Statistics: Volume, Loan Size and Default Rates
By ClauseAudit Research · 4 sources ·
What do SBA 7(a) loan statistics show for business acquisitions?
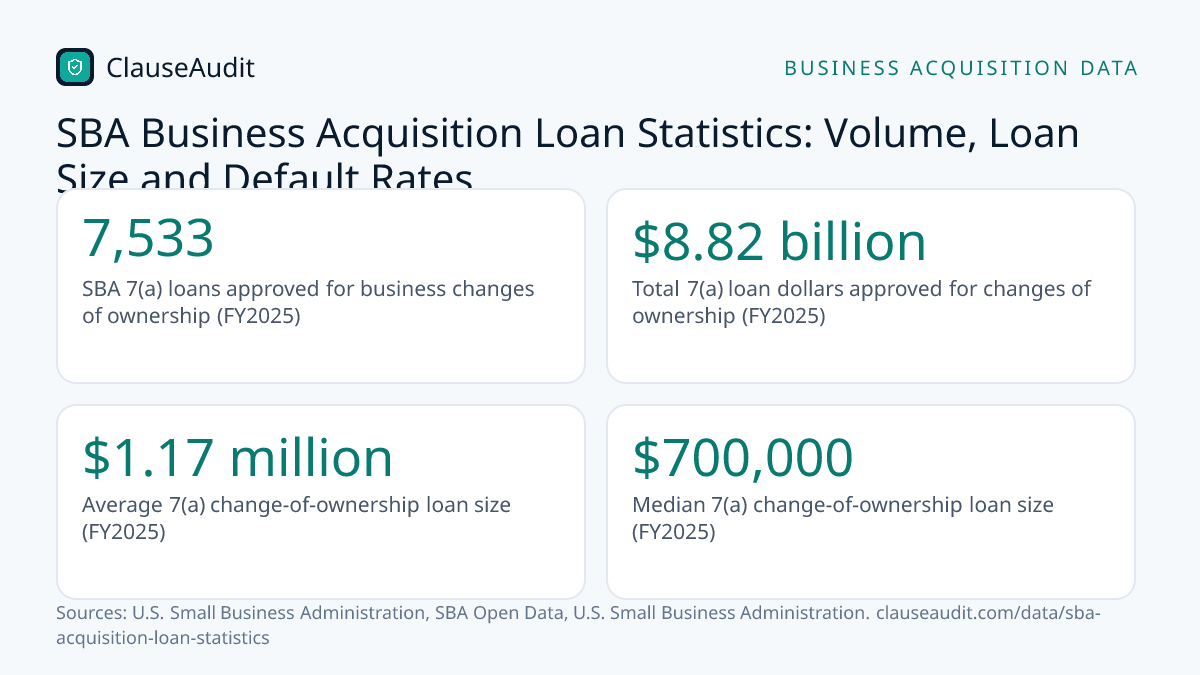
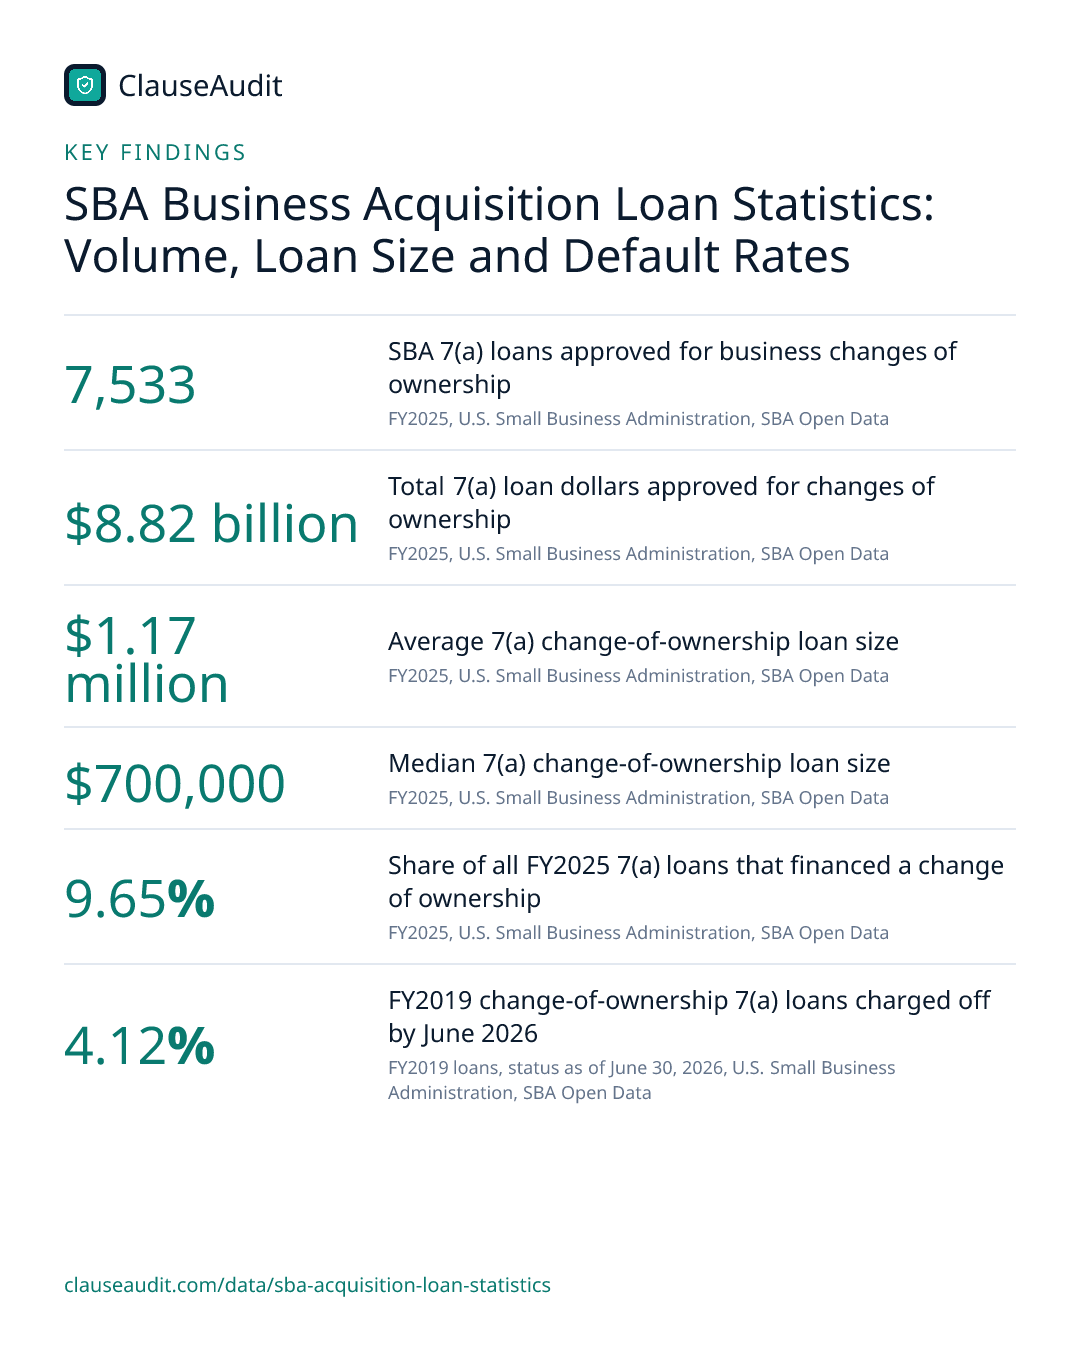
Business purchases take a big share of SBA 7(a) dollars. In FY2025 the SBA approved 7,533 change-of-ownership loans worth $8.82 billion, up from 6,054 loans in FY2024. The median deal was $700,000, and these loans have been charged off less often than other 7(a) loans.
- SBA 7(a) loans approved for business changes of ownership (FY2025, U.S. Small Business Administration, SBA Open Data)
- 7,533
- Total 7(a) loan dollars approved for changes of ownership (FY2025, U.S. Small Business Administration, SBA Open Data)
- $8.82 billion
- Average 7(a) change-of-ownership loan size (FY2025, U.S. Small Business Administration, SBA Open Data)
- $1.17 million
- Median 7(a) change-of-ownership loan size (FY2025, U.S. Small Business Administration, SBA Open Data)
- $700,000
- Share of all FY2025 7(a) loans that financed a change of ownership (FY2025, U.S. Small Business Administration, SBA Open Data)
- 9.65%
- FY2019 change-of-ownership 7(a) loans charged off by June 2026 (FY2019 loans, status as of June 30, 2026, U.S. Small Business Administration, SBA Open Data)
- 4.12%
- Total SBA 7(a) loans approved in FY2025, for $37 billion (FY2025, U.S. Small Business Administration)
- 77,600
- FY2025 change-of-ownership 7(a) loans to full-service restaurants, the top industry (FY2025, U.S. Small Business Administration, SBA Open Data)
- 433
When someone buys an existing small business in the US, there is a good chance an SBA 7(a) loan is paying for a large part of it. The SBA tags those loans as a "change of ownership," and its loan-level records let you count them, size them and see how they hold up over time.
We pulled every 7(a) record from the SBA's public files, as of June 30, 2026. The short version: FY2025 set the high mark for acquisition lending in this data, deals are much bigger than a typical 7(a) loan, and acquisition loans have been charged off less often than other 7(a) loans. Below, we explain what that means if you are about to buy a business, sell one, or sign the loan papers.
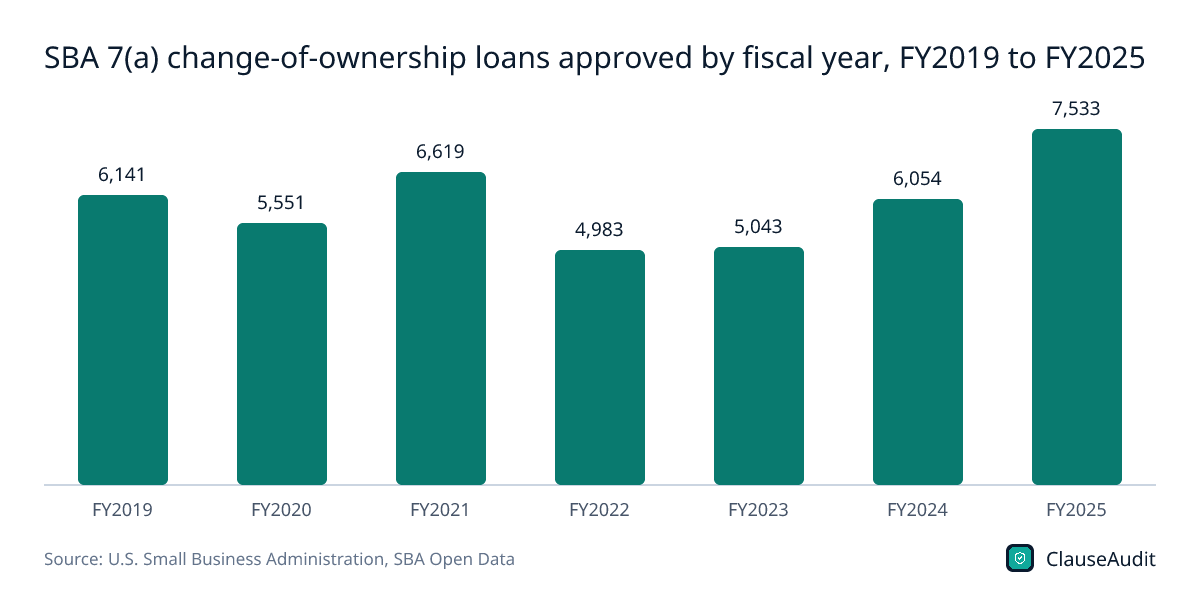
SBA 7(a) change-of-ownership loans approved by fiscal year, FY2019 to FY2025
Chart data
| Label | Value |
|---|---|
| FY2019 | 6,141 |
| FY2020 | 5,551 |
| FY2021 | 6,619 |
| FY2022 | 4,983 |
| FY2023 | 5,043 |
| FY2024 | 6,054 |
| FY2025 | 7,533 |
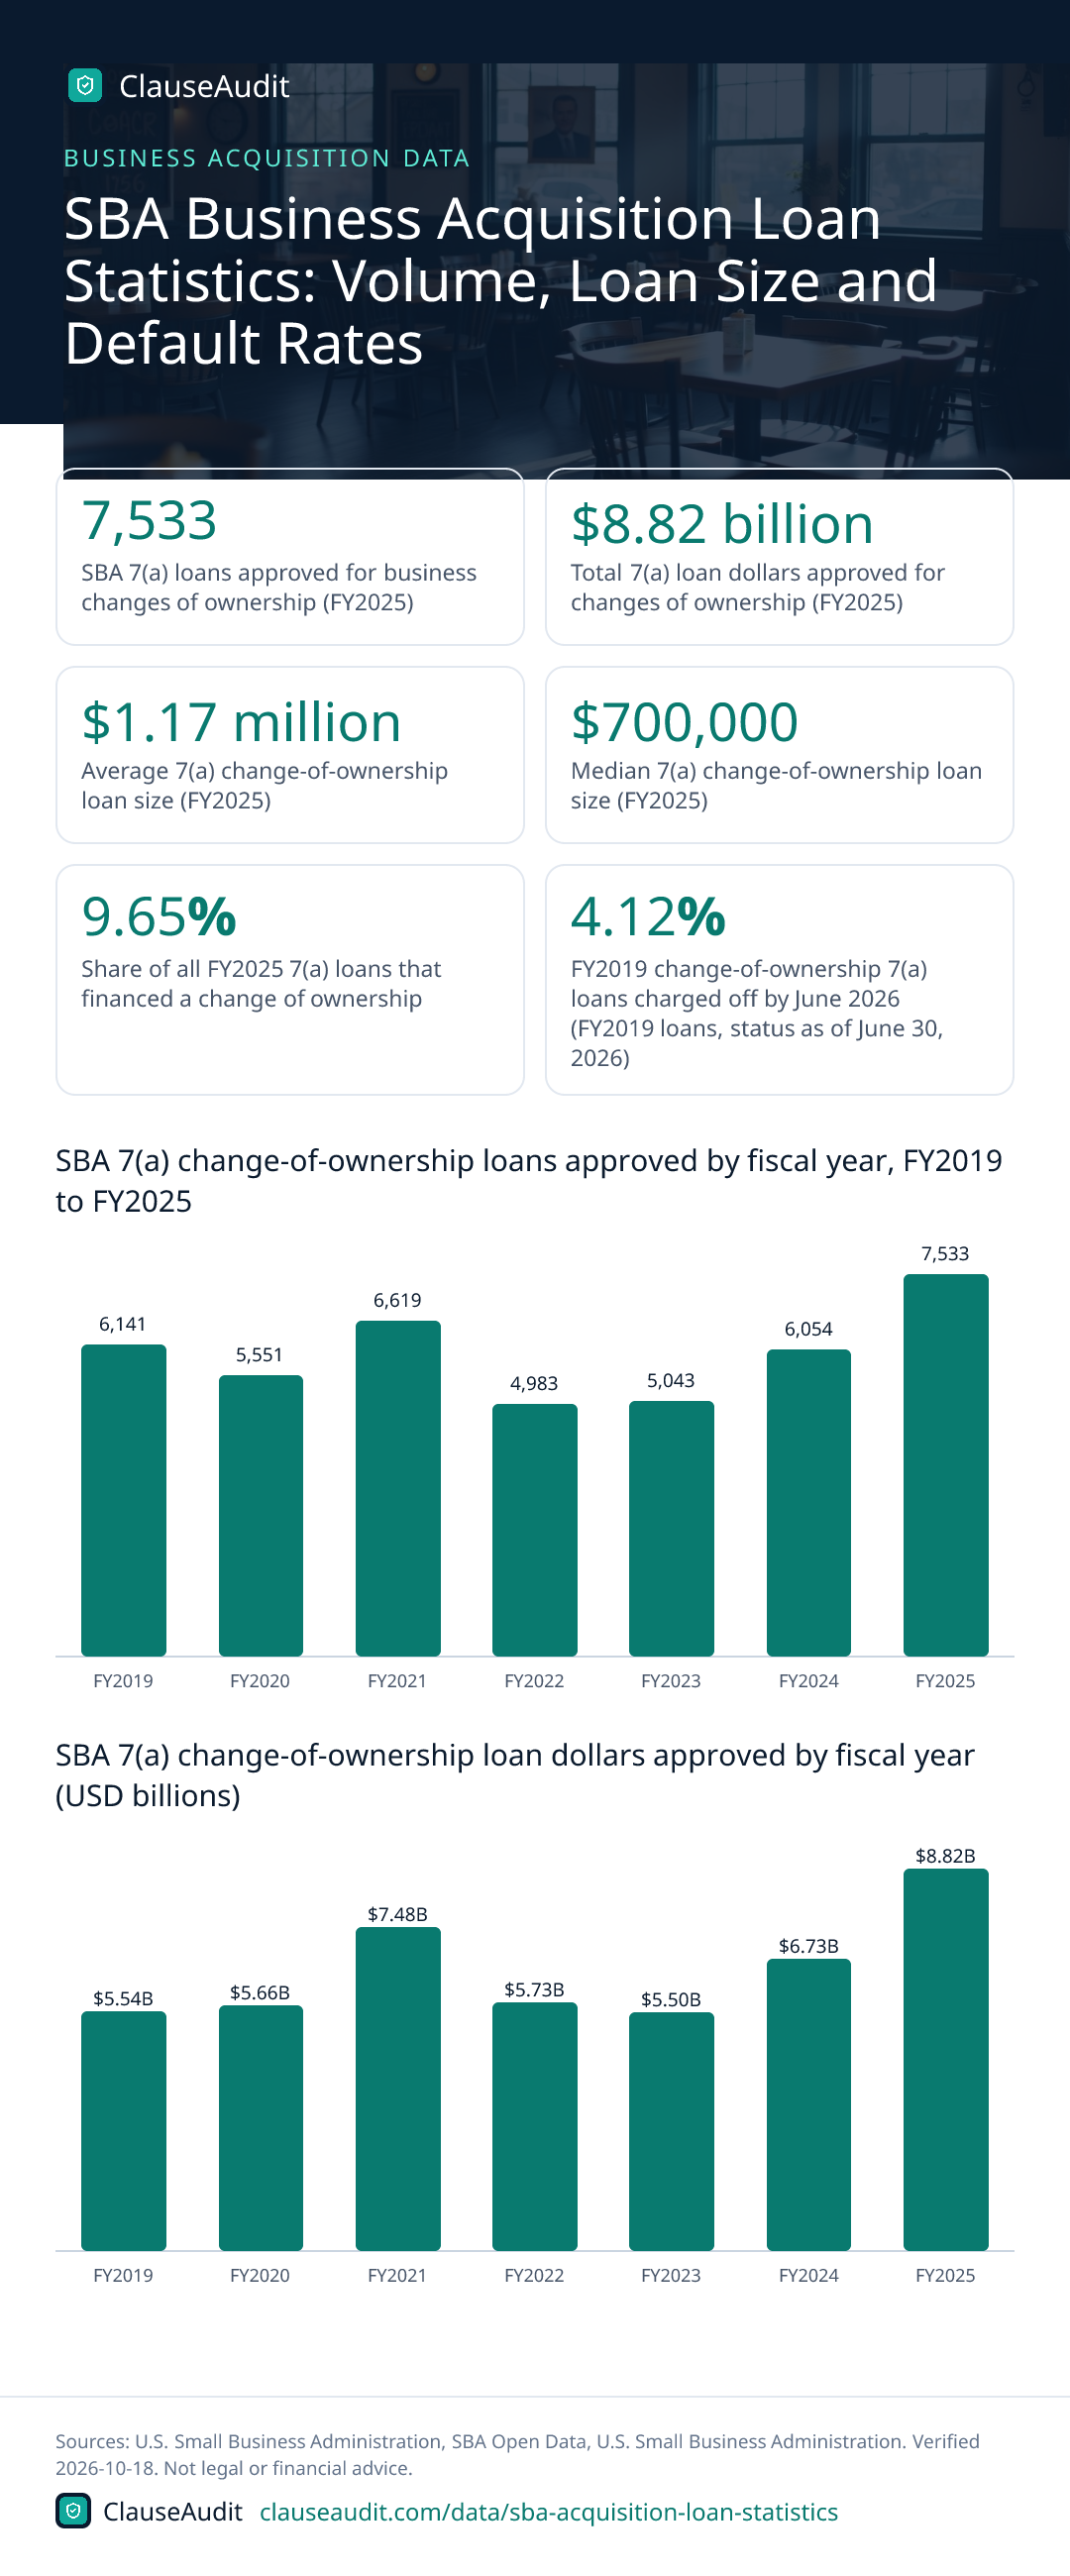
Volume dipped to 4,983 loans in FY2022 and then climbed for three straight years to 7,533 in FY2025. FY2026 already had 4,772 loans by June 30, 2026, with a quarter of the year still to go.
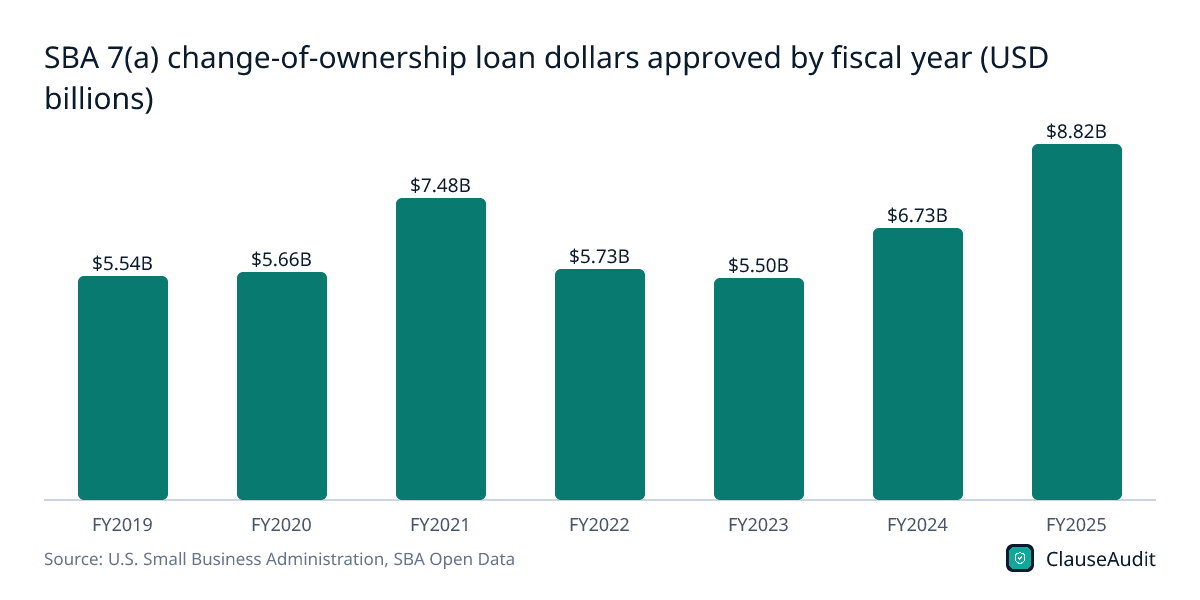
Download this chart (PNG)SBA 7(a) change-of-ownership loan dollars approved by fiscal year (USD billions)
Chart data
| Label | Value (USD billions) |
|---|---|
| FY2019 | $5.54B |
| FY2020 | $5.66B |
| FY2021 | $7.48B |
| FY2022 | $5.73B |
| FY2023 | $5.50B |
| FY2024 | $6.73B |
| FY2025 | $8.82B |
Dollars tracked the loan count but rose faster, from $5.50B in FY2023 to $8.82B in FY2025. More deals and slightly larger deals both pushed the total up.
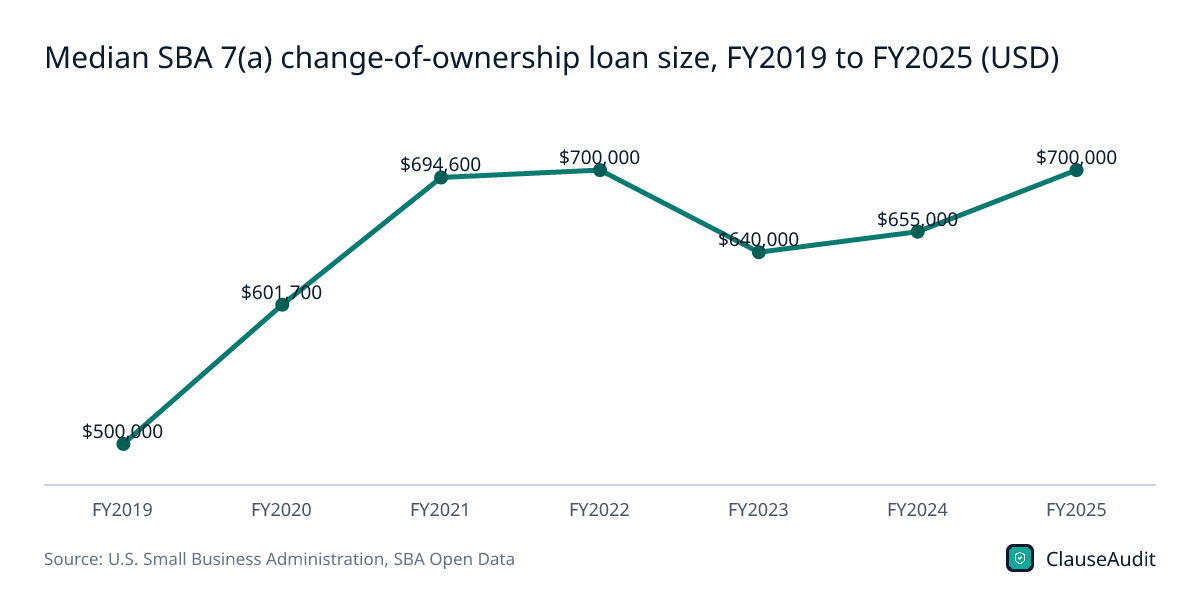
Download this chart (PNG)Median SBA 7(a) change-of-ownership loan size, FY2019 to FY2025 (USD)
Chart data
| Label | Value (USD) |
|---|---|
| FY2019 | $500,000 |
| FY2020 | $601,700 |
| FY2021 | $694,600 |
| FY2022 | $700,000 |
| FY2023 | $640,000 |
| FY2024 | $655,000 |
| FY2025 | $700,000 |
The median rose from $500,000 in FY2019 to $700,000 in FY2025. The average sits well above the median, at $1,170,807 in FY2025, because a smaller group of large deals pulls it up.
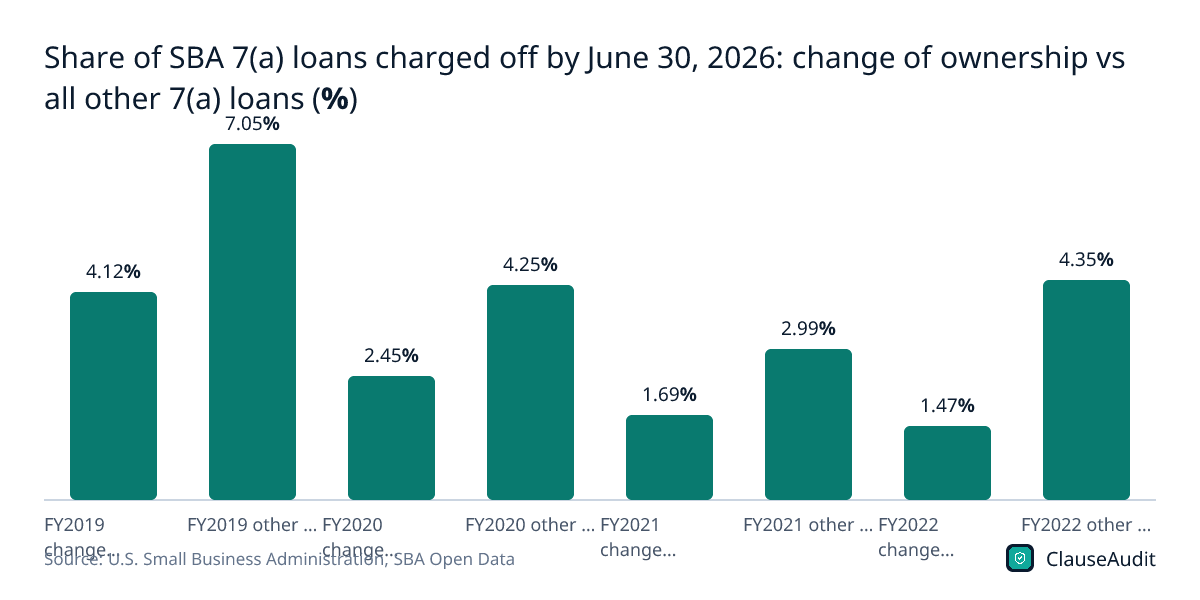
Download this chart (PNG)Share of SBA 7(a) loans charged off by June 30, 2026: change of ownership vs all other 7(a) loans (%)
Chart data
| Label | Value (%) |
|---|---|
| FY2019 change of ownership | 4.12% |
| FY2019 other 7(a) | 7.05% |
| FY2020 change of ownership | 2.45% |
| FY2020 other 7(a) | 4.25% |
| FY2021 change of ownership | 1.69% |
| FY2021 other 7(a) | 2.99% |
| FY2022 change of ownership | 1.47% |
| FY2022 other 7(a) | 4.35% |
In every year shown, acquisition loans were charged off at a lower rate than other 7(a) loans. Older years look worse partly because they have had more time to go bad, so compare bars within a year, not across years.
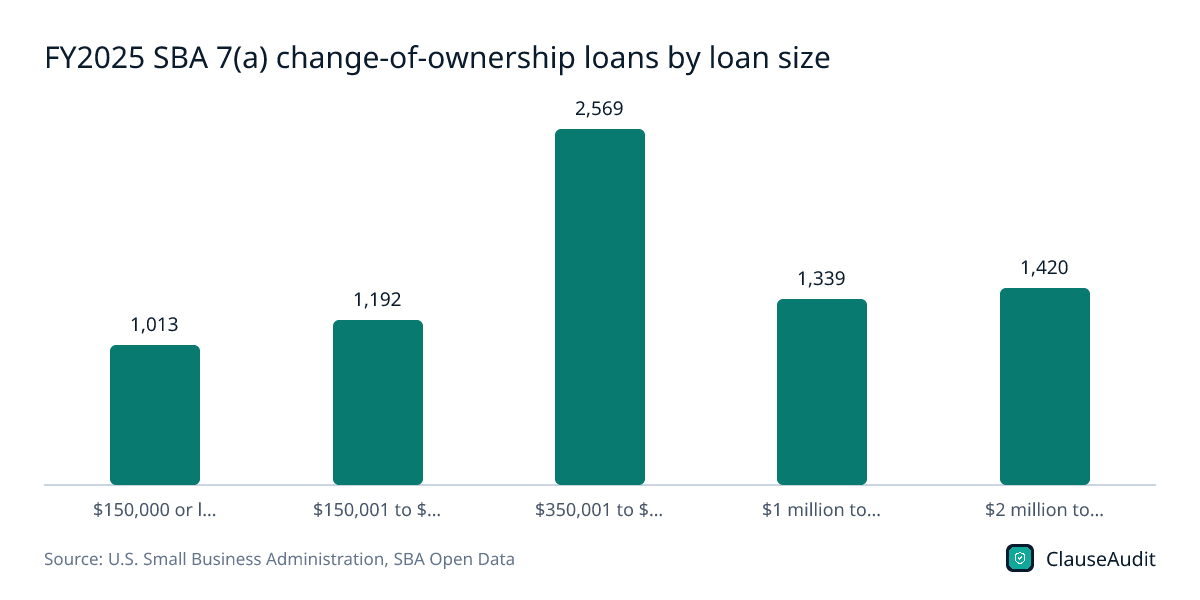
Download this chart (PNG)FY2025 SBA 7(a) change-of-ownership loans by loan size
Chart data
| Label | Value |
|---|---|
| $150,000 or less | 1,013 |
| $150,001 to $350,000 | 1,192 |
| $350,001 to $1 million | 2,569 |
| $1 million to $2 million | 1,339 |
| $2 million to $5 million | 1,420 |
The $350,001 to $1 million band holds 2,569 loans, the largest group. Still, 1,013 deals came in at $150,000 or less, so small purchases get financed too.
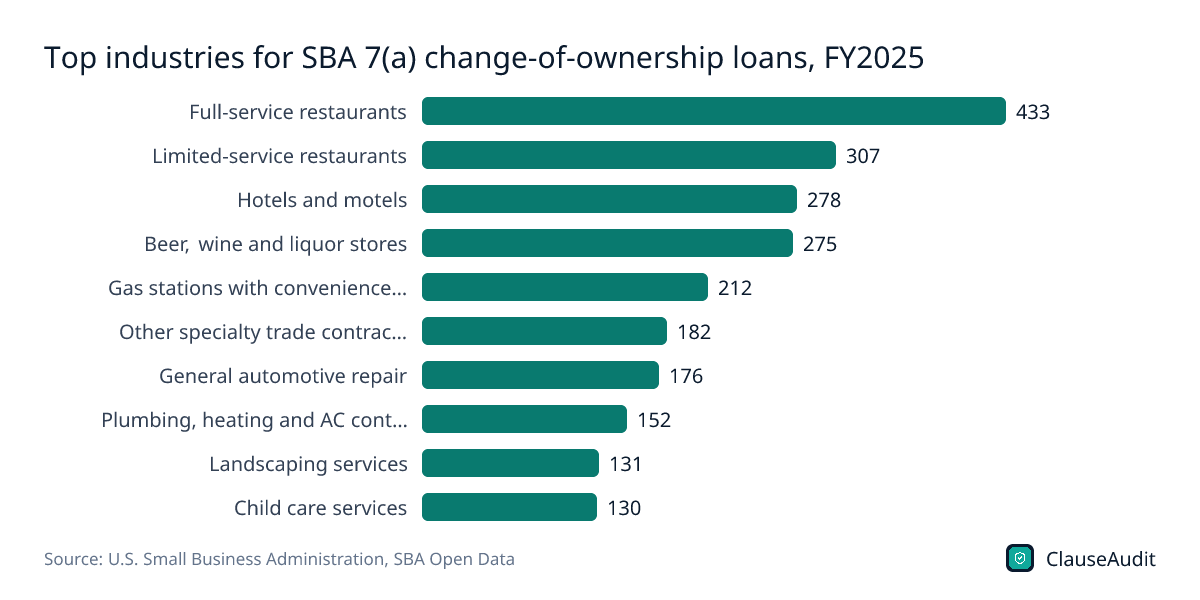
Download this chart (PNG)Top industries for SBA 7(a) change-of-ownership loans, FY2025
Chart data
| Label | Value |
|---|---|
| Full-service restaurants | 433 |
| Limited-service restaurants | 307 |
| Hotels and motels | 278 |
| Beer, wine and liquor stores | 275 |
| Gas stations with convenience stores | 212 |
| Other specialty trade contractors | 182 |
| General automotive repair | 176 |
| Plumbing, heating and AC contractors | 152 |
| Landscaping services | 131 |
| Child care services | 130 |
Restaurants lead, with 433 full-service and 307 limited-service loans. The list leans toward cash-flowing local businesses with real assets: hotels, liquor stores, gas stations and trade contractors.
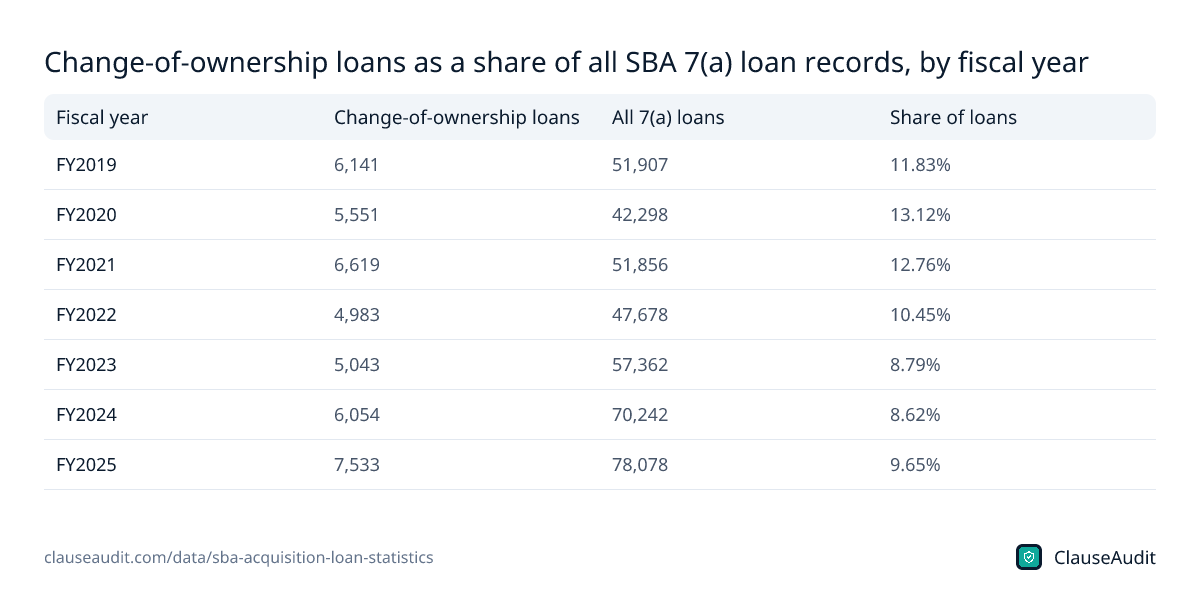
Download this chart (PNG)Change-of-ownership loans as a share of all SBA 7(a) loan records, by fiscal year
| Fiscal year | Change-of-ownership loans | All 7(a) loans | Share of loans |
|---|---|---|---|
| FY2019 | 6,141 | 51,907 | 11.83% |
| FY2020 | 5,551 | 42,298 | 13.12% |
| FY2021 | 6,619 | 51,856 | 12.76% |
| FY2022 | 4,983 | 47,678 | 10.45% |
| FY2023 | 5,043 | 57,362 | 8.79% |
| FY2024 | 6,054 | 70,242 | 8.62% |
| FY2025 | 7,533 | 78,078 | 9.65% |
Source: U.S. Small Business Administration, SBA Open Data, FOIA - 7(a) (FY2010-FY2019) loan-level data, as of June 30, 2026 (FOIA_7a_FY2010_FY2019_asof_260630.csv); U.S. Small Business Administration, SBA Open Data, FOIA - 7(a) (FY2020-Present) loan-level data, as of June 30, 2026 (FOIA_7a_FY2020_Present_asof_260630.csv). Download as image
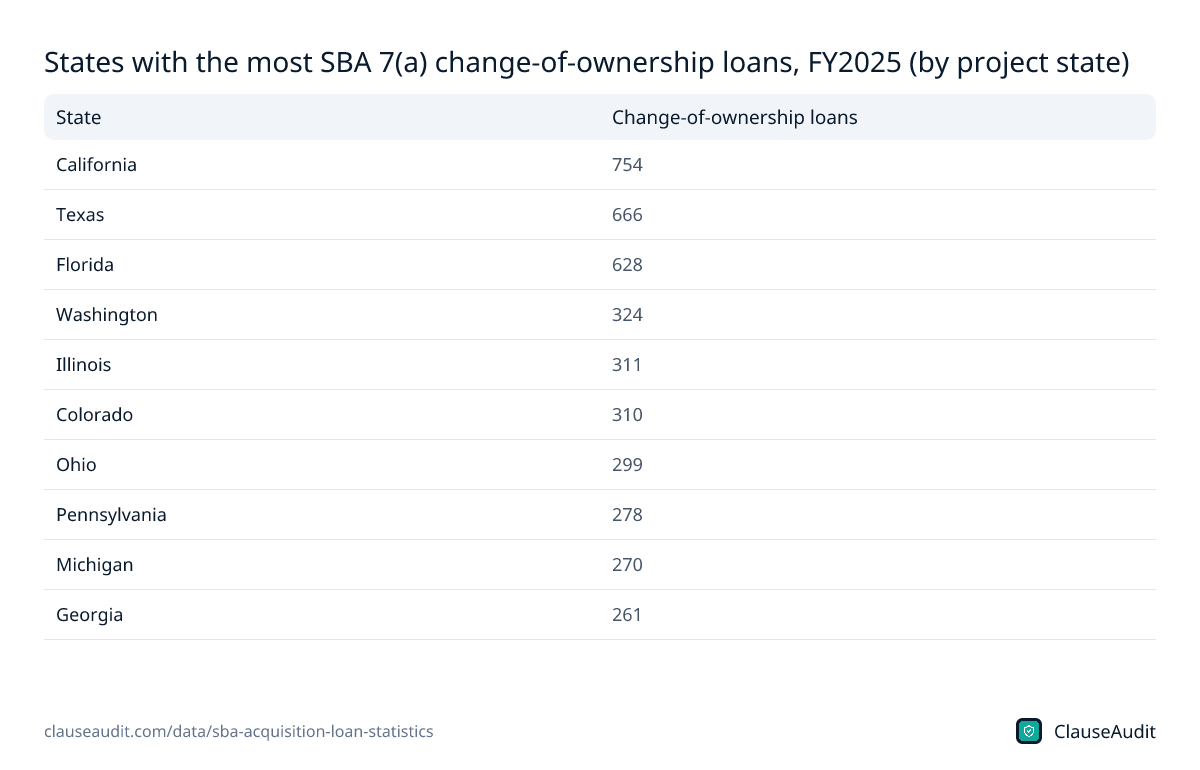
States with the most SBA 7(a) change-of-ownership loans, FY2025 (by project state)
| State | Change-of-ownership loans |
|---|---|
| California | 754 |
| Texas | 666 |
| Florida | 628 |
| Washington | 324 |
| Illinois | 311 |
| Colorado | 310 |
| Ohio | 299 |
| Pennsylvania | 278 |
| Michigan | 270 |
| Georgia | 261 |
Source: U.S. Small Business Administration, SBA Open Data, FOIA - 7(a) (FY2020-Present) loan-level data, as of June 30, 2026 (FOIA_7a_FY2020_Present_asof_260630.csv). Download as image
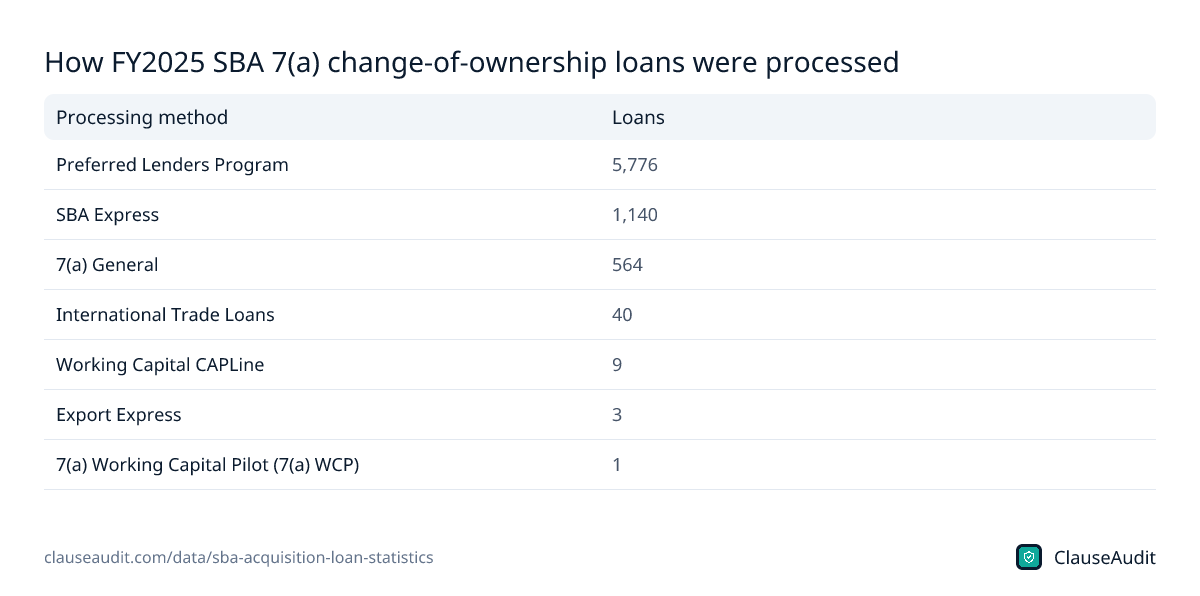
How FY2025 SBA 7(a) change-of-ownership loans were processed
| Processing method | Loans |
|---|---|
| Preferred Lenders Program | 5,776 |
| SBA Express | 1,140 |
| 7(a) General | 564 |
| International Trade Loans | 40 |
| Working Capital CAPLine | 9 |
| Export Express | 3 |
| 7(a) Working Capital Pilot (7(a) WCP) | 1 |
Source: U.S. Small Business Administration, SBA Open Data, FOIA - 7(a) (FY2020-Present) loan-level data, as of June 30, 2026 (FOIA_7a_FY2020_Present_asof_260630.csv). Download as image
How many SBA loans are used to buy a business?
In FY2025 the SBA approved 7,533 7(a) loans coded as a change of ownership. That is 9.65% of the 78,078 7(a) loan records for the year. By dollars the share is much bigger: 23.7%, or $8.82 billion of $37.29 billion. Acquisition loans are a small share of the count and a large share of the money.
That gap makes sense. Most 7(a) loans fund working capital, equipment or an expansion, and the median FY2025 7(a) loan was only $166,850. Buying a whole company costs more, so the median change-of-ownership loan was $700,000.
The share of 7(a) loans going to acquisitions has actually fallen since the pandemic years, from 13.12% in FY2020 to 9.65% in FY2025. That is not because fewer people are buying businesses. Overall 7(a) lending grew faster, from 42,298 records in FY2020 to 78,078 in FY2025. Acquisition volume rose too, just not as quickly.
One caution on the count. It includes 665 FY2025 loans that were later cancelled, so the number of deals that actually closed is somewhat lower. The trend still holds. FY2025 was the busiest year in the series, and FY2026 was running strong at 4,772 loans by June 30, 2026.
What is the average SBA loan size for a business acquisition?
The average FY2025 change-of-ownership loan was $1.17 million. The median was $700,000. When the average sits that far above the middle, it tells you a minority of large deals is lifting the mean. If you want a sense of what a typical buyer borrows, use the median.
The spread is wide. In FY2025, 1,013 loans were $150,000 or less, and 1,420 were above $2 million. Picture two buyers. One takes over a landscaping route with a few trucks and a client list. The other buys a hotel. Both can end up with a 7(a) loan, on very different terms and with very different paperwork.
Size matters for your documents. A bigger loan usually means more collateral, a closer look at the seller's books, and more pressure to make the purchase agreement airtight, because the lender reads it too.
Do SBA acquisition loans default more than other SBA loans?
Based on our count, no. Of the FY2019 change-of-ownership loans that were not cancelled, 232 of 5,634, or 4.12%, had been charged off by June 30, 2026. For all other FY2019 7(a) loans the figure was 7.05%. The same pattern shows up for FY2020, FY2021 and FY2022.
Two things likely explain it. A going concern comes with customers, staff and a track record, so the buyer is not starting from zero. And lenders underwrite the deal against the seller's actual cash flow, not a projection.
Read these numbers as a cumulative charge-off share, not the SBA's official default or loss rate. They also count only loans that ended up written off. Plenty of buyers who never reach that point still go through hard years, renegotiate, or sell at a loss. A low failure rate across thousands of loans says little about whether your deal is priced right.
Which businesses get bought with SBA loans?
Full-service restaurants topped the FY2025 list with 433 loans, followed by limited-service restaurants at 307, hotels and motels at 278, and beer, wine and liquor stores at 275. Gas stations with convenience stores, specialty trade contractors, auto repair shops, plumbing and HVAC contractors, landscapers and child care centers fill out the top ten.
These are local, owner-run businesses with steady demand. They also tend to come with a lease, licenses and key employees, each of which has to transfer cleanly. A liquor license that cannot move to the new owner, or a landlord who refuses to consent to an assignment, can stall a closing that the bank has already approved.
If you are buying in one of these industries, expect the lender to know the sector well. Banks that do many restaurant or hotel deals have set views on rent as a share of sales, franchise approvals and equipment age. Use that. Ask your loan officer what usually goes wrong in deals like yours, then check that your purchase agreement covers it.
Where and how these loans get made
California led FY2025 with 754 acquisition loans, followed by Texas at 666 and Florida at 628. Most deals went through lenders in the Preferred Lenders Program, 5,776 of 7,533, which lets an experienced bank make the credit decision itself instead of waiting for the SBA to review the file. Another 1,140 used SBA Express.
For you, that means the lender's own credit team will make most of the decisions. It is worth asking early what they need from the purchase agreement, the seller and any seller note, so your contract is drafted to fit the loan instead of being rewritten a week before closing.
Speed has a cost. A Preferred Lender can move fast, and sellers like that. But a fast lender also means less time for you to read the purchase agreement, the seller note and the guarantee before closing. Build that review time into your letter of intent rather than hoping to find it later.
What to do before you sign
- Get the loan commitment letter in writing and compare every condition in it against your purchase agreement. Mismatches cause delays.
- Ask the lender how any seller note must be structured, including whether payments to the seller have to pause while the bank loan is outstanding.
- Expect a personal guarantee from each major owner, and find out which personal assets, like a home, will be pledged.
- Confirm the lease can be assigned to you, or negotiate a new one, before the closing date.
- Make sure the seller's non-compete and transition help are written into the deal, with a clear length and area.
- Line up the representations and warranties with what you saw in due diligence, and set out how you can recover if they turn out false.
How ClauseAudit helps
An SBA loan pays for the business, but your purchase agreement decides what you actually get for it. Lenders review that agreement, and so should you, clause by clause, before the commitment letter deadline.
Upload your letter of intent or purchase agreement and our business purchase review flags terms that commonly cause trouble for buyers using SBA financing.
- Purchase price, allocation and any working capital or inventory adjustment
- Seller note terms, including standby and subordination to the bank loan
- Seller non-compete and non-solicit: length, area and what it covers
- Representations, warranties and indemnification, with caps and survival periods
- Lease assignment and landlord consent as a closing condition
- Personal guarantee and collateral language that reaches your personal assets
Frequently asked questions
How many SBA 7(a) loans were approved in FY2025?
The SBA reported about 77,600 7(a) loans for $37 billion in FY2025. Its loan-level file, as of June 30, 2026, lists 78,078 FY2025 records totaling $37.29 billion. The SBA figure is rounded, and the file also reflects records added or adjusted after the year-end announcement.
How many SBA loans went to buying a business in FY2025?
We counted 7,533 7(a) loans coded as a change of ownership in FY2025, worth $8.82 billion. That count includes 665 loans later cancelled. It is up from 6,054 loans in FY2024 and is the highest year in the data we reviewed. FY2026 had 4,772 loans by June 30, 2026.
What is the typical SBA loan amount to buy a business?
The median FY2025 change-of-ownership loan was $700,000 and the average was $1.17 million. The median is the better guide for a typical deal. The most common size band was $350,001 to $1 million, with 2,569 loans. In all, 1,013 FY2025 deals were $150,000 or less.
Is an SBA acquisition loan riskier than other SBA loans?
Not in the data. Among FY2019 loans, 4.12% of change-of-ownership loans had been charged off by June 30, 2026, against 7.05% for other 7(a) loans. Later years show the same gap. These are our cumulative counts, not the SBA's official default rate.
What share of SBA 7(a) money goes to business purchases?
In FY2025, change-of-ownership loans were 9.65% of 7(a) loans by count but 23.7% by dollars. Acquisitions are fewer than other 7(a) loans, but each one is much larger, so they take a big piece of the program's money. That is $8.82 billion out of $37.29 billion.
Which industries use SBA loans to buy businesses most?
Full-service restaurants led FY2025 with 433 loans. Limited-service restaurants had 307, hotels and motels 278, and beer, wine and liquor stores 275. Gas stations, auto repair, trade contractors, landscapers and child care centers also ranked in the top ten, all businesses with steady local demand.
Which states have the most SBA acquisition loans?
By project state, California led FY2025 with 754 change-of-ownership loans. Texas had 666 and Florida had 628. Washington followed with 324, then Illinois with 311 and Colorado with 310. Ohio, Pennsylvania, Michigan and Georgia round out the top ten.
Does the seller have to sign anything for an SBA loan?
The seller signs the purchase agreement, and often a non-compete, a transition services agreement and, if they carry part of the price, a seller note. Lenders commonly set rules on how that seller note is paid. Read those terms closely, since they affect both sides.
Use this data
Every chart and card below is free to reuse under CC BY 4.0. Download what you need and link back to this page.
 Stat cards
 Key findings card
 Infographic
 SBA 7(a) change-of-ownership loans approved by fiscal year, FY2019 to FY2025
 SBA 7(a) change-of-ownership loan dollars approved by fiscal year (USD billions)
 Median SBA 7(a) change-of-ownership loan size, FY2019 to FY2025 (USD)
 Share of SBA 7(a) loans charged off by June 30, 2026: change of ownership vs all other 7(a) loans (%)
 FY2025 SBA 7(a) change-of-ownership loans by loan size
 Top industries for SBA 7(a) change-of-ownership loans, FY2025
 Change-of-ownership loans as a share of all SBA 7(a) loan records, by fiscal year
 States with the most SBA 7(a) change-of-ownership loans, FY2025 (by project state)
 How FY2025 SBA 7(a) change-of-ownership loans were processed
Embed the infographic
Free to share on your site, blog or slides under CC BY 4.0. Please keep the credit link.
Sources and method
Every number on this page comes from the sources below, each opened and read on or before October 18, 2026. A second, independent review checked every figure against its source and corrected anything that did not match. Figures that could not be confirmed were left out.
- U.S. Small Business Administration, SBA Open Data, FOIA - 7(a) (FY2020-Present) loan-level data, as of June 30, 2026 (FOIA_7a_FY2020_Present_asof_260630.csv) (As of June 30, 2026 (file posted July 21, 2026))
- U.S. Small Business Administration, SBA Open Data, FOIA - 7(a) (FY2010-FY2019) loan-level data, as of June 30, 2026 (FOIA_7a_FY2010_FY2019_asof_260630.csv) (As of June 30, 2026 (file posted July 21, 2026))
- U.S. Small Business Administration, SBA Open Data, 7(a) and 504 FOIA data dictionary (July 2026)
- U.S. Small Business Administration, Trump SBA Delivers Record Capital to Small Businesses in FY25 (September 30, 2025)
Cite this page
ClauseAudit, “SBA Business Acquisition Loan Statistics: Volume, Loan Size and Default Rates”, updated October 18, 2026, https://clauseaudit.com/data/sba-acquisition-loan-statistics. Free to reuse with a link back (CC BY 4.0).
This page summarises published data and law as checked on October 18, 2026. Figures are updated as new editions are released, and your own situation may differ. It is general information, not legal, tax or financial advice.