Small Business Sale Statistics 2026: Deals Closed, Prices, Multiples and Who Buys
By ClauseAudit Research · 10 sources ·
What do the latest small business sales statistics show?
Small business sales are steady, not booming. Brokers reported 9,586 closed deals in 2025, up 0.4% on 2024, at a median price of $350,000 and an average 2.61x cash flow multiple. In Q3 2026, 2,132 businesses sold, down 7% year over year, while the median price held at $350,000.
- Small businesses sold in 2025 (closed deals reported to BizBuySell) (2025, BizBuySell (CoStar Group))
- 9,586
- Businesses that changed hands in Q3 2026, down 7% year over year (Q3 2026, BizBuySell (CoStar Group))
- 2,132
- Median sale price of small businesses sold in Q3 2026 (Q3 2026, BizBuySell (CoStar Group))
- $350,000
- Average cash flow multiple paid for small businesses sold in 2025 (2025, BizBuySell (CoStar Group))
- 2.61x
- Share of asking price that sold businesses fetched on average in 2025 (2025, BizBuySell (CoStar Group))
- 94%
- Share of Q3 2026 deals priced above $1 million, a record high (Q3 2026, BizBuySell (CoStar Group))
- 22%
- Business buyers who describe themselves as corporate professionals (Q3 2026, BizBuySell (CoStar Group))
- 51%
- Buyers who expect to use SBA financing to complete an acquisition (Q3 2026, BizBuySell (CoStar Group))
- 78%
Most small businesses that sell are ordinary companies: a plumbing outfit, a dental lab, a neighborhood bakery. They sell for a few hundred thousand dollars, take months to close, and usually go to a buyer who borrows most of the money.
The figures on this page come from BizBuySell's reports on closed deals that brokers submit. That makes them one of the most widely cited reads on the Main Street market, though not a count of every sale in the country. Below we explain what the prices and multiples mean in practice, who is buying, and what to look for in the purchase agreement before you sign.
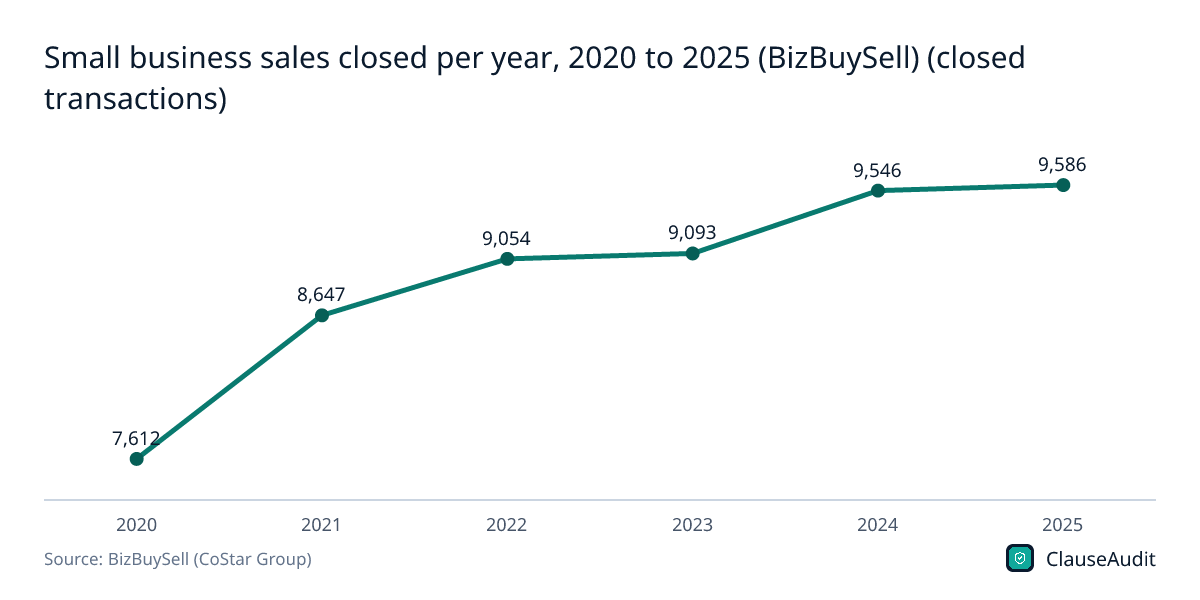
Small business sales closed per year, 2020 to 2025 (BizBuySell) (closed transactions)
Chart data
| Label | Value (closed transactions) |
|---|---|
| 2020 | 7,612 |
| 2021 | 8,647 |
| 2022 | 9,054 |
| 2023 | 9,093 |
| 2024 | 9,546 |
| 2025 | 9,586 |
Deal volume climbed from 7,612 in 2020 to 9,586 in 2025, but growth has slowed since 2022, and 2025 was nearly flat with 2024. The market is busy, not overheated.
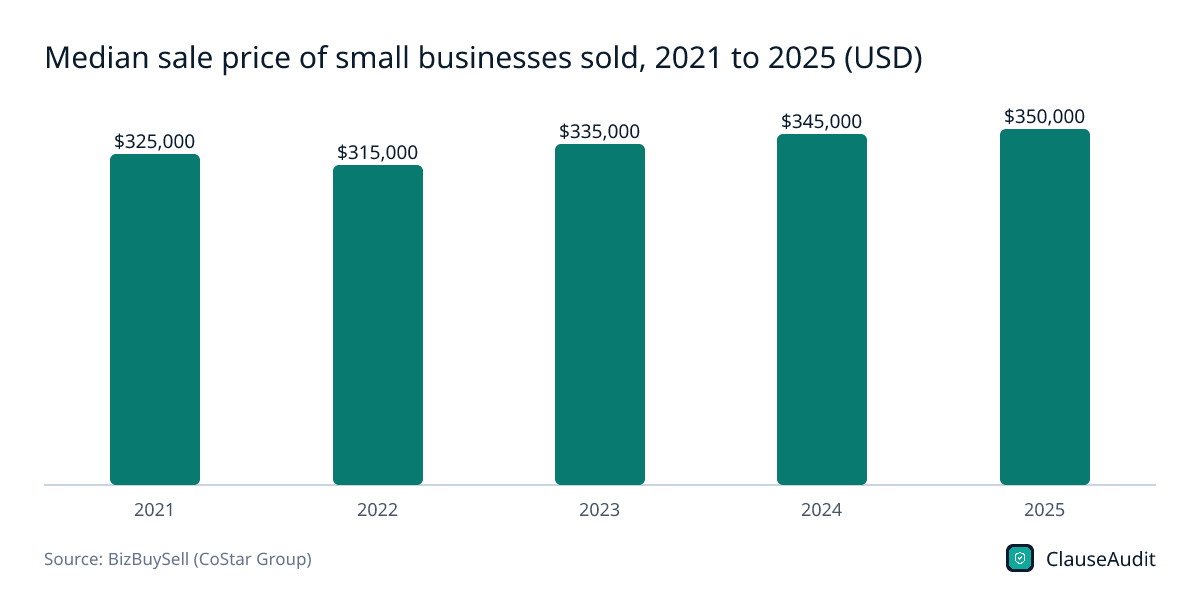
Download this chart (PNG)Median sale price of small businesses sold, 2021 to 2025 (USD)
Chart data
| Label | Value (USD) |
|---|---|
| 2021 | $325,000 |
| 2022 | $315,000 |
| 2023 | $335,000 |
| 2024 | $345,000 |
| 2025 | $350,000 |
The median moved from $325,000 in 2021 to $350,000 in 2025, a slow rise. A typical deal is still well within reach of a buyer using an SBA loan.
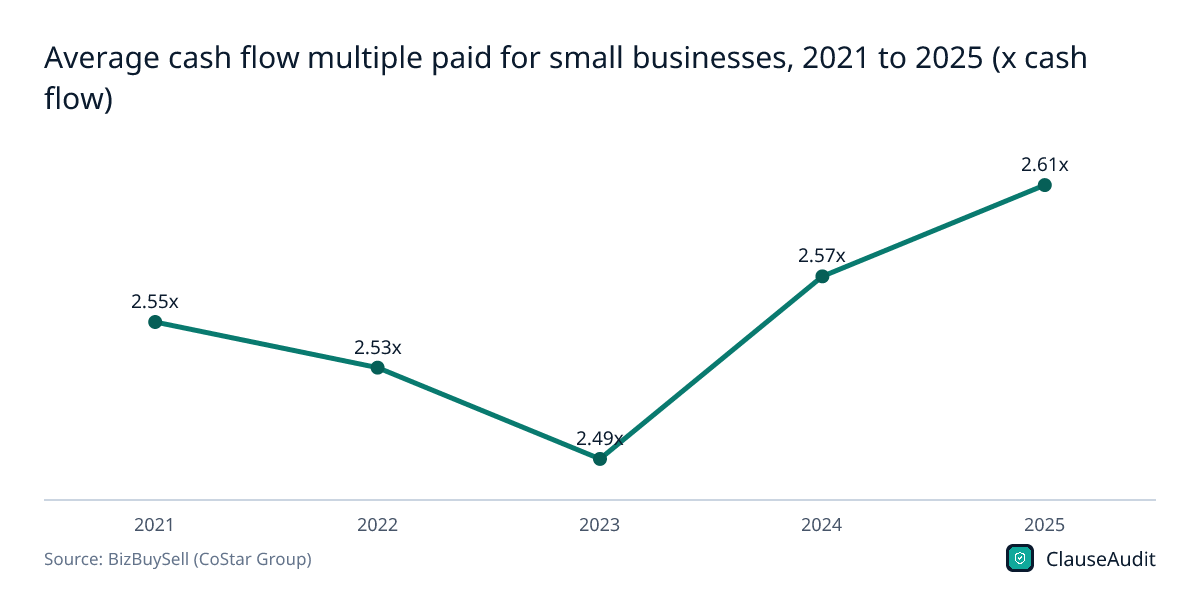
Download this chart (PNG)Average cash flow multiple paid for small businesses, 2021 to 2025 (x cash flow)
Chart data
| Label | Value (x cash flow) |
|---|---|
| 2021 | 2.55x |
| 2022 | 2.53x |
| 2023 | 2.49x |
| 2024 | 2.57x |
| 2025 | 2.61x |
Multiples dipped to 2.49x in 2023 and recovered to 2.61x in 2025. Buyers are paying a little more per dollar of earnings, not a lot more.
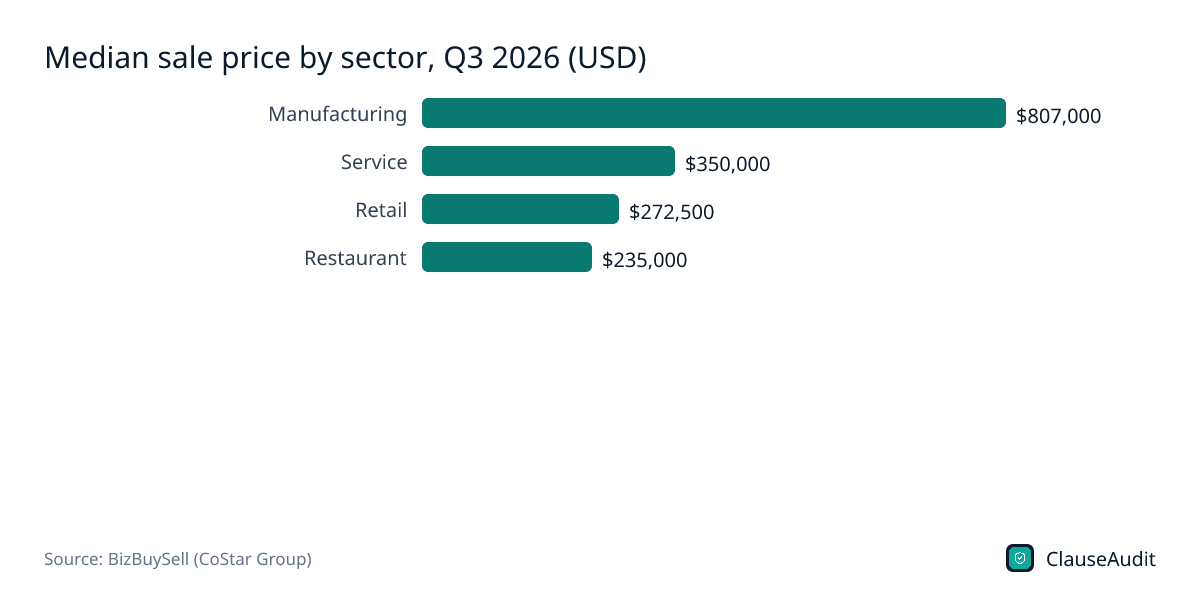
Download this chart (PNG)Median sale price by sector, Q3 2026 (USD)
Chart data
| Label | Value |
|---|---|
| Manufacturing | $807,000 |
| Service | $350,000 |
| Retail | $272,500 |
| Restaurant | $235,000 |
Manufacturing sold for a median of $807,000, against a restaurant median of $235,000. Compare any asking price against its own sector, not the overall market.
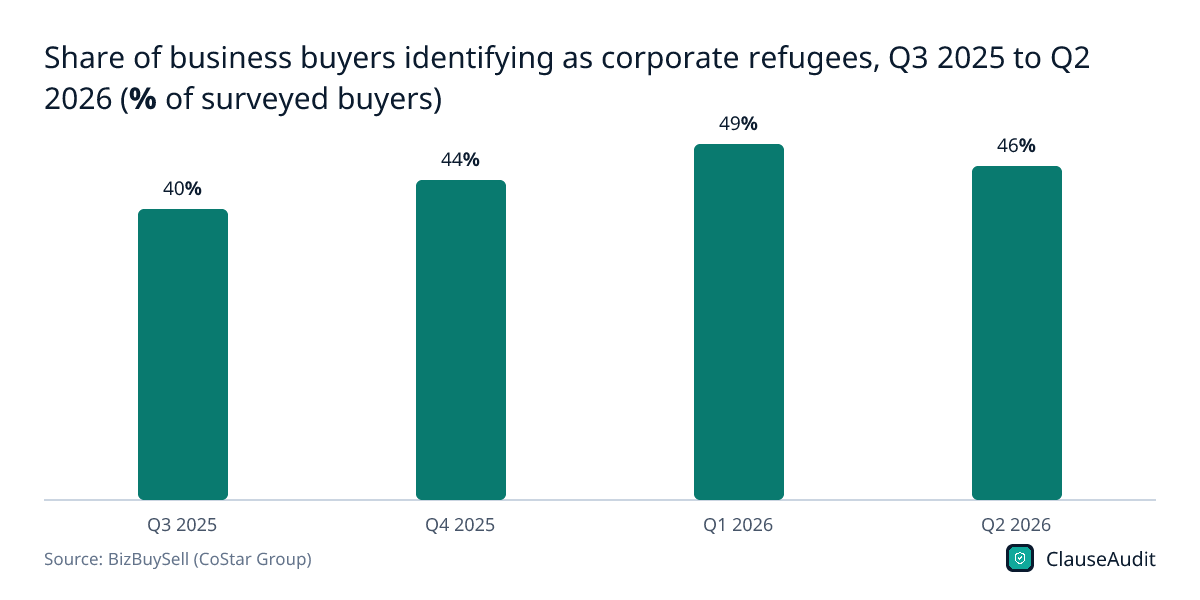
Download this chart (PNG)Share of business buyers identifying as corporate refugees, Q3 2025 to Q2 2026 (% of surveyed buyers)
Chart data
| Label | Value (% of surveyed buyers) |
|---|---|
| Q3 2025 | 40% |
| Q4 2025 | 44% |
| Q1 2026 | 49% |
| Q2 2026 | 46% |
The share of buyers coming out of corporate jobs rose from 40% to 49% before easing to 46% in Q2 2026. Many of these buyers are leaving salaried careers, so they are buying a job as much as a business.
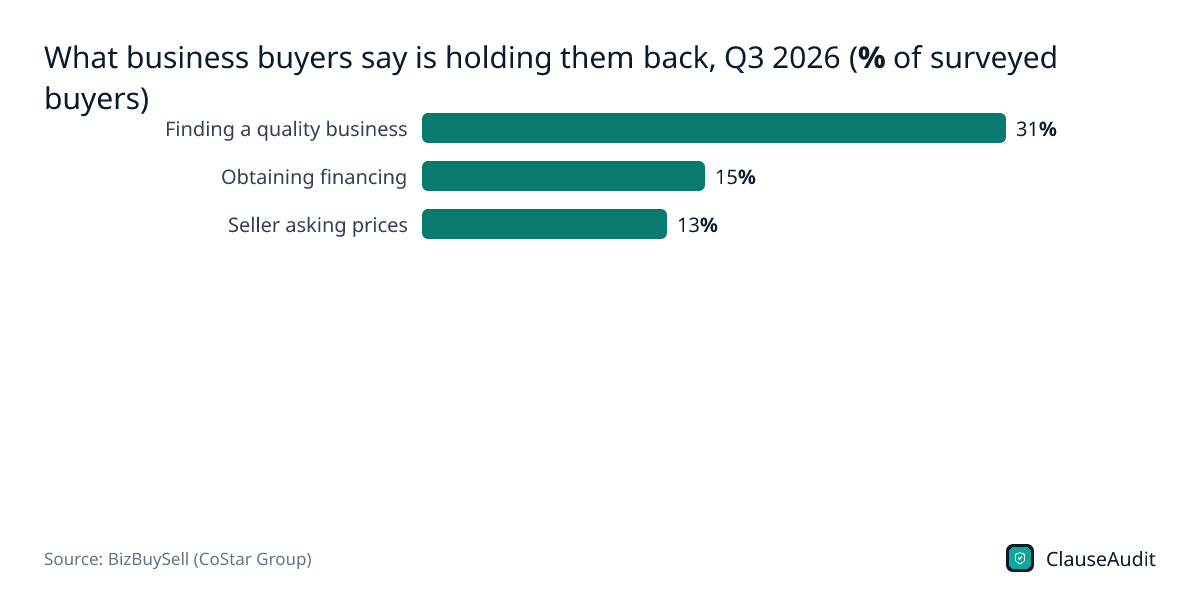
Download this chart (PNG)What business buyers say is holding them back, Q3 2026 (% of surveyed buyers)
Chart data
| Label | Value |
|---|---|
| Finding a quality business | 31% |
| Obtaining financing | 15% |
| Seller asking prices | 13% |
Finding a quality business is the top complaint at 31%, ahead of financing at 15% and asking prices at 13%. Good companies are scarce, which gives sellers of clean businesses more room to bargain on terms.
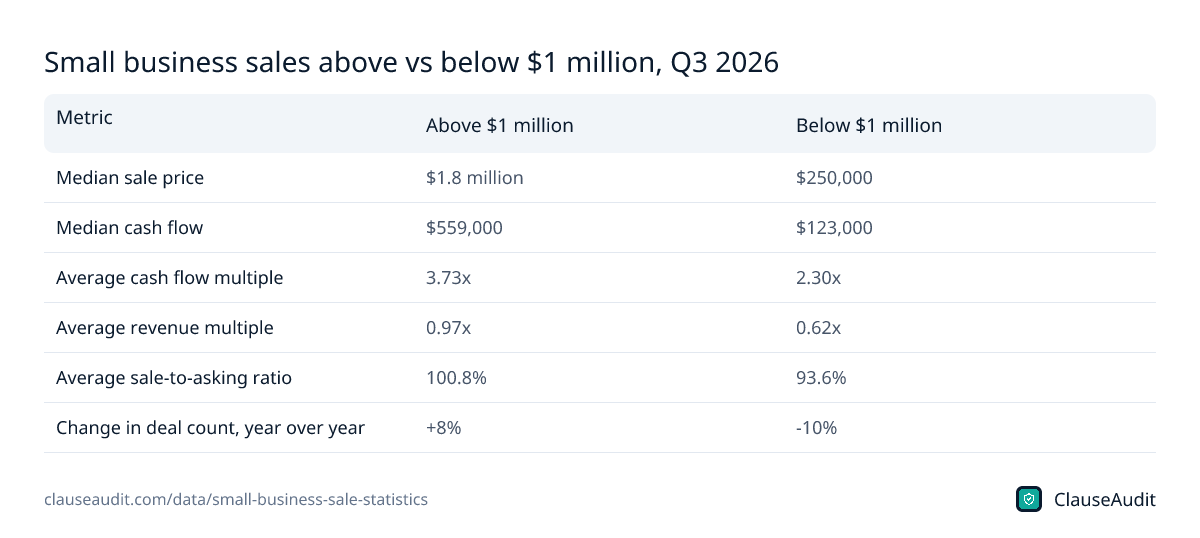
Download this chart (PNG)Small business sales above vs below $1 million, Q3 2026
| Metric | Above $1 million | Below $1 million |
|---|---|---|
| Median sale price | $1.8 million | $250,000 |
| Median cash flow | $559,000 | $123,000 |
| Average cash flow multiple | 3.73x | 2.30x |
| Average revenue multiple | 0.97x | 0.62x |
| Average sale-to-asking ratio | 100.8% | 93.6% |
| Change in deal count, year over year | +8% | -10% |
Source: BizBuySell (CoStar Group), BizBuySell Insight Report, Q3 2026: Q3 Business Sales Hold Steady as Market Selectivity Intensifies. Download as image
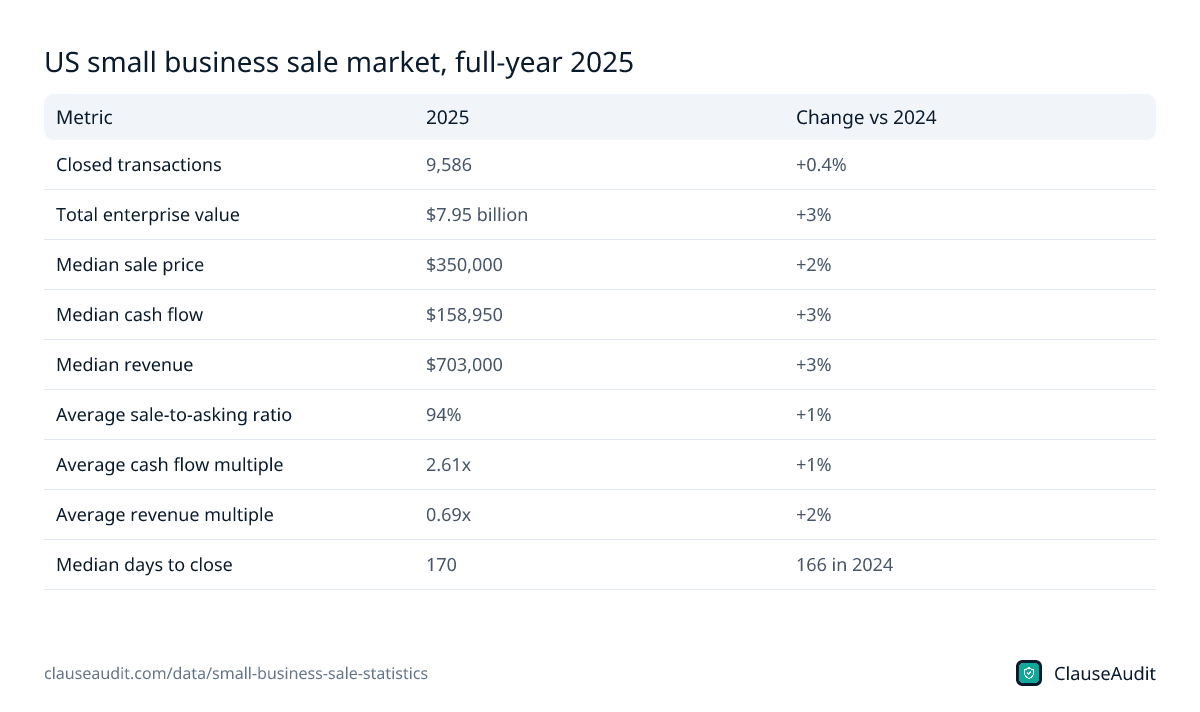
US small business sale market, full-year 2025
| Metric | 2025 | Change vs 2024 |
|---|---|---|
| Closed transactions | 9,586 | +0.4% |
| Total enterprise value | $7.95 billion | +3% |
| Median sale price | $350,000 | +2% |
| Median cash flow | $158,950 | +3% |
| Median revenue | $703,000 | +3% |
| Average sale-to-asking ratio | 94% | +1% |
| Average cash flow multiple | 2.61x | +1% |
| Average revenue multiple | 0.69x | +2% |
| Median days to close | 170 | 166 in 2024 |
Source: BizBuySell (CoStar Group), 2025 Year in Review: BizBuySell Market Recap. Download as image
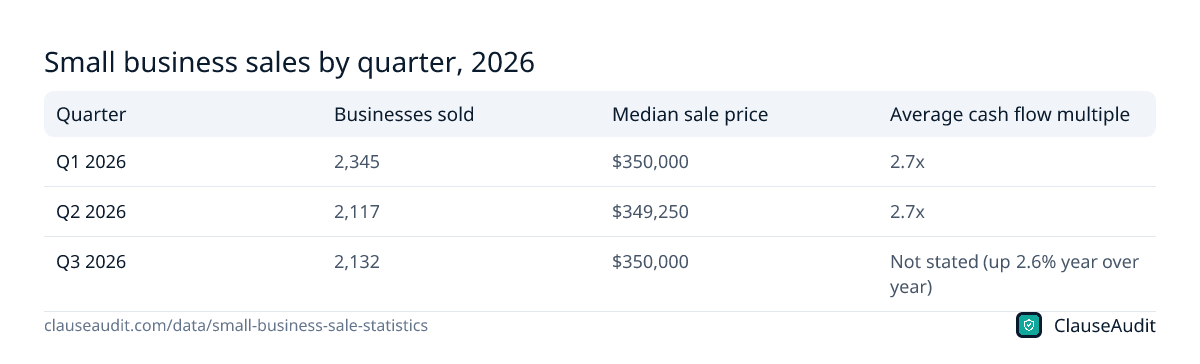
Small business sales by quarter, 2026
| Quarter | Businesses sold | Median sale price | Average cash flow multiple |
|---|---|---|---|
| Q1 2026 | 2,345 | $350,000 | 2.7x |
| Q2 2026 | 2,117 | $349,250 | 2.7x |
| Q3 2026 | 2,132 | $350,000 | Not stated (up 2.6% year over year) |
Source: BizBuySell (CoStar Group), BizBuySell Insight Report, Q1 2026; BizBuySell (CoStar Group), BizBuySell Insight Report, Q2 2026; BizBuySell (CoStar Group), BizBuySell Insight Report, Q3 2026: Q3 Business Sales Hold Steady as Market Selectivity Intensifies. Download as image
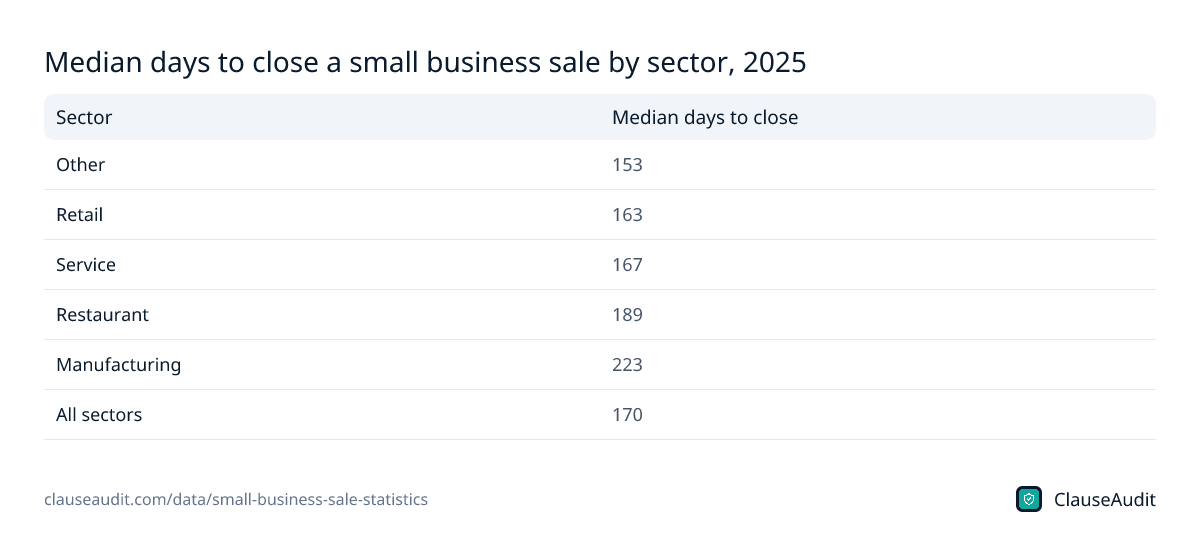
Median days to close a small business sale by sector, 2025
| Sector | Median days to close |
|---|---|
| Other | 153 |
| Retail | 163 |
| Service | 167 |
| Restaurant | 189 |
| Manufacturing | 223 |
| All sectors | 170 |
Source: BizBuySell (CoStar Group), 2025 Year in Review: BizBuySell Market Recap. Download as image
How many small businesses sell each year?
Brokers reported 9,586 closed small business sales to BizBuySell in 2025, up 0.4% on 2024. Total enterprise value came to $7.95 billion. That is a large sample, but it only covers deals that went through brokers who chose to report them. Plenty of family handoffs, partner buyouts and private sales never show up.
The trend matters more than the total. Volume grew quickly after 2020, then slowed. From 2022 to 2025 it rose about 6% in total. In 2026 the quarterly counts were 2,345, then 2,117, then 2,132 in Q3, which was down 7% from a year earlier.
Look inside that drop and the market splits in two. Deals above $1 million rose 8% year over year in Q3 2026, while deals below $1 million fell 10%. Bigger, steadier companies are still finding buyers. Smaller ones with thin books or a single owner holding every customer relationship are having a harder time.
What do small businesses sell for, and what multiple is normal?
The median sale price was $350,000 in 2025 and again in Q3 2026. In 2025 the median cash flow of businesses sold was $158,950 and the median revenue was $703,000. Buyers paid an average of 2.61x cash flow and 0.69x revenue.
Cash flow here means seller's discretionary earnings, or SDE. It starts with profit and adds back the owner's salary, personal perks run through the business and one-time costs. So a 2.61x multiple is not 2.61 times what you will take home as a new owner. It is 2.61 times what the business earns before anyone is paid to run it. If you need to hire a manager, your real return is lower.
Size changes the math. In Q3 2026, businesses priced above $1 million sold at an average of 3.73x cash flow. Those below $1 million sold at 2.30x. Larger companies usually have staff, systems and customers who are not tied to the owner, and buyers pay for that lower risk.
Sector matters too. The Q3 2026 median was $807,000 for manufacturing, $350,000 for service firms, $272,500 for retail and $235,000 for restaurants. A restaurant asking a manufacturing-style multiple needs a very good explanation.
Do businesses sell for their asking price?
Close to it. Sold businesses fetched 94% of asking price on average in 2025. In Q3 2026, deals above $1 million averaged 100.8% of asking, while smaller deals averaged 93.6%. Competition for good larger companies is real.
Headline price is only part of the deal, though. A seller who gets full price but carries a large note, accepts an earnout or agrees to broad indemnity may come out behind a seller who took less cash at closing. Buyers can use that. If the price will not move, negotiate on how and when it is paid.
Expect the process to take a while. The median sale took 170 days to close in 2025, up from 166 in 2024. Among the main sectors, retail closed fastest at 163 days. Restaurants took 189 and manufacturing took 223. Deals with more equipment, leases and permits to transfer give lenders and lawyers more to review.
Who is buying small businesses in 2026?
In the Q3 2026 survey, 51% of buyers described themselves as corporate professionals, 54% as owner-operators and 22% as entrepreneurship-through-acquisition or search-fund buyers. People could pick more than one label, so the groups overlap. A common profile is someone leaving a salaried job to run a company they buy.
Most of them borrow. 78% of buyers expect to use SBA financing to complete an acquisition. That shapes the whole deal. SBA lenders set rules on seller notes, equity injection, personal guarantees and how long the seller stays on, and those rules end up written into your purchase agreement.
Buyers say the main obstacle is finding a quality business (31%), followed by getting financing (15%) and seller asking prices (13%). For sellers, that is a reminder that clean books and a business that runs without you are worth more than a high asking price.
How do buyers pay for a small business?
Very few buyers write one check. A typical deal stacks three pieces: the buyer's own cash, a bank loan (usually SBA-backed) and some money the seller agrees to wait for. That last piece is where most disputes start.
A seller note is a loan from the seller to the buyer, paid back over time with interest. Lenders like it because it keeps the seller invested in a smooth handover. Sellers accept it because it helps close the deal at their price. But the note is only as good as the business after closing. If revenue drops, the buyer may argue it was misrepresented and stop paying, and the seller ends up chasing money in court.
An earnout ties part of the price to future results, such as revenue or gross profit over the first year or two. It can bridge a gap when the buyer doubts the seller's numbers. It can also turn into a fight about accounting. Who controls pricing, hiring and marketing after closing decides whether the target is reachable.
Then there is the holdback or escrow, cash set aside at closing to cover claims if the seller's promises about the business turn out to be wrong. For a buyer, that is protection. For a seller, it is money you may not see for a long time.
For example, picture a buyer acquiring a cleaning company at the $350,000 median. The bank funds most of it, the buyer adds savings, and the seller carries a note for the rest. If the purchase agreement does not say what happens when a big customer leaves in month two, both sides will learn the hard way what the contract actually means.
What to do with these numbers if you are buying or selling
- Ask for several years of tax returns and rebuild SDE yourself. Challenge every add-back the seller cannot document.
- Price the deal off cash flow first, then sanity-check it against the sector median and the revenue multiple.
- Subtract what it will cost to replace the owner's labor before you decide the multiple is fair.
- Plan for a closing that takes months, not weeks, and keep your lender involved from the letter of intent onward.
- Treat the purchase agreement as part of the price. Payment timing, holdbacks, indemnity caps and the seller's non-compete can move real money between the parties.
- Sellers: fix messy books, document key processes and secure lease assignment rights before you list. Those are the things buyers are struggling to find.
How ClauseAudit helps
At a median of $350,000, a small business purchase is one of the largest contracts most owners will ever sign, and much of the risk sits in the fine print rather than the price. ClauseAudit's automated review reads your asset or stock purchase agreement and flags the terms that shift money or liability after closing.
Upload the draft, get a plain English risk report, and take the flagged clauses to your attorney and lender before you sign.
- Purchase price mechanics: what is paid at closing, what is held back, and any inventory or working capital adjustment
- Seller note and earnout terms: interest, payment schedule, how earnings are measured and whether the note is subordinated to the SBA loan
- Representations, warranties and indemnity: how long claims survive, the cap, the basket, and whether there is escrow behind it
- Seller non-compete and non-solicit: scope, geography and length, and whether it fits your state's sale-of-business rules
- Transition and training obligations: how long the seller stays and what happens if they leave early
- Assumed liabilities and assignment of key contracts, including the lease, customer contracts and vendor agreements
Frequently asked questions
How many small businesses are sold each year in the US?
BizBuySell recorded 9,586 closed small business sales in 2025, up 0.4% on 2024. That figure counts deals brokers chose to report, so the true number of sales is higher. Private sales between family members, partners or employees are mostly missing. The sample is still large enough to show prices and multiples for the brokered Main Street market.
What is the average sale price of a small business?
The median sale price was $350,000 in 2025 and $350,000 again in Q3 2026. The median is more useful than an average here, because a handful of large deals would pull an average up. Prices vary widely by sector: in Q3 2026 manufacturing had a median of $807,000 and restaurants $235,000.
What multiple of earnings do small businesses sell for?
Small businesses sold for an average of 2.61x cash flow in 2025, where cash flow is seller's discretionary earnings. The revenue multiple was 0.69x. Bigger deals get higher multiples: in Q3 2026, businesses above $1 million averaged 3.73x cash flow, while those below $1 million averaged 2.30x.
What is seller's discretionary earnings (SDE)?
SDE is the profit a business shows plus the owner's salary, owner perks paid by the company, interest, depreciation and one-time expenses. It shows what one full-time owner-operator could take out. Because it adds back the owner's pay, you should subtract the cost of hiring a replacement if you do not plan to work in the business yourself.
How long does it take to sell a small business?
The median sale took 170 days to close in 2025, compared with 166 days in 2024. Among the main sectors, retail was quickest at 163 days and manufacturing slowest at 223 days. Bigger, equipment-heavy deals usually mean more for lenders and lawyers to check, so plan for months of work, not weeks.
Do small businesses sell for asking price?
Usually a little under. Sold businesses fetched 94% of asking price on average in 2025. In Q3 2026, deals above $1 million averaged 100.8% of asking while smaller deals averaged 93.6%. The structure matters as much as the price, so compare offers on cash at closing, seller financing and indemnity terms.
Who buys small businesses?
In Q3 2026, 51% of surveyed buyers called themselves corporate professionals, 54% owner-operators and 22% search-fund or acquisition entrepreneurs, with overlap between groups. Many are leaving salaried jobs. 78% expect to use SBA financing, so lender requirements often shape the deal terms.
Is it a good time to sell a small business in 2026?
It depends on size and quality. Deals above $1 million rose 8% year over year in Q3 2026 and sold near full asking, while deals below $1 million fell 10%. Buyers say finding a quality business is their biggest obstacle at 31%, so a well-documented business with stable earnings is in demand.
Use this data
Every chart and card below is free to reuse under CC BY 4.0. Download what you need and link back to this page.
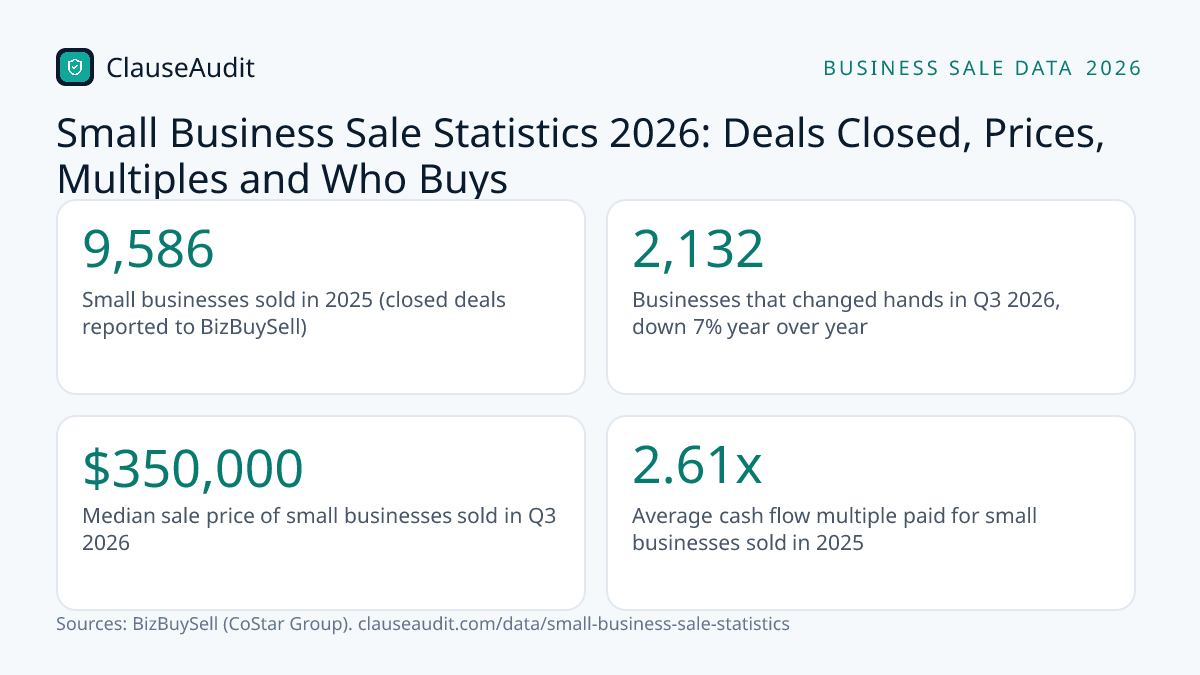 Stat cards
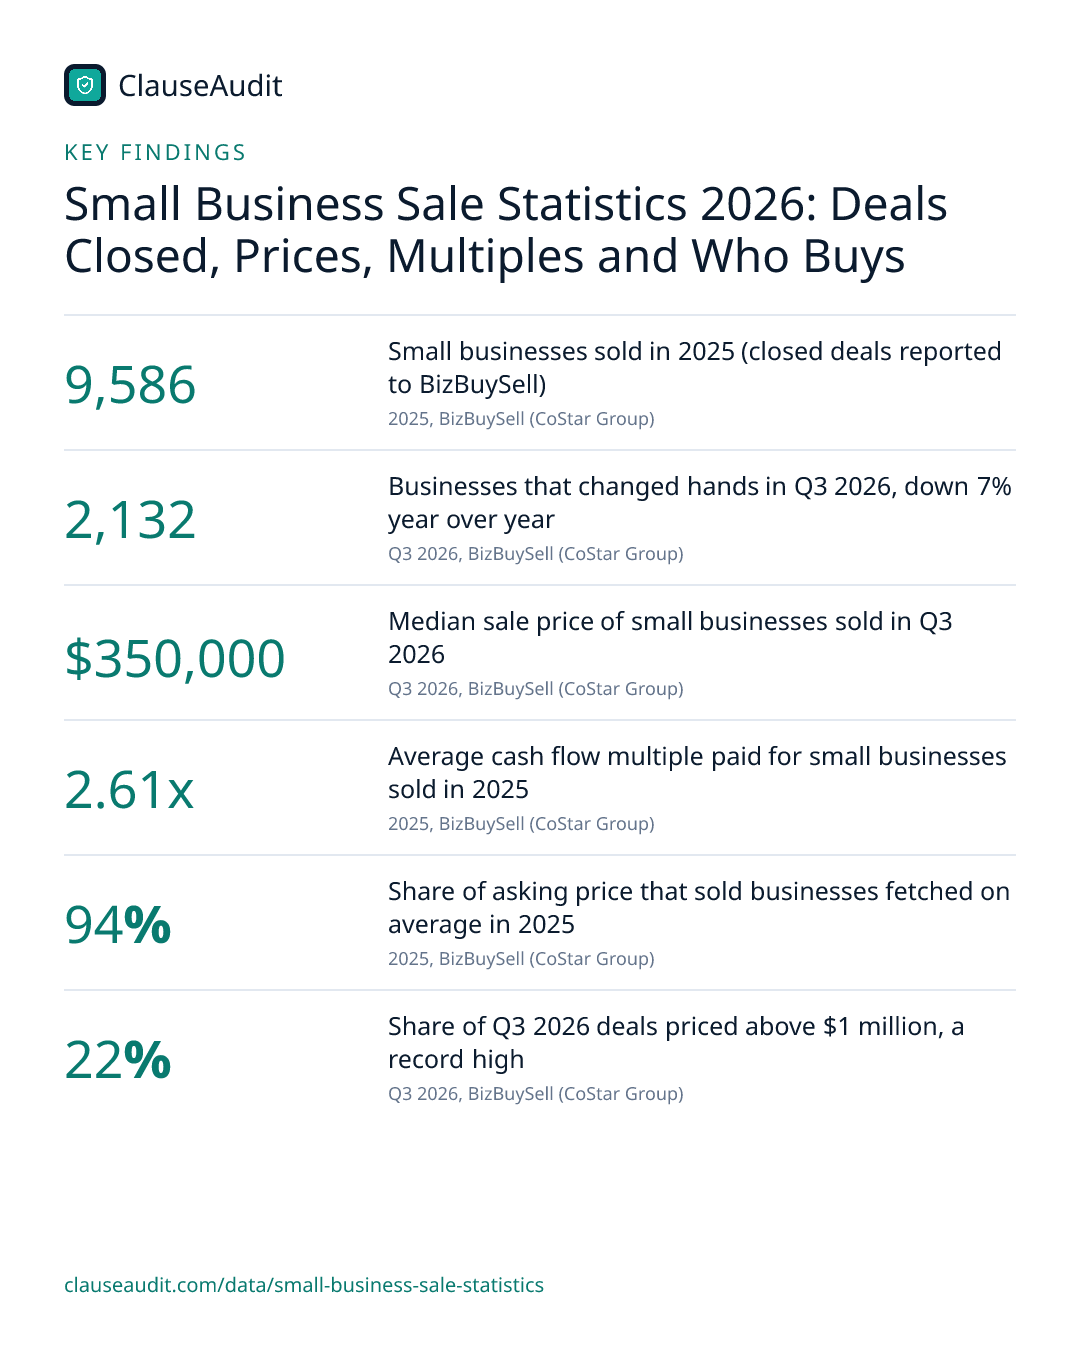 Key findings card
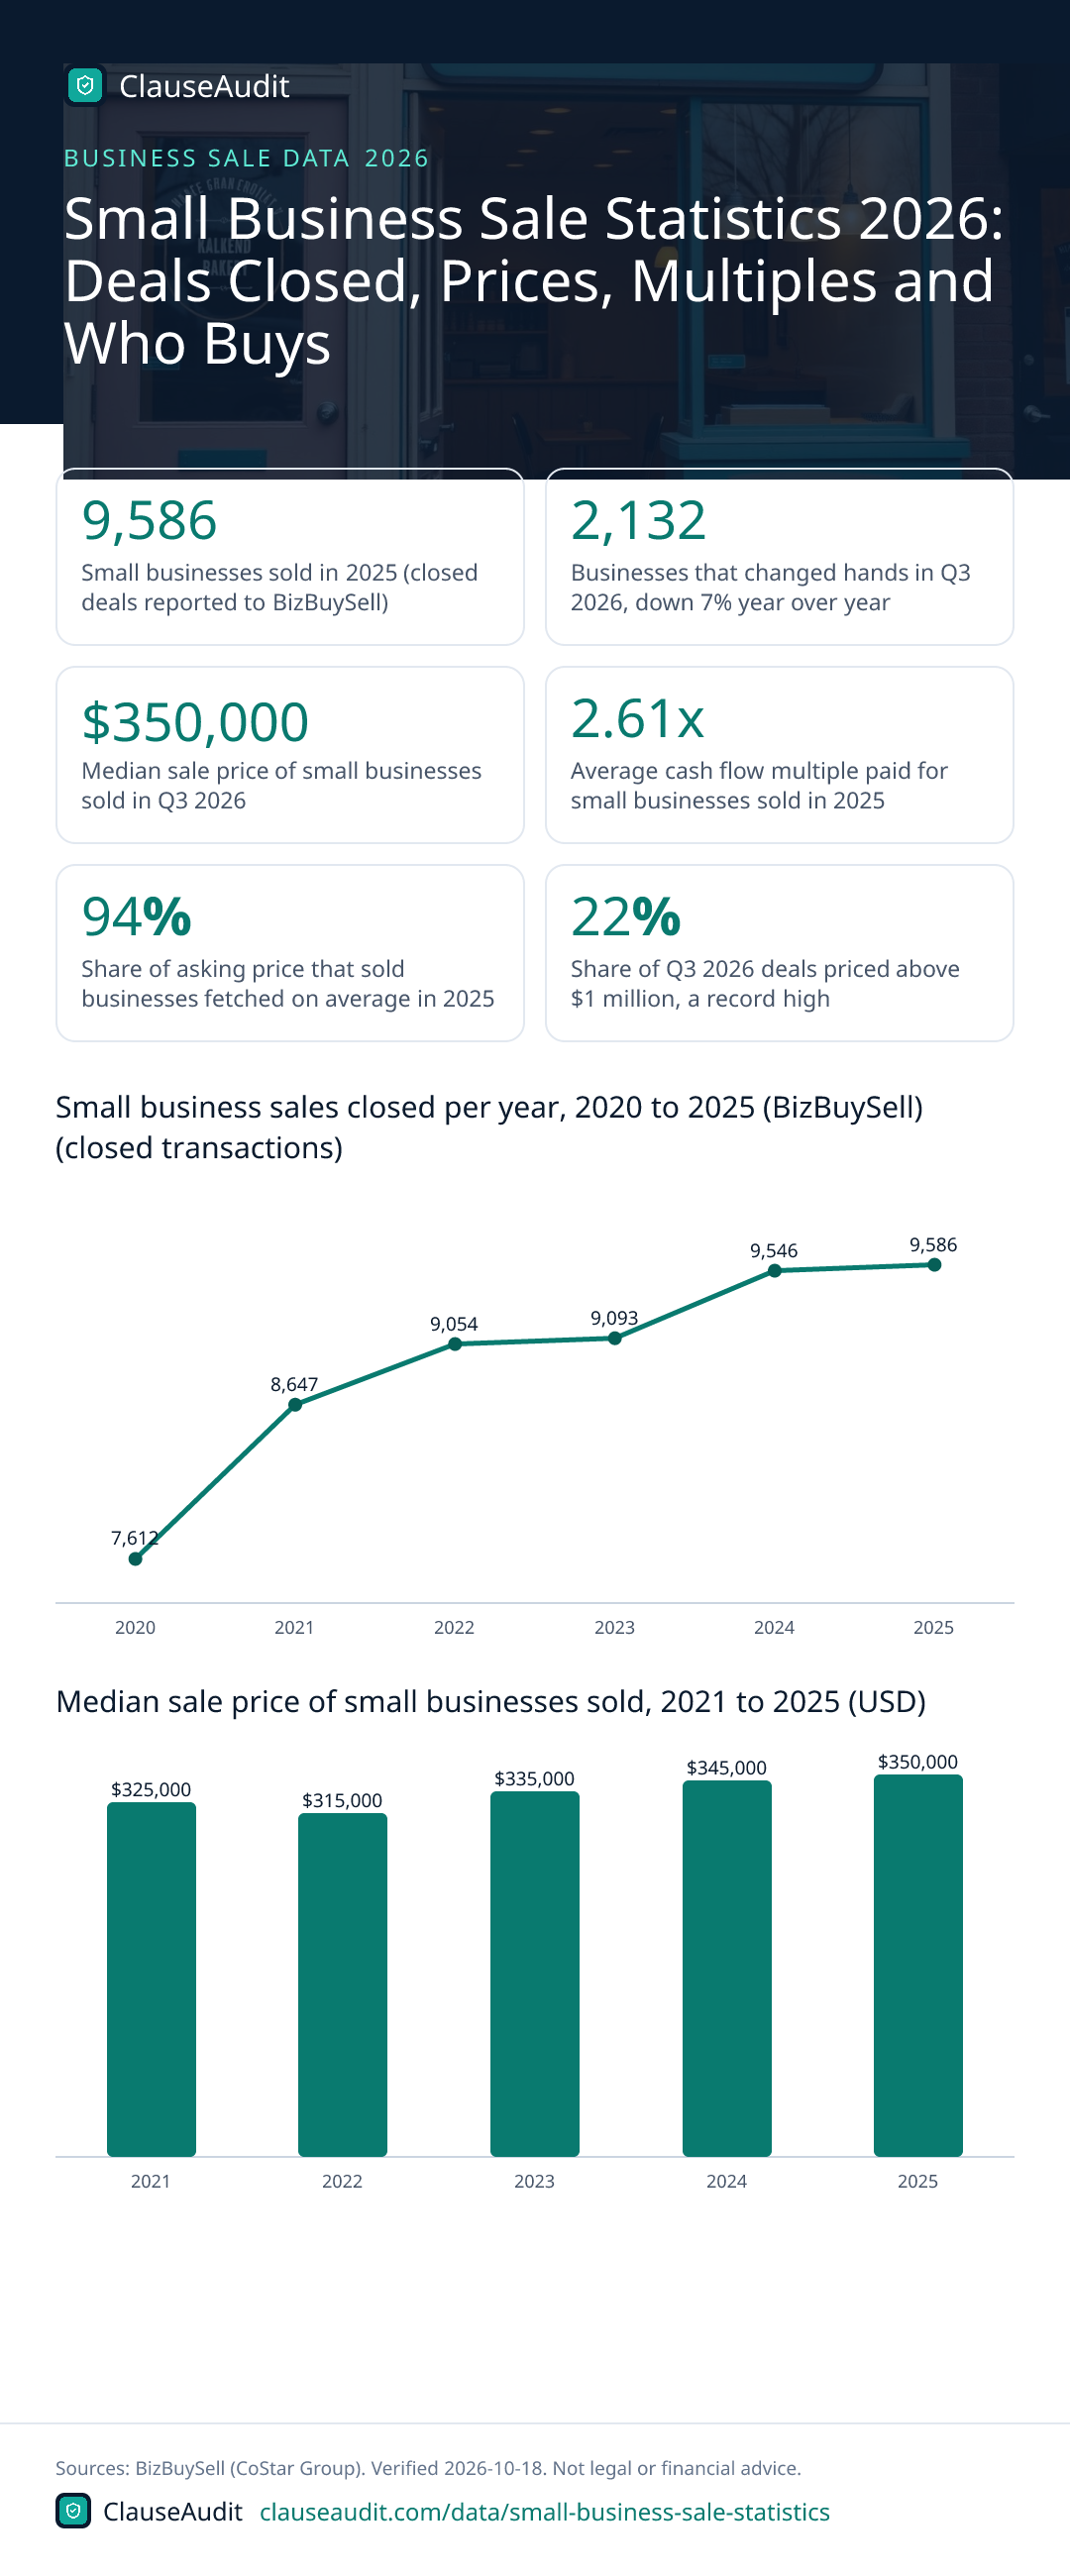 Infographic
 Small business sales closed per year, 2020 to 2025 (BizBuySell) (closed transactions)
 Median sale price of small businesses sold, 2021 to 2025 (USD)
 Average cash flow multiple paid for small businesses, 2021 to 2025 (x cash flow)
 Median sale price by sector, Q3 2026 (USD)
 Share of business buyers identifying as corporate refugees, Q3 2025 to Q2 2026 (% of surveyed buyers)
 What business buyers say is holding them back, Q3 2026 (% of surveyed buyers)
 Small business sales above vs below $1 million, Q3 2026
 US small business sale market, full-year 2025
 Small business sales by quarter, 2026
 Median days to close a small business sale by sector, 2025
Embed the infographic
Free to share on your site, blog or slides under CC BY 4.0. Please keep the credit link.
Sources and method
Every number on this page comes from the sources below, each opened and read on or before October 18, 2026. A second, independent review checked every figure against its source and corrected anything that did not match. Figures that could not be confirmed were left out.
- BizBuySell (CoStar Group), BizBuySell Insight Report, Q3 2026: Q3 Business Sales Hold Steady as Market Selectivity Intensifies (Q3 2026 edition (current edition as of October 18, 2026))
- BizBuySell (CoStar Group), BizBuySell Insight Report, Q2 2026 (Q2 2026)
- BizBuySell (CoStar Group), BizBuySell Insight Report, Q1 2026 (Q1 2026)
- BizBuySell (CoStar Group), 2025 Year in Review: BizBuySell Market Recap (January 30, 2026)
- BizBuySell (CoStar Group), BizBuySell Insight Report, Q4 2025 (Q4 2025 (full-year 2025))
- BizBuySell (CoStar Group), BizBuySell Insight Report, Q3 2025 (Q3 2025)
- BizBuySell (CoStar Group), BizBuySell Insight Report, Q4 2024 (Q4 2024 (full-year 2024))
- BizBuySell (CoStar Group), BizBuySell Insight Report, Q4 2023 (Q4 2023 (full-year 2023))
- BizBuySell (CoStar Group), BizBuySell Insight Report, Q4 2022 (Q4 2022 (full-year 2022))
- BizBuySell (CoStar Group), BizBuySell Insight Report, Q4 2021 (Q4 2021 (full-year 2021))
Cite this page
ClauseAudit, “Small Business Sale Statistics 2026: Deals Closed, Prices, Multiples and Who Buys”, updated October 18, 2026, https://clauseaudit.com/data/small-business-sale-statistics. Free to reuse with a link back (CC BY 4.0).
This page summarises published data and law as checked on October 18, 2026. Figures are updated as new editions are released, and your own situation may differ. It is general information, not legal, tax or financial advice.