Small Business Valuation Multiples by Industry (SDE and EBITDA, 2026)
By ClauseAudit Research · 6 sources ·
What are small business valuation multiples by industry?
Small businesses sold in 2025 went for an average of 2.61x seller's discretionary earnings (SDE) across 9,586 deals, from 2.18x for hair salons to 4.73x for car washes. Larger companies priced $5M to $50M sold for 5.8x EBITDA in Q2 2026, so deal size matters as much as the industry.
- Average cash flow (SDE) multiple paid for small businesses sold in 2025 (2025, BizBuySell (CoStar Group))
- 2.61x
- Average revenue multiple paid for small businesses sold in 2025 (2025, BizBuySell (CoStar Group))
- 0.69x
- Average cash flow multiple, businesses selling above vs below $1 million (Q3 2026, BizBuySell (CoStar Group))
- 3.73x vs 2.30x
- EBITDA multiple for businesses priced $5 million to $50 million (Q2 2026, IBBA and M&A Source via PR Newswire)
- 5.8x
- SDE multiple for businesses priced under $500,000 (Q2 2026, International Business Brokers Association (IBBA) and M&A Source)
- 2x
- Average cash flow multiple for manufacturing businesses, highest major sector (Q3 2026, BizBuySell (CoStar Group))
- 3.02x
- Average cash flow multiple for restaurants sold (Q3 2026, BizBuySell (CoStar Group))
- 2.39x
- Median sale price of small businesses sold (Q3 2026, BizBuySell (CoStar Group))
- $350,000
If you are buying or selling a small business, the price usually starts with one number: a multiple of what the owner takes home. Across broker-reported sales in 2025, the average was 2.61x cash flow, or 0.69x revenue. That is the middle of the market, not a rule.
The spread around that average is wide. Car washes and laundromats sold for far richer multiples than restaurants and salons, and bigger companies were priced on a different earnings measure entirely. Below we explain what drives those gaps, how to use them without fooling yourself, and which contract terms change what you really pay or receive.
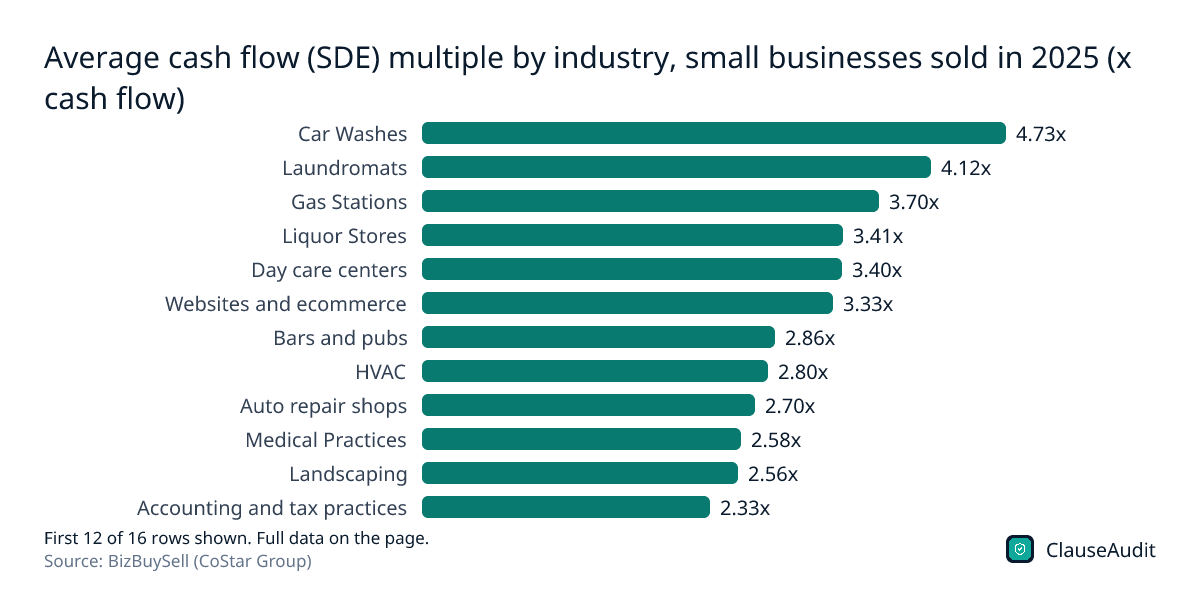
Average cash flow (SDE) multiple by industry, small businesses sold in 2025 (x cash flow)
Chart data
| Label | Value |
|---|---|
| Car Washes | 4.73x |
| Laundromats | 4.12x |
| Gas Stations | 3.70x |
| Liquor Stores | 3.41x |
| Day care centers | 3.40x |
| Websites and ecommerce | 3.33x |
| Bars and pubs | 2.86x |
| HVAC | 2.80x |
| Auto repair shops | 2.70x |
| Medical Practices | 2.58x |
| Landscaping | 2.56x |
| Accounting and tax practices | 2.33x |
| Cleaning businesses | 2.30x |
| Coffee shops and cafes | 2.28x |
| Restaurants | 2.26x |
| Hair salons and barber shops | 2.18x |
Businesses with equipment, steady repeat customers and light staffing sit at the top. Owner-run service shops and restaurants, where the business leans on one person, cluster near the bottom.
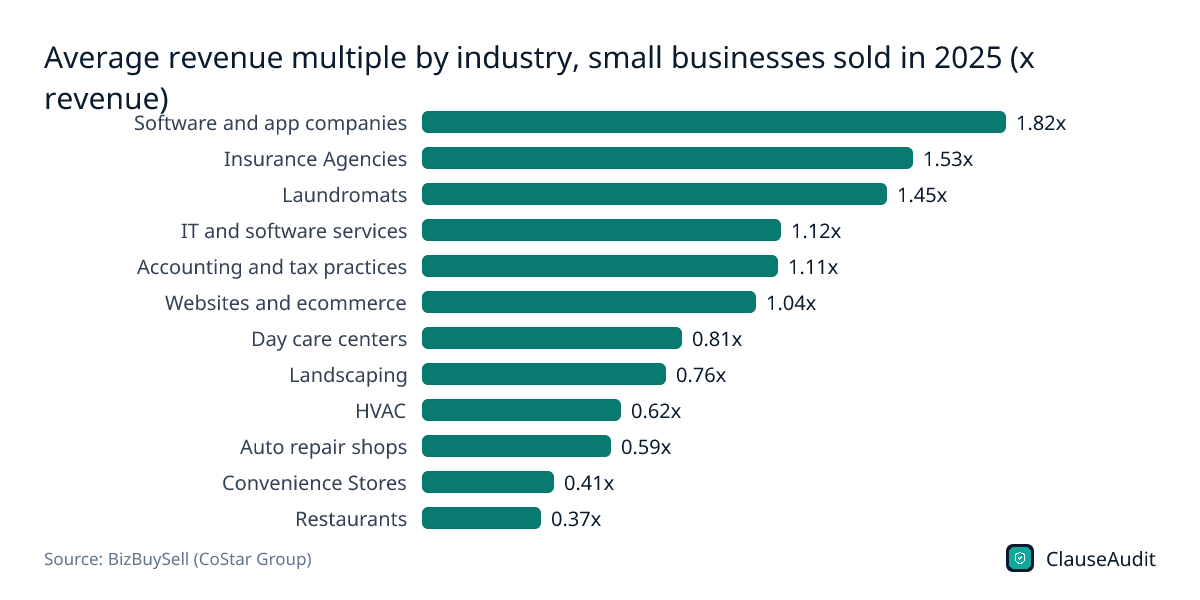
Download this chart (PNG)Average revenue multiple by industry, small businesses sold in 2025 (x revenue)
Chart data
| Label | Value |
|---|---|
| Software and app companies | 1.82x |
| Insurance Agencies | 1.53x |
| Laundromats | 1.45x |
| IT and software services | 1.12x |
| Accounting and tax practices | 1.11x |
| Websites and ecommerce | 1.04x |
| Day care centers | 0.81x |
| Landscaping | 0.76x |
| HVAC | 0.62x |
| Auto repair shops | 0.59x |
| Convenience Stores | 0.41x |
| Restaurants | 0.37x |
Revenue multiples reward high margins and recurring income, which is why software and insurance agencies lead. Restaurants at 0.37x show how thin food margins pull this measure down.
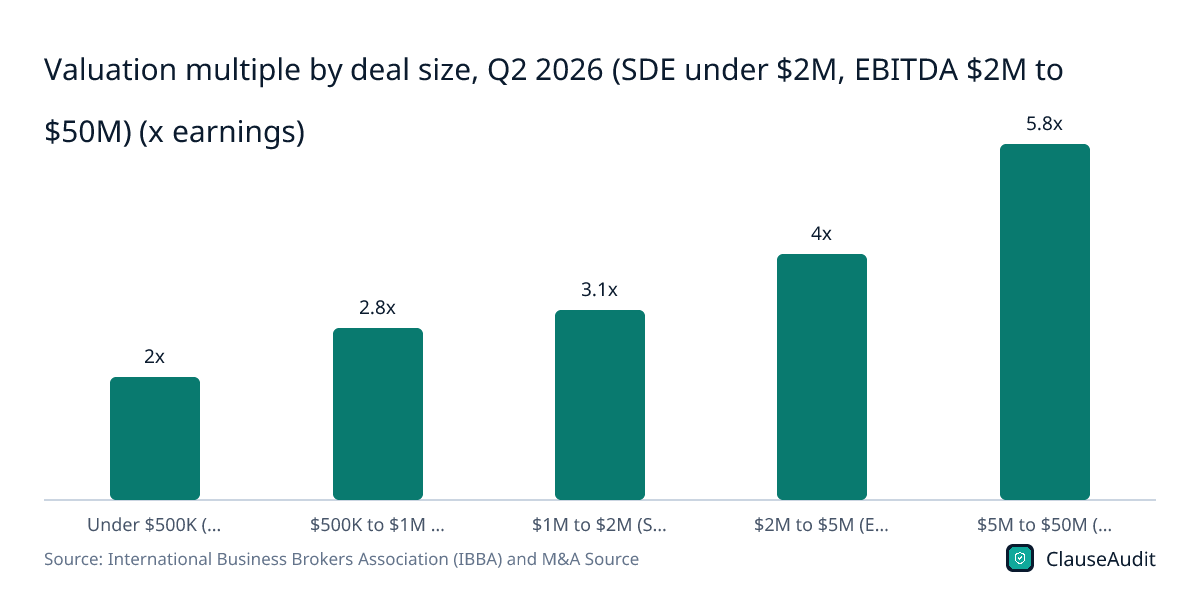
Download this chart (PNG)Valuation multiple by deal size, Q2 2026 (SDE under $2M, EBITDA $2M to $50M) (x earnings)
Chart data
| Label | Value (x earnings) |
|---|---|
| Under $500K (SDE) | 2x |
| $500K to $1M (SDE) | 2.8x |
| $1M to $2M (SDE) | 3.1x |
| $2M to $5M (EBITDA) | 4x |
| $5M to $50M (EBITDA) | 5.8x |
The multiple climbs with every size bracket. Note the switch from SDE to EBITDA at $2M, so the jump between those two bars is partly a change in what is being measured.
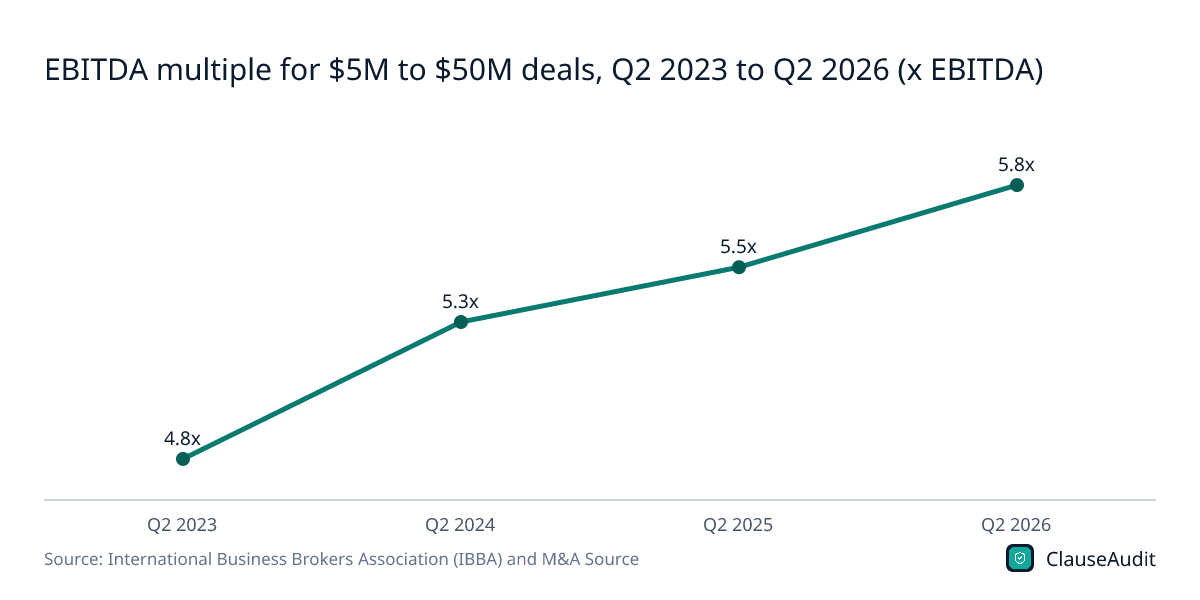
Download this chart (PNG)EBITDA multiple for $5M to $50M deals, Q2 2023 to Q2 2026 (x EBITDA)
Chart data
| Label | Value (x EBITDA) |
|---|---|
| Q2 2023 | 4.8x |
| Q2 2024 | 5.3x |
| Q2 2025 | 5.5x |
| Q2 2026 | 5.8x |
Pricing for $5M to $50M companies has risen each year shown, from 4.8x in Q2 2023 to 5.8x in Q2 2026. Sellers in that range are getting paid more for the same earnings.
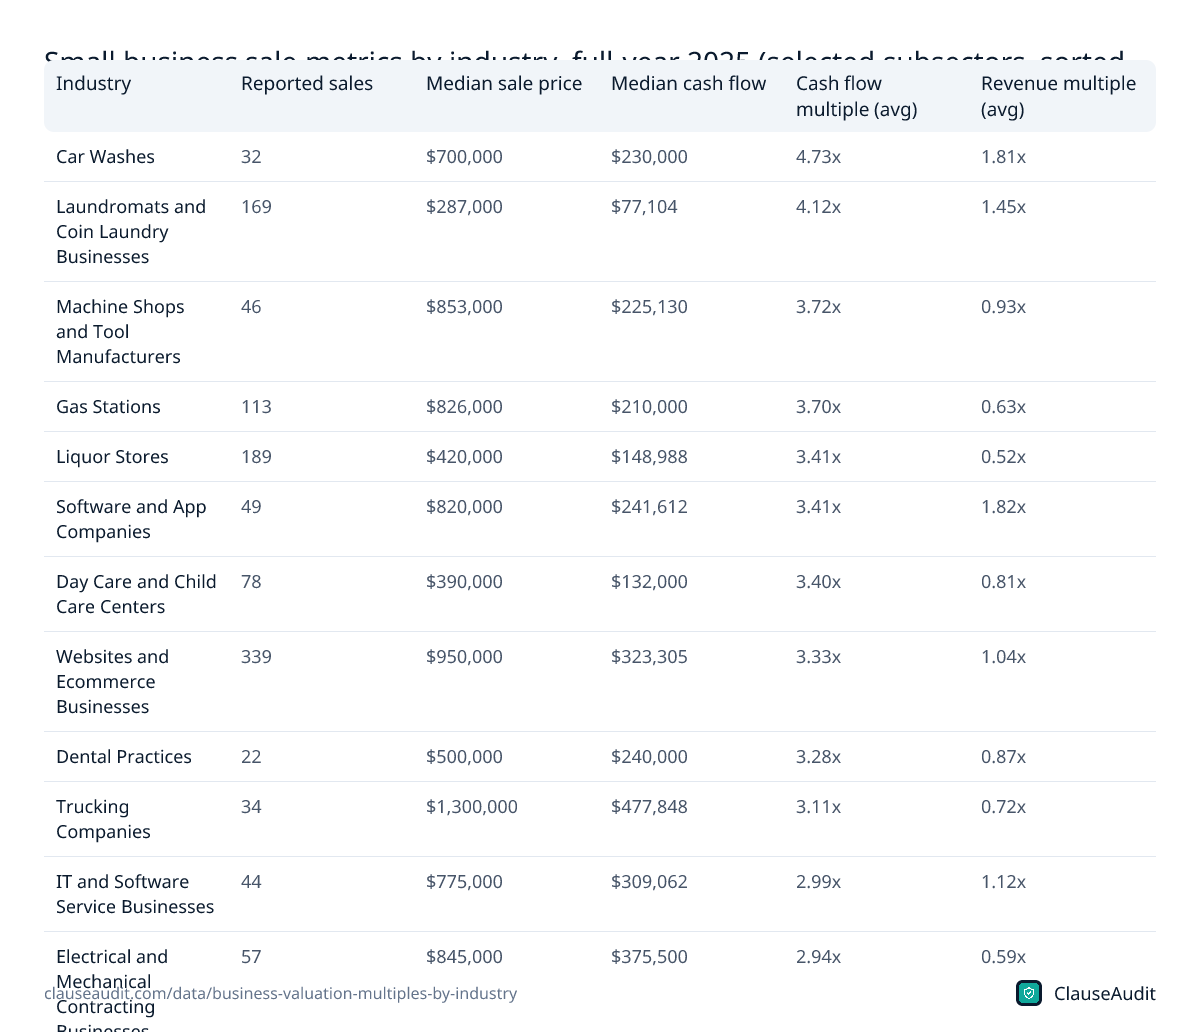
Download this chart (PNG)Small business sale metrics by industry, full-year 2025 (selected subsectors, sorted by cash flow multiple)
| Industry | Reported sales | Median sale price | Median cash flow | Cash flow multiple (avg) | Revenue multiple (avg) |
|---|---|---|---|---|---|
| Car Washes | 32 | $700,000 | $230,000 | 4.73x | 1.81x |
| Laundromats and Coin Laundry Businesses | 169 | $287,000 | $77,104 | 4.12x | 1.45x |
| Machine Shops and Tool Manufacturers | 46 | $853,000 | $225,130 | 3.72x | 0.93x |
| Gas Stations | 113 | $826,000 | $210,000 | 3.70x | 0.63x |
| Liquor Stores | 189 | $420,000 | $148,988 | 3.41x | 0.52x |
| Software and App Companies | 49 | $820,000 | $241,612 | 3.41x | 1.82x |
| Day Care and Child Care Centers | 78 | $390,000 | $132,000 | 3.40x | 0.81x |
| Websites and Ecommerce Businesses | 339 | $950,000 | $323,305 | 3.33x | 1.04x |
| Dental Practices | 22 | $500,000 | $240,000 | 3.28x | 0.87x |
| Trucking Companies | 34 | $1,300,000 | $477,848 | 3.11x | 0.72x |
| IT and Software Service Businesses | 44 | $775,000 | $309,062 | 2.99x | 1.12x |
| Electrical and Mechanical Contracting Businesses | 57 | $845,000 | $375,500 | 2.94x | 0.59x |
| Bars, Pubs and Taverns | 217 | $270,000 | $128,375 | 2.86x | 0.53x |
| Home Health Care Businesses | 92 | $667,000 | $250,000 | 2.84x | 0.60x |
| Convenience Stores | 100 | $228,000 | $120,000 | 2.82x | 0.41x |
| HVAC Businesses | 123 | $800,000 | $315,225 | 2.80x | 0.62x |
| Auto Repair and Service Shops | 247 | $399,000 | $185,970 | 2.70x | 0.59x |
| Insurance Agencies | 50 | $650,000 | $180,000 | 2.68x | 1.53x |
| Plumbing Businesses | 61 | $837,500 | $278,498 | 2.62x | 0.72x |
| Medical Practices | 139 | $537,000 | $225,000 | 2.58x | 0.70x |
| Landscaping and Yard Service Businesses | 211 | $480,000 | $201,392 | 2.56x | 0.76x |
| Gyms and Fitness Centers | 79 | $175,000 | $95,460 | 2.44x | 0.64x |
| Accounting Businesses and Tax Practices | 194 | $500,000 | $246,797 | 2.33x | 1.11x |
| Cleaning Businesses | 154 | $325,000 | $135,017 | 2.30x | 0.78x |
| Coffee Shops and Cafes | 253 | $176,500 | $84,000 | 2.28x | 0.45x |
| Restaurants | 1,774 | $225,000 | $126,500 | 2.26x | 0.37x |
| Dry Cleaners | 141 | $275,000 | $142,092 | 2.20x | 0.77x |
| Hair Salons and Barber Shops | 181 | $165,000 | $92,000 | 2.18x | 0.59x |
| Routes | 496 | $115,000 | $101,725 | 1.51x | 0.63x |
Source: BizBuySell (CoStar Group), BizBuySell Insight Report Data Tables: Closed Small Business Transaction Metrics by Sector for the Full-Year 2025. Download as image
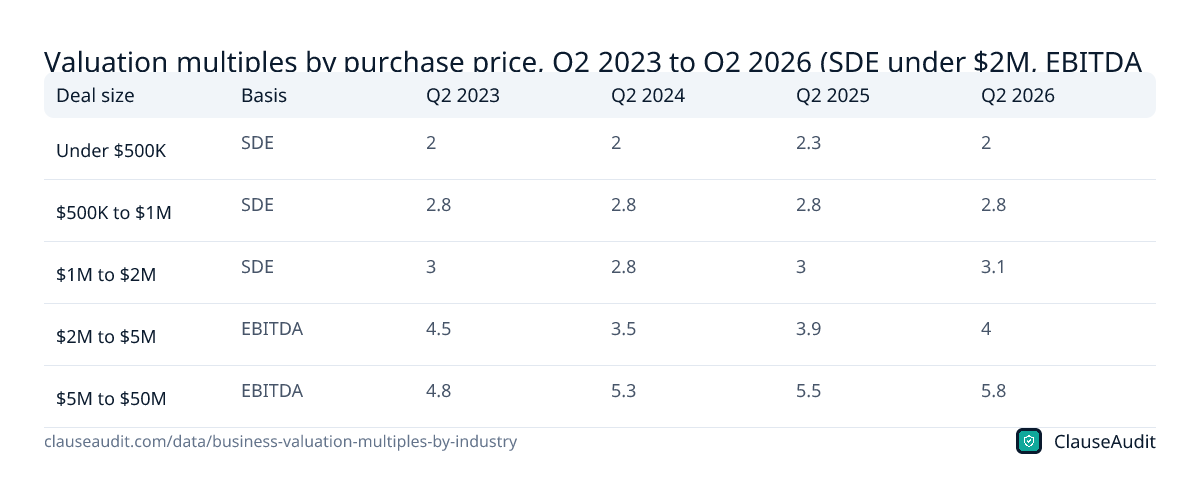
Valuation multiples by purchase price, Q2 2023 to Q2 2026 (SDE under $2M, EBITDA $2M to $50M)
| Deal size | Basis | Q2 2023 | Q2 2024 | Q2 2025 | Q2 2026 |
|---|---|---|---|---|---|
| Under $500K | SDE | 2 | 2 | 2.3 | 2 |
| $500K to $1M | SDE | 2.8 | 2.8 | 2.8 | 2.8 |
| $1M to $2M | SDE | 3 | 2.8 | 3 | 3.1 |
| $2M to $5M | EBITDA | 4.5 | 3.5 | 3.9 | 4 |
| $5M to $50M | EBITDA | 4.8 | 5.3 | 5.5 | 5.8 |
Source: International Business Brokers Association (IBBA) and M&A Source, Market Pulse Q2 2026 Highlights. Download as image
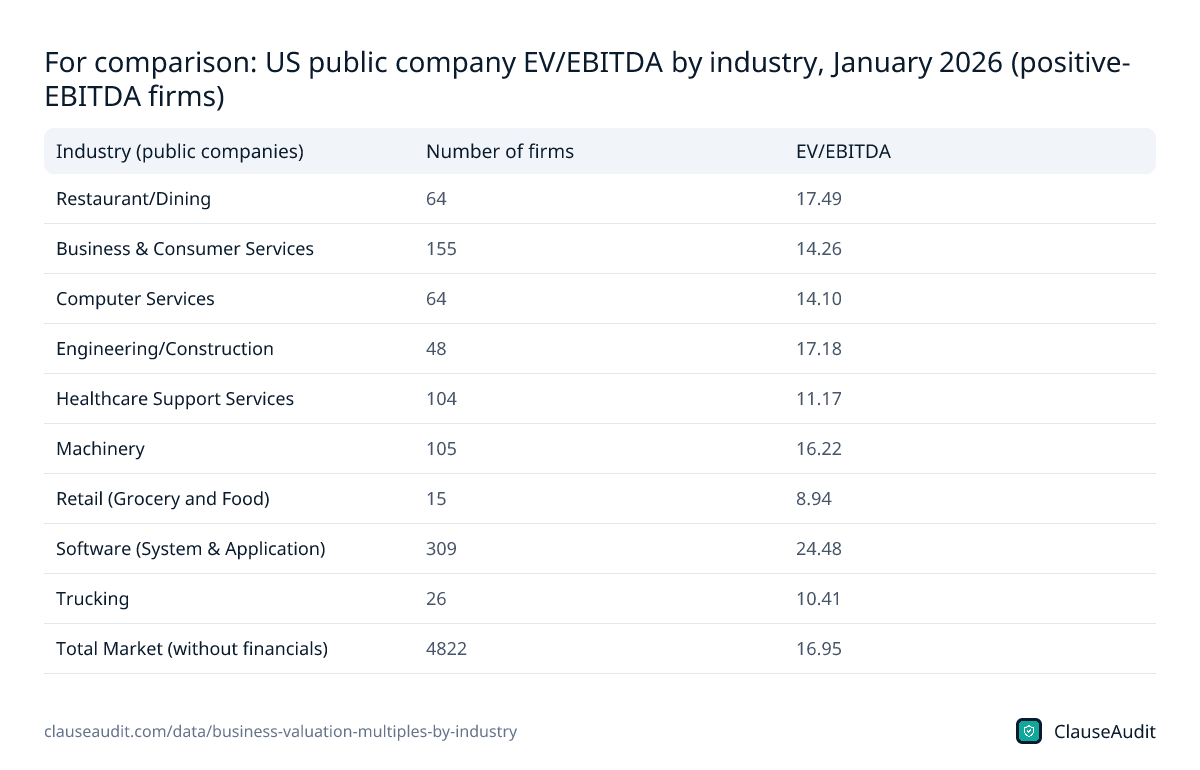
For comparison: US public company EV/EBITDA by industry, January 2026 (positive-EBITDA firms)
| Industry (public companies) | Number of firms | EV/EBITDA |
|---|---|---|
| Restaurant/Dining | 64 | 17.49 |
| Business & Consumer Services | 155 | 14.26 |
| Computer Services | 64 | 14.10 |
| Engineering/Construction | 48 | 17.18 |
| Healthcare Support Services | 104 | 11.17 |
| Machinery | 105 | 16.22 |
| Retail (Grocery and Food) | 15 | 8.94 |
| Software (System & Application) | 309 | 24.48 |
| Trucking | 26 | 10.41 |
| Total Market (without financials) | 4822 | 16.95 |
Source: Aswath Damodaran, NYU Stern School of Business, Enterprise Value Multiples by Sector (US). Download as image
What is a good SDE multiple for a small business?
For most Main Street deals, a fair multiple sits close to the market average. In 2025 that was 2.61x cash flow across 9,586 closed sales. In Q3 2026 the median business sold for $350,000, on median cash flow of $156,000.
Size shifts the answer fast. In Q3 2026, businesses selling above $1 million averaged 3.73x cash flow, while those below averaged 2.30x. The broker survey tells the same story: deals under $500K went for 2x SDE in Q2 2026, and $1M to $2M deals went for 3.1x.
So a "good" multiple depends on who you are. If you are a seller with a small, owner-run shop, a bid near the bottom of the range may be normal, not an insult. If you are a buyer, a seller asking a top-tier multiple for a small, owner-dependent business needs to show you why.
Why do car washes and laundromats sell for more than restaurants?
Buyers pay for earnings they believe will keep coming after the seller walks away. Car washes averaged 4.73x cash flow in 2025 and laundromats 4.12x. Both run on equipment, repeat local customers and small staffs. A new owner can step in without rebuilding the customer base.
Restaurants averaged 2.26x in 2025 and coffee shops 2.28x. Hair salons and barber shops came in at 2.18x. These businesses depend on the owner, a chef or a few stylists, and customers can follow those people out the door. Margins are thin, leases matter a lot, and failure risk is real. Buyers price that in.
Service trades land in the middle. HVAC businesses averaged 2.80x, auto repair shops 2.70x and plumbing businesses 2.62x. They have steady demand and trained crews, but the owner often holds the key customer relationships and the licenses, so a smooth handover is worth real money to a buyer.
Look at the deal counts too. Restaurants had 1,774 reported sales, so that average is solid. Car washes had 32 and dental practices 22, so a handful of unusual deals can move those numbers. Treat small-sample industries as a rough guide.
SDE vs EBITDA: which multiple applies to your deal?
SDE, or seller's discretionary earnings, is profit before taxes, interest, depreciation and amortization, with one owner's salary and perks added back. It assumes the buyer will run the place. Most businesses under about $2M are priced this way, and broker listings usually call it "cash flow."
EBITDA assumes the owner is replaced by a paid manager, so a market salary comes out before the multiple is applied. That is part of why EBITDA multiples look higher: the earnings figure is smaller. Bigger, less owner-dependent companies also carry less risk. In Q2 2026, $2M to $5M deals sold for 4x EBITDA and $5M to $50M deals for 5.8x.
Here is how the switch plays out. Picture an owner who pays himself nothing on paper and works long weeks. His SDE looks healthy. Hire a general manager to replace him and the EBITDA is far lower. Same business, same price, two very different-looking multiples.
Never apply an EBITDA multiple to SDE, or the reverse. Sellers sometimes quote a bigger-company EBITDA multiple against owner-inclusive SDE. That one mix-up can inflate a price by a wide margin.
How to estimate what a business is worth
- Rebuild the earnings. Start with tax returns, not the listing sheet. Add back only real one-time costs and the owner's own pay and perks. Question every add-back you cannot trace to a document.
- Pick the right basis. Use SDE for an owner-operated business and EBITDA for one with a manager in place.
- Find the industry range. Compare the cash flow and revenue multiples for your sector in the table above, and check both. A business that looks cheap on cash flow but expensive on revenue may have earnings that are unusually high this year.
- Adjust for risk. Move down for customer concentration, a short lease, owner dependence or falling sales. Move up for recurring contracts, documented systems and staff who will stay.
- Test it against financing. If an SBA lender or seller note cannot be repaid from the cash flow, the price is too high no matter what the multiple says.
- Read the deal terms, not just the headline. Earnouts, seller notes, working capital targets and holdbacks can make two offers at the same multiple worth very different amounts.
Why do small businesses sell for so much less than public companies?
In January 2026, public US companies outside finance traded at 16.95 times EBITDA on average. Public restaurant chains sat at 17.49 and software companies at 24.48. A local restaurant, by comparison, sold for 2.26x cash flow in 2025.
The gap is about risk and liquidity. A public chain has hundreds of locations, professional management and shares you can sell in seconds. A single shop has one owner, one lease and no ready market for its stock. Buyers also usually have to borrow and personally guarantee the loan. Use public multiples only as a ceiling for context, never as a pricing benchmark for a Main Street sale.
What these numbers mean for buyers and sellers right now
Multiples have mostly held or risen. The average cash flow multiple ticked up in 2025, though deals under $500K slipped from 2.3x SDE in Q2 2025 to 2x in Q2 2026. Meanwhile, the $5M to $50M segment climbed from 5.5x in Q2 2025 to 5.8x in Q2 2026. For larger sellers, that is a decent market.
For smaller sellers, the best way to raise your price is to make the business less dependent on you. Write down your processes, train a second-in-command, lock in a longer lease and move customers onto contracts. For buyers, spend more time on the earnings and the contract than on the multiple. A fair multiple on inflated earnings is still an overpay.
If you are an employee or manager being offered a stake, or a key worker in a business up for sale, these figures help too. They tell you roughly what the owner expects to collect, and why a buyer may ask you to sign a retention deal or a non-compete before closing.
How ClauseAudit helps
The multiple sets the headline price. The purchase agreement decides how much of it actually changes hands, when, and what happens if the earnings turn out lower than promised.
Run your letter of intent or purchase agreement through an automated review before you sign. It flags the clauses that move real value between buyer and seller, explained in plain English.
- Purchase price and adjustments: is there a working capital target or inventory count that can lower the price at closing?
- Earnout terms: who controls the business during the earnout, and how exactly are the targets measured?
- Seller note: what is the interest rate, is it subordinated to the bank loan, and what happens on a missed payment?
- Reps, warranties and indemnity: how long do the seller's promises last, and is there a cap or escrow behind them?
- Seller non-compete: is the scope, area and length reasonable for the business you are buying?
- Transition and lease assignment: will the landlord consent, and how long must the seller stay to hand over customers?
Frequently asked questions
What is the average multiple for a small business?
Small businesses sold in 2025 went for an average of 2.61x cash flow and 0.69x revenue, based on 9,586 broker-reported sales. Cash flow here usually means SDE, which includes the owner's pay. Smaller deals tend to land below that average and larger ones above it.
How many times SDE does a restaurant sell for?
Restaurants averaged 2.26x cash flow in 2025, near the bottom of the industries tracked, and 2.39x in Q3 2026. On revenue, they averaged just 0.37x in 2025. Thin margins, owner dependence and lease risk keep restaurant prices low compared with equipment-heavy businesses like car washes.
Which small businesses sell for the highest multiples?
In 2025, car washes led at 4.73x cash flow, followed by laundromats at 4.12x, machine shops at 3.72x and gas stations at 3.70x. In Q3 2026, manufacturing was the strongest major sector at 3.02x. On revenue, software and app companies led at 1.82x.
Is SDE the same as EBITDA?
No. SDE adds back one owner's salary and perks, so it suits businesses where the buyer will work in the company. EBITDA subtracts a market-rate manager's pay, so it is smaller and gets a higher multiple. Brokers use SDE for most deals under $2M and EBITDA above that.
What EBITDA multiple do lower middle market companies get?
Companies priced $5M to $50M sold for 5.8x EBITDA in Q2 2026, up from 5.5x a year earlier and 4.8x in Q2 2023. Deals of $2M to $5M went for 4x EBITDA. These figures come from a quarterly survey of business brokers and M&A advisors.
Should I value my business on revenue or cash flow?
Use cash flow as your main measure, because buyers pay for earnings they can live on and use to repay a loan. Revenue multiples are a useful cross-check. A high cash flow multiple paired with a low revenue multiple can point to unusually strong margins that a buyer will want to verify.
Why is my business worth less than the industry average?
Averages hide the risk in any single deal. Heavy reliance on you, a few large customers, a short lease, declining sales or messy books all push a price down. Smaller deals also run lower: businesses selling below $1 million averaged 2.30x cash flow in Q3 2026, against 3.73x above it.
Do these multiples include inventory and real estate?
Not always. Many small business sales price the operating business on its own, with real estate sold or leased separately and inventory sometimes paid for on top of the price. Check what your offer includes, since an extra inventory payment or a separate property deal changes the true multiple you are paying.
Use this data
Every chart and card below is free to reuse under CC BY 4.0. Download what you need and link back to this page.
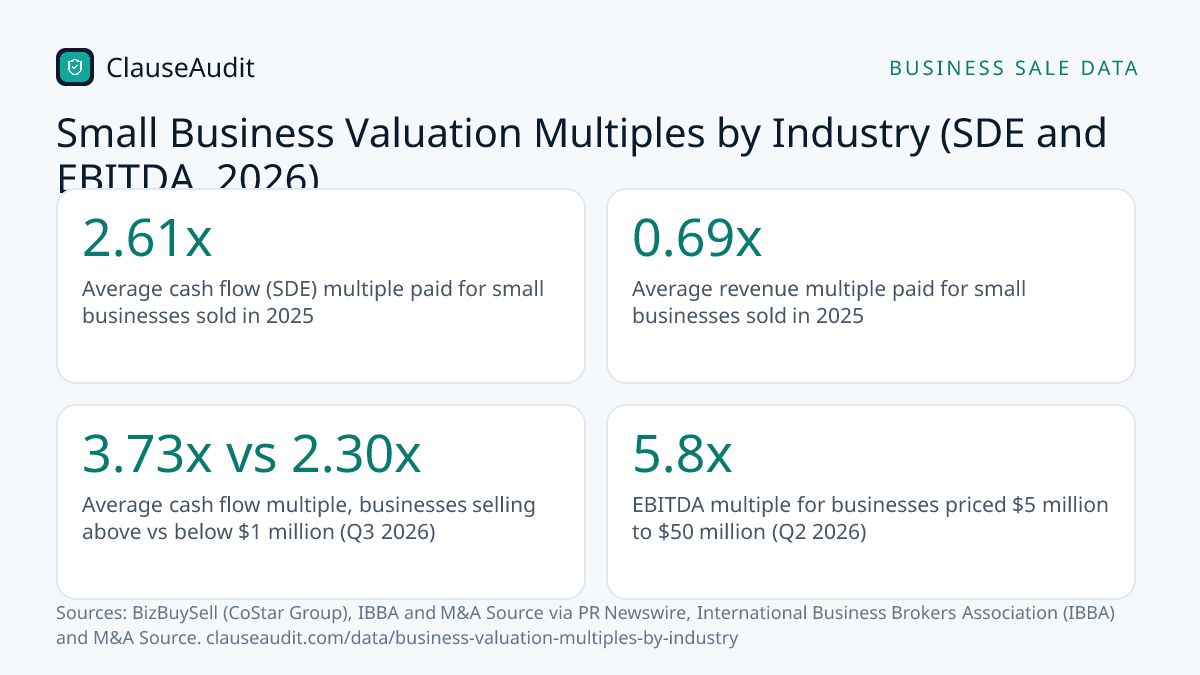 Stat cards
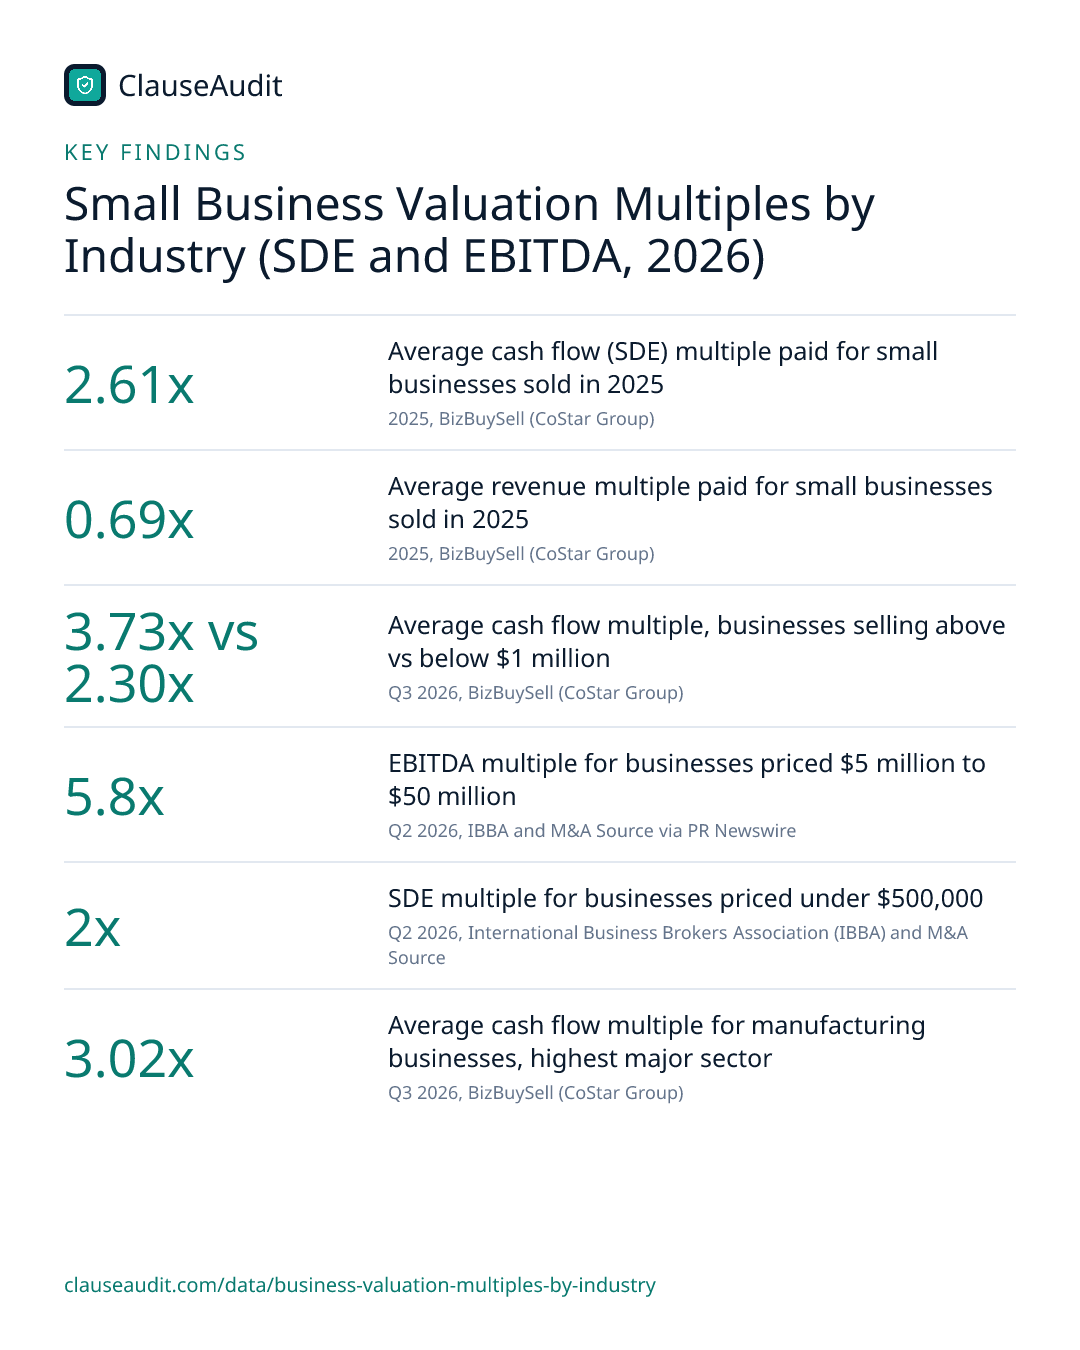 Key findings card
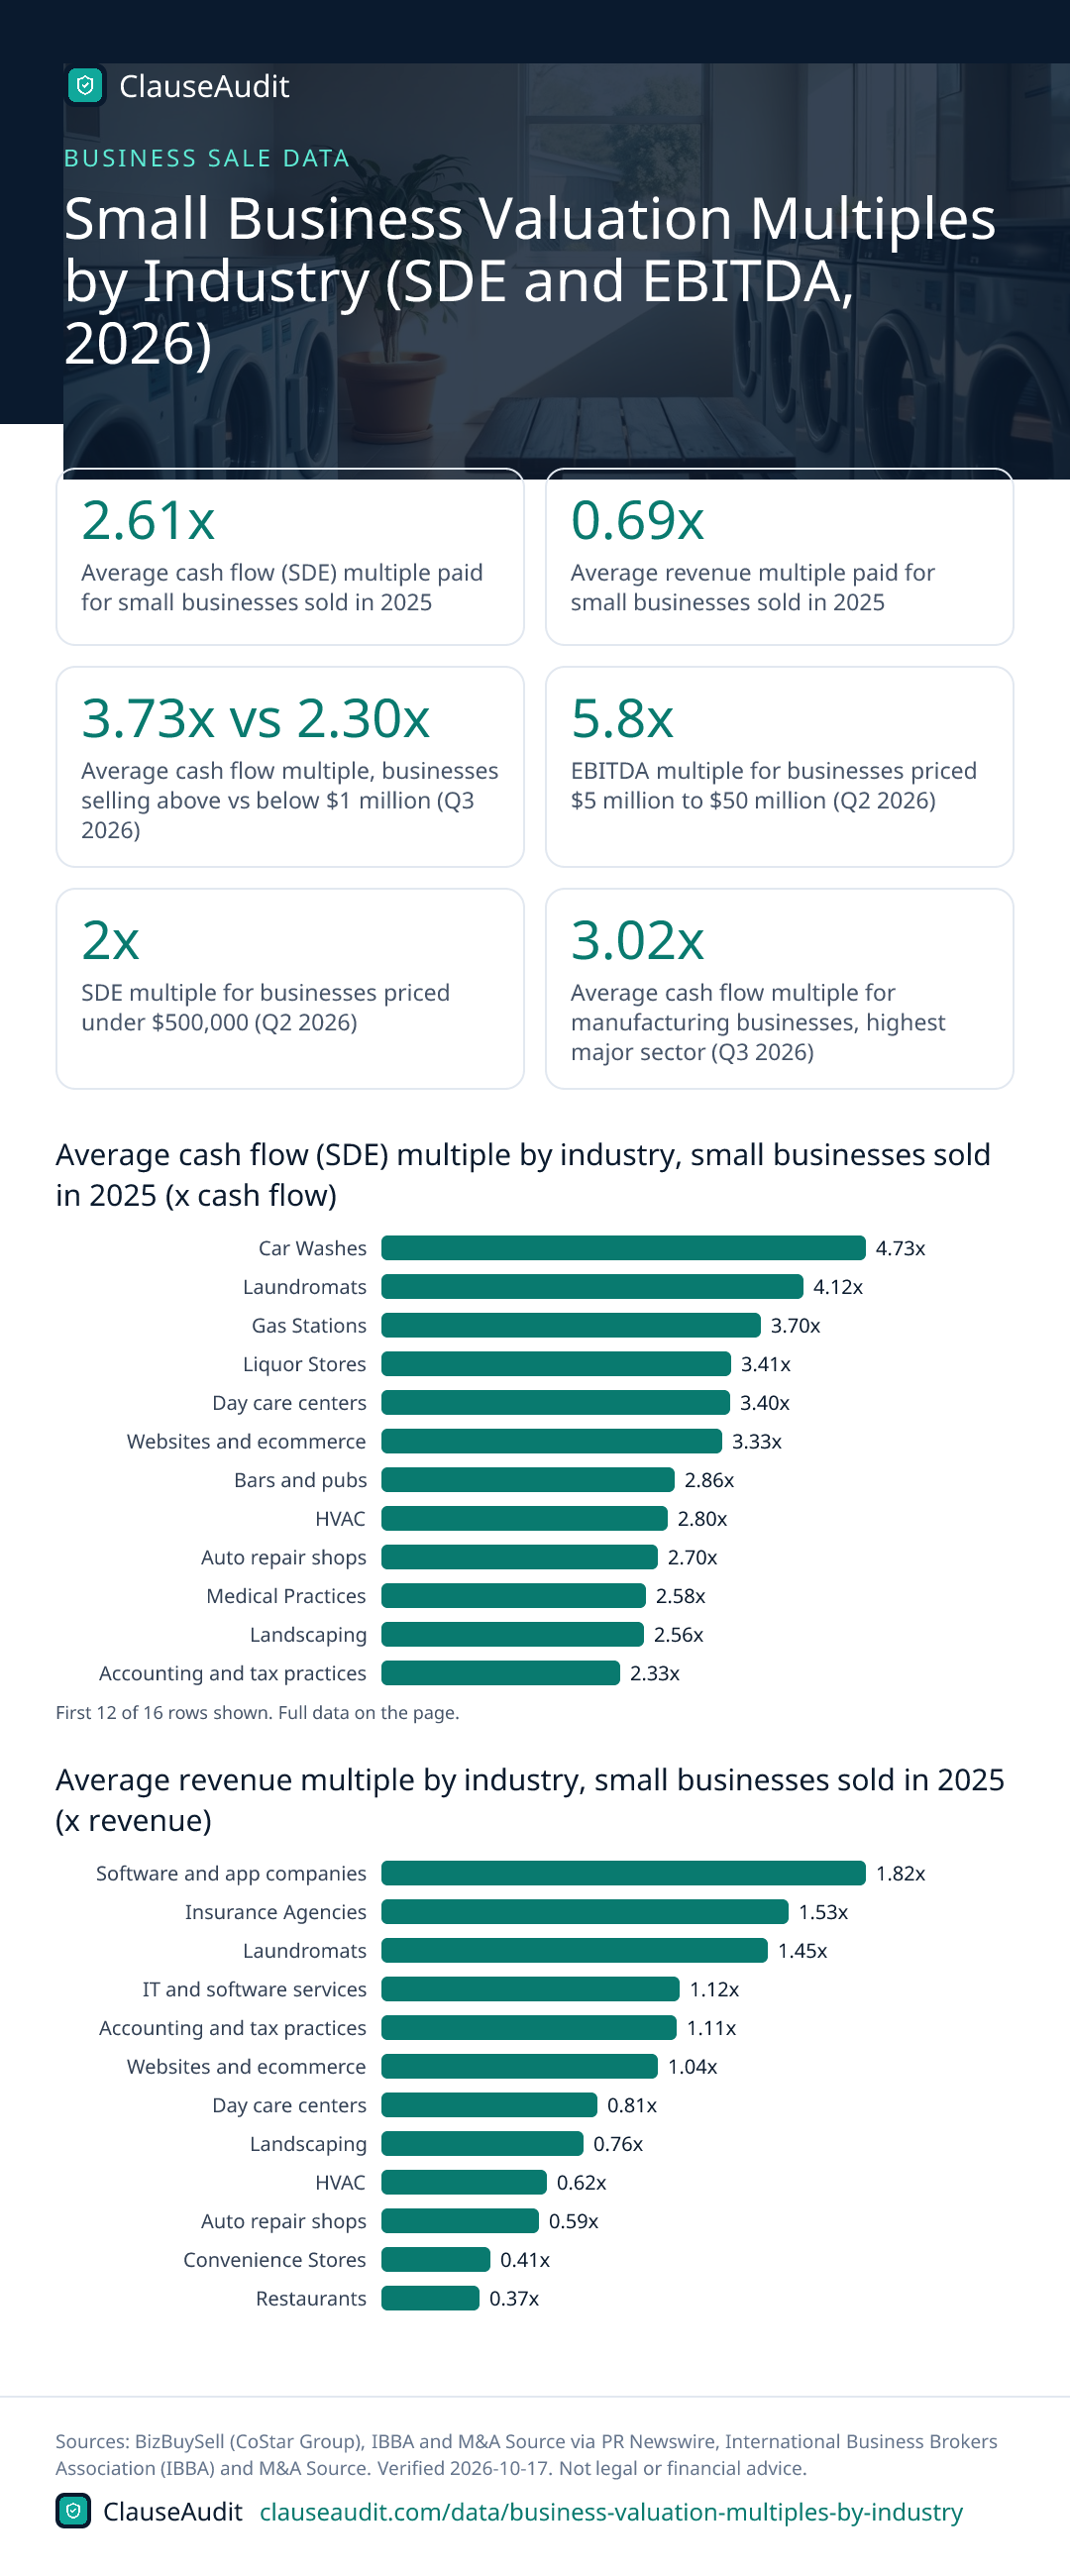 Infographic
 Average cash flow (SDE) multiple by industry, small businesses sold in 2025 (x cash flow)
 Average revenue multiple by industry, small businesses sold in 2025 (x revenue)
 Valuation multiple by deal size, Q2 2026 (SDE under $2M, EBITDA $2M to $50M) (x earnings)
 EBITDA multiple for $5M to $50M deals, Q2 2023 to Q2 2026 (x EBITDA)
 Small business sale metrics by industry, full-year 2025 (selected subsectors, sorted by cash flow multiple)
 Valuation multiples by purchase price, Q2 2023 to Q2 2026 (SDE under $2M, EBITDA $2M to $50M)
 For comparison: US public company EV/EBITDA by industry, January 2026 (positive-EBITDA firms)
Embed the infographic
Free to share on your site, blog or slides under CC BY 4.0. Please keep the credit link.
Sources and method
Every number on this page comes from the sources below, each opened and read on or before October 17, 2026. A second, independent review checked every figure against its source and corrected anything that did not match. Figures that could not be confirmed were left out.
- BizBuySell (CoStar Group), BizBuySell Insight Report Data Tables: Closed Small Business Transaction Metrics by Sector for the Full-Year 2025 (Full-year 2025 data, shown with the Q3 2026 Insight Report)
- BizBuySell (CoStar Group), BizBuySell Insight Report, Q3 2026 (Q3 2026)
- BizBuySell (CoStar Group), 2025 Year in Review: BizBuySell Market Recap (January 30, 2026)
- International Business Brokers Association (IBBA) and M&A Source, Market Pulse Q2 2026 Highlights (Q2 2026 edition (August 2026))
- IBBA and M&A Source via PR Newswire, The Market Pulse Survey Q2 2026 Reports the Latest Trends in Business Sales up to $50M (August 25, 2026)
- Aswath Damodaran, NYU Stern School of Business, Enterprise Value Multiples by Sector (US) (January 2026)
Cite this page
ClauseAudit, “Small Business Valuation Multiples by Industry (SDE and EBITDA, 2026)”, updated October 17, 2026, https://clauseaudit.com/data/business-valuation-multiples-by-industry. Free to reuse with a link back (CC BY 4.0).
This page summarises published data and law as checked on October 17, 2026. Figures are updated as new editions are released, and your own situation may differ. It is general information, not legal, tax or financial advice.