Earnout, Escrow and Indemnity Statistics: What Counts as Market Now
By ClauseAudit Research · 6 sources ·
What do the latest earnout statistics show?
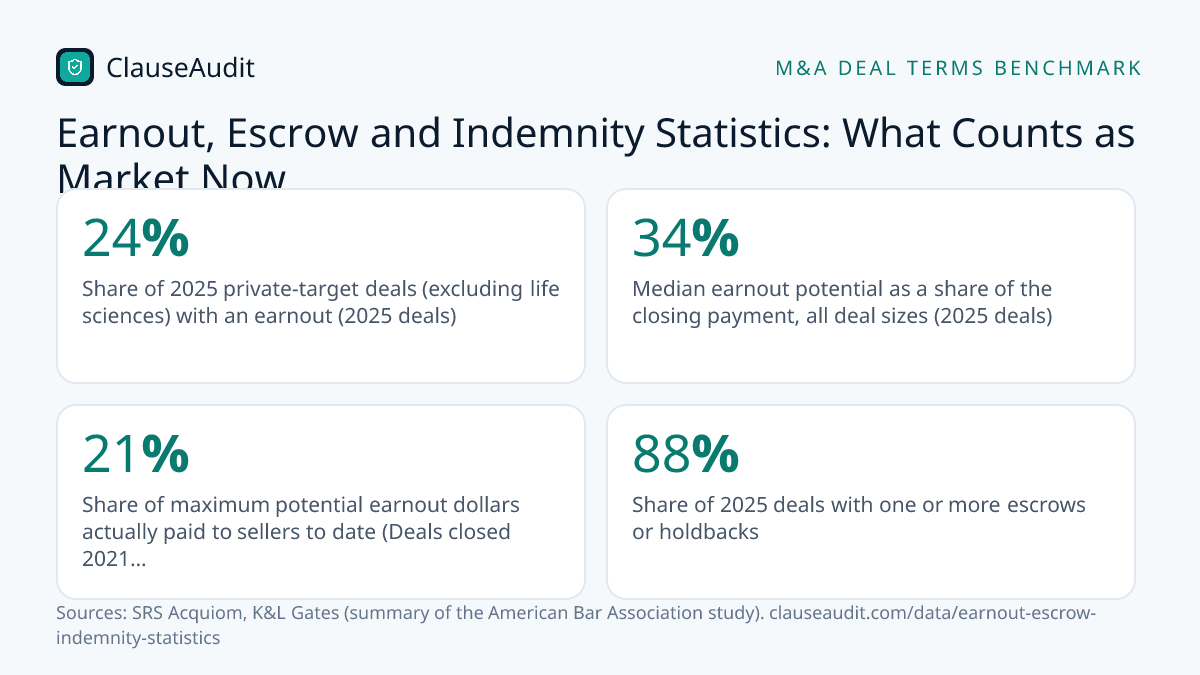
Earnouts are more common than their old norm, but they pay out poorly. In SRS Acquiom's data, 24% of 2025 private-target deals (excluding life sciences) had an earnout, up from 22% in 2024. Yet on deals closed 2021 to mid-2024, sellers had received only 21% of the maximum potential earnout dollars.

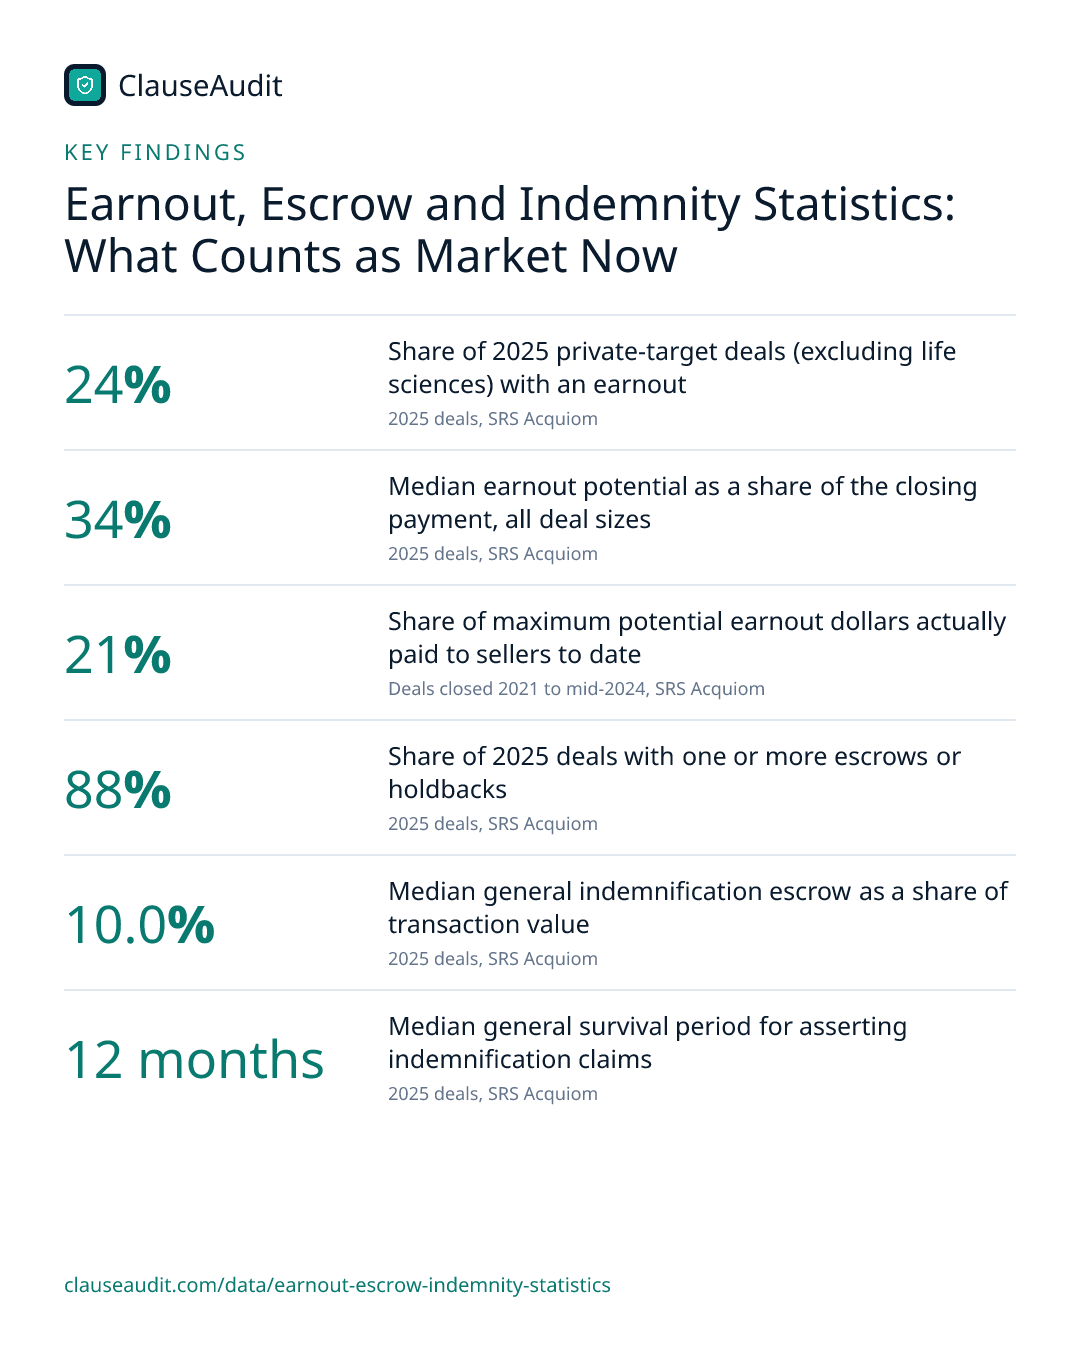
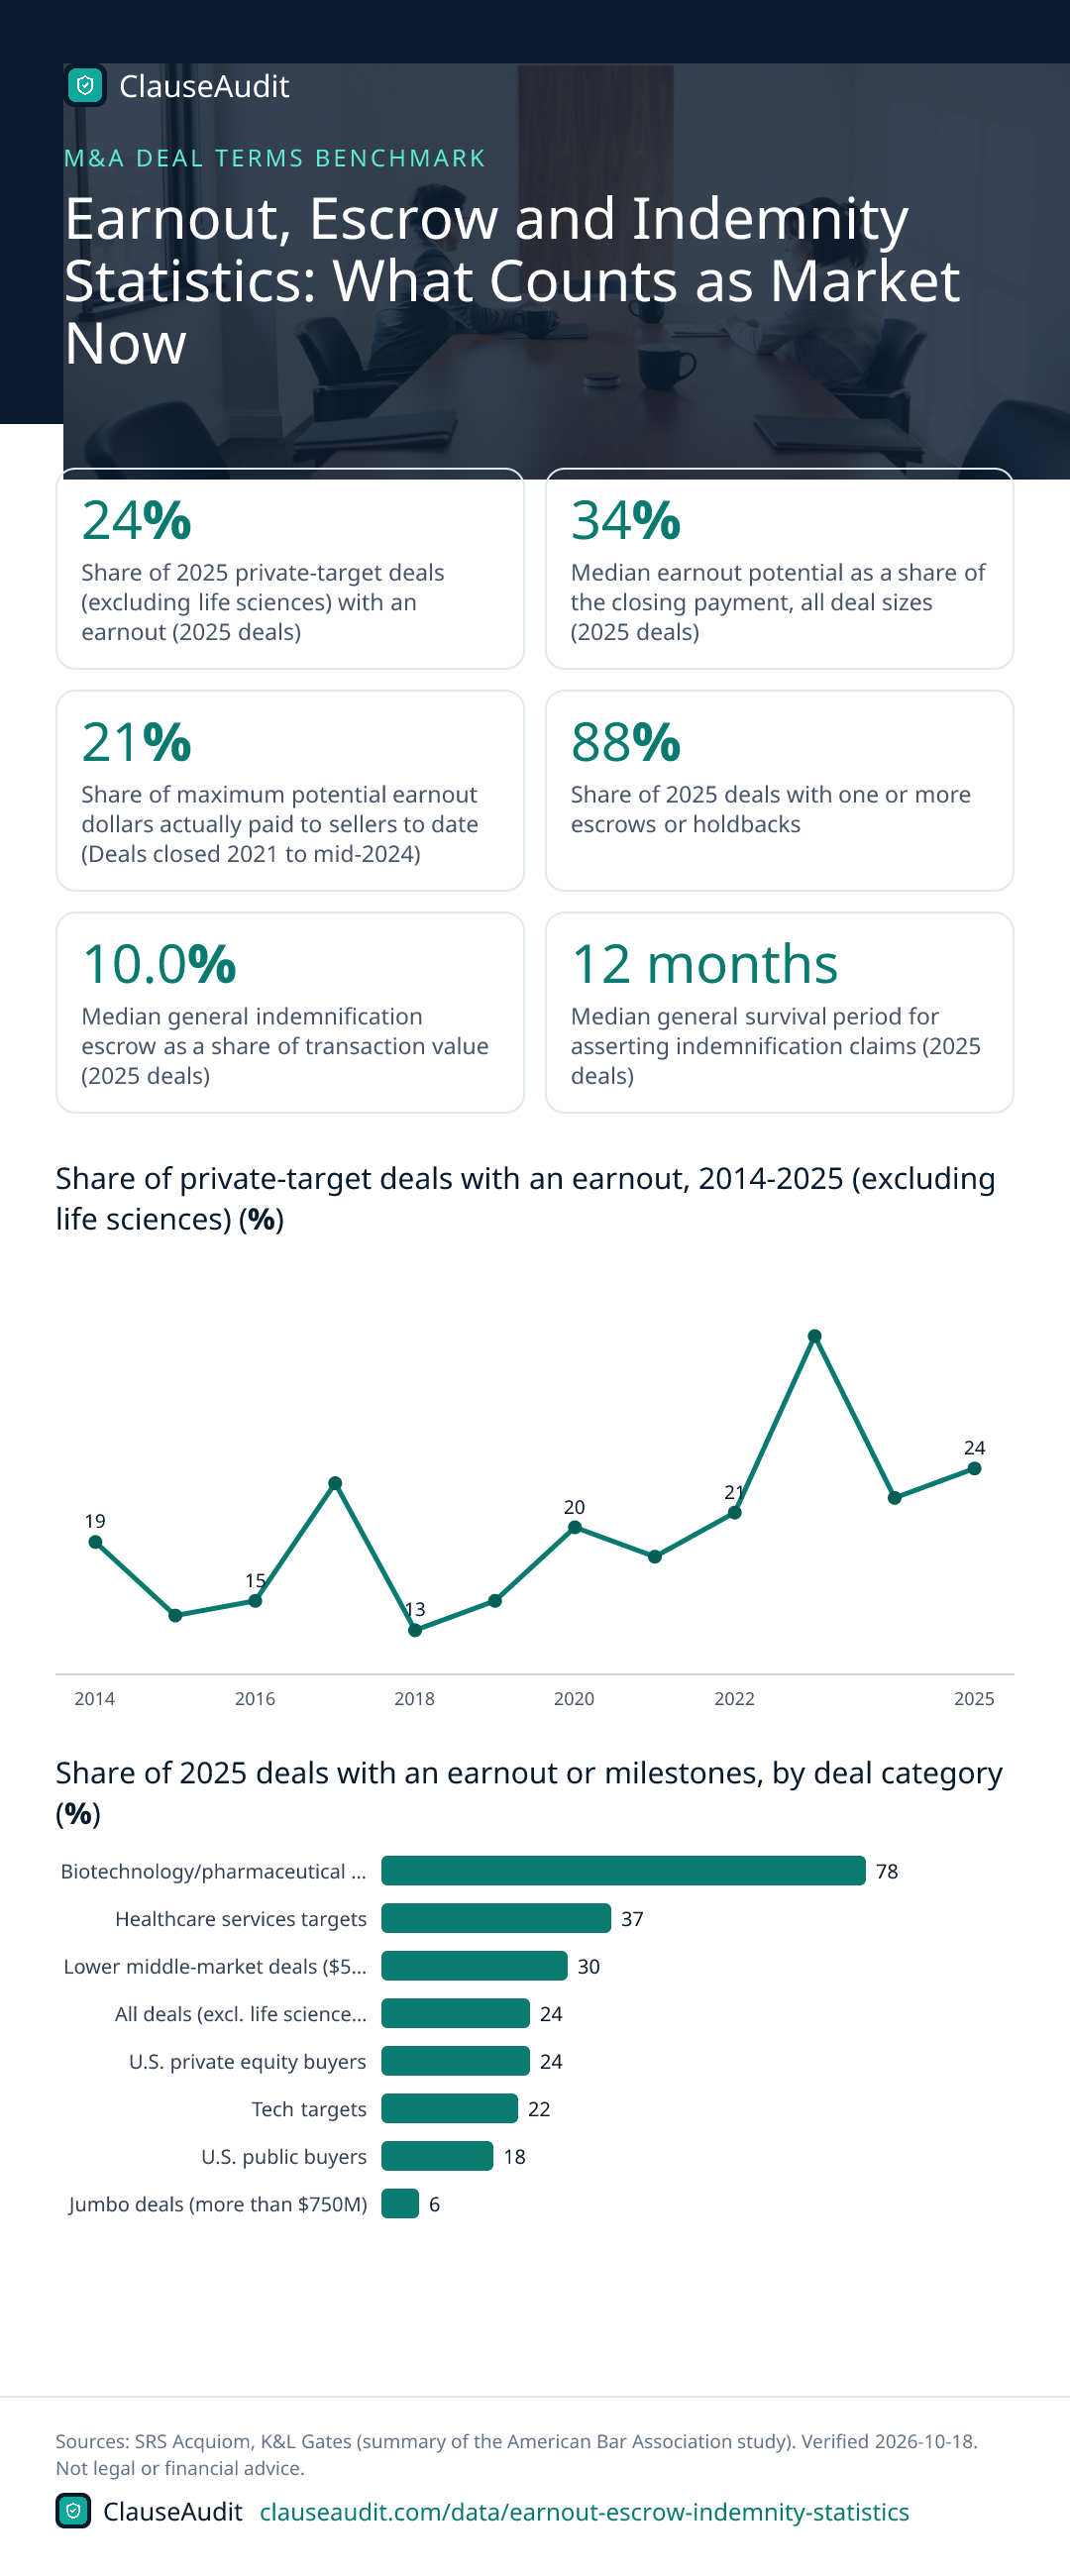
- Share of 2025 private-target deals (excluding life sciences) with an earnout (2025 deals, SRS Acquiom)
- 24%
- Median earnout potential as a share of the closing payment, all deal sizes (2025 deals, SRS Acquiom)
- 34%
- Share of maximum potential earnout dollars actually paid to sellers to date (Deals closed 2021 to mid-2024, SRS Acquiom)
- 21%
- Share of 2025 deals with one or more escrows or holdbacks (2025 deals, SRS Acquiom)
- 88%
- Median general indemnification escrow as a share of transaction value (2025 deals, SRS Acquiom)
- 10.0%
- Median general survival period for asserting indemnification claims (2025 deals, SRS Acquiom)
- 12 months
- Share of all deals with indemnification claims, excluding purchase price adjustments (2026 study, SRS Acquiom)
- 28%
- Share of deals with earnouts in the 2025 ABA Deal Points Study (Deals in the 2025 ABA study sample (period as defined by the ABA; not stated in the K&L Gates summary), K&L Gates (summary of the American Bar Association study))
- 18%
When a buyer and seller can't agree on what a company is worth, they usually split the difference with paper. Part of the price waits in an earnout. Part sits in escrow. And the seller signs an indemnity promising to pay back money if the reps turn out wrong. These three terms decide how much of the headline price you actually keep.
The numbers below come mostly from SRS Acquiom, which acts as shareholder representative on thousands of private deals, with a cross-check from the 2025 ABA Deal Points Study. They describe mid-market and larger deals, so a small business sale won't match them exactly. They still give you a fair read on what a buyer's lawyer will call market, and where you have room to push back.
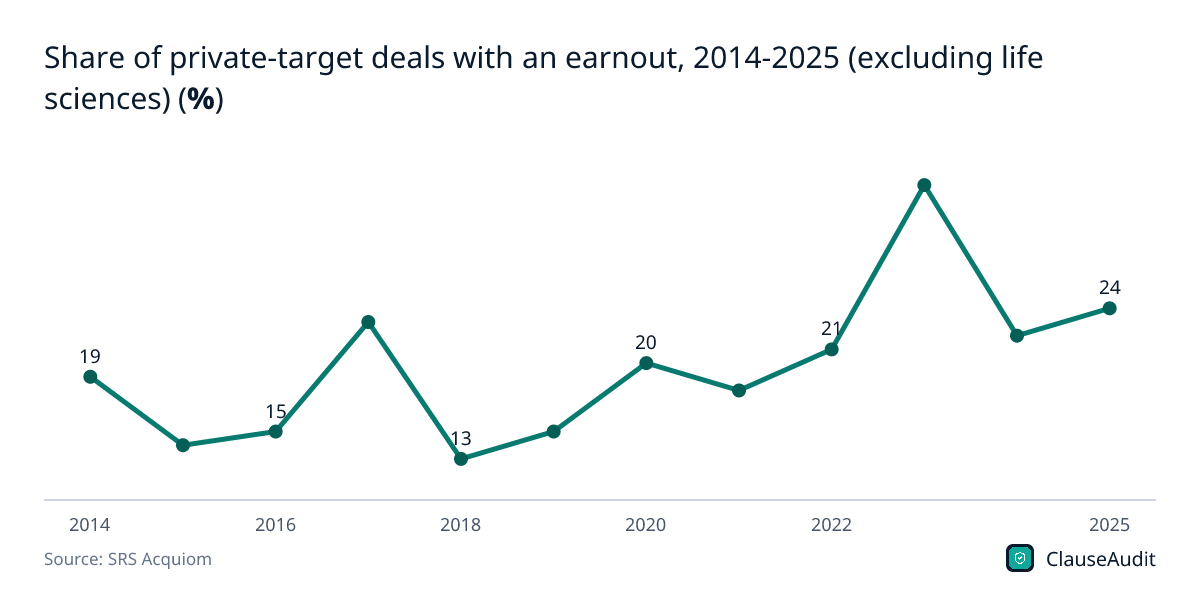
Share of private-target deals with an earnout, 2014-2025 (excluding life sciences) (%)
Chart data
| Label | Value (%) |
|---|---|
| 2014 | 19 |
| 2015 | 14 |
| 2016 | 15 |
| 2017 | 23 |
| 2018 | 13 |
| 2019 | 15 |
| 2020 | 20 |
| 2021 | 18 |
| 2022 | 21 |
| 2023 | 33 |
| 2024 | 22 |
| 2025 | 24 |
Earnouts peaked at 33% of deals in 2023. Earnouts eased to 22% in 2024 and edged up to 24% in 2025, still well above most years before 2020.
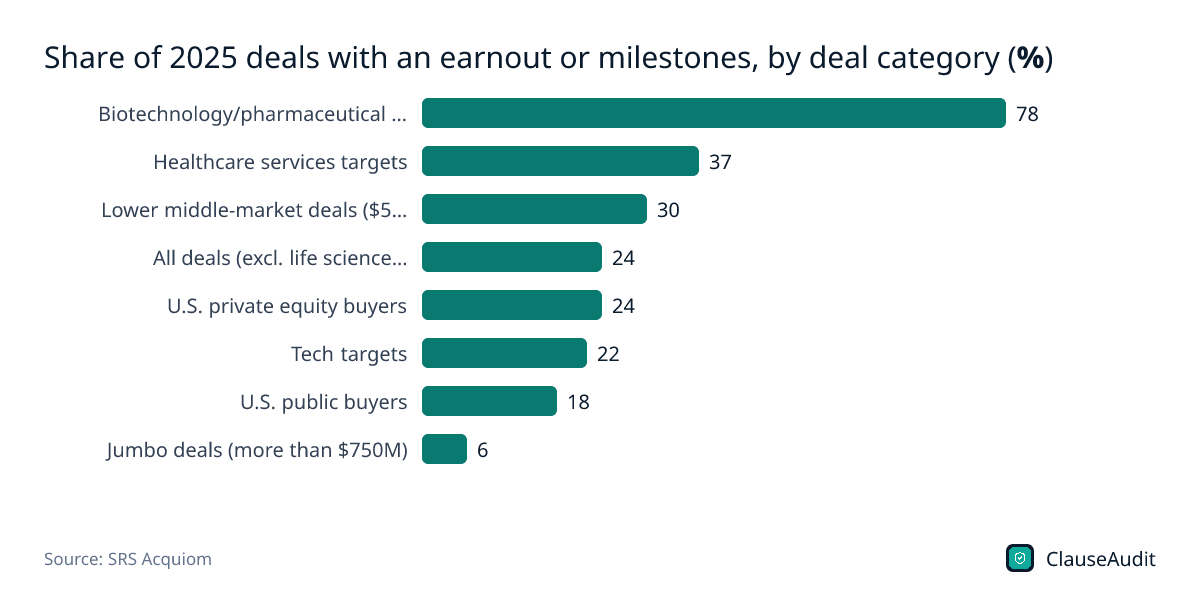
Download this chart (PNG)Share of 2025 deals with an earnout or milestones, by deal category (%)
Chart data
| Label | Value |
|---|---|
| Biotechnology/pharmaceutical targets | 78 |
| Healthcare services targets | 37 |
| Lower middle-market deals ($50M or less) | 30 |
| All deals (excl. life sciences) | 24 |
| U.S. private equity buyers | 24 |
| Tech targets | 22 |
| U.S. public buyers | 18 |
| Jumbo deals (more than $750M) | 6 |
Biotech and pharma deals lead at 78% because drug milestones are a natural earnout trigger. At the other end, only 6% of jumbo deals over $750M used one, so the smaller the deal, the more likely you are to see contingent pay.
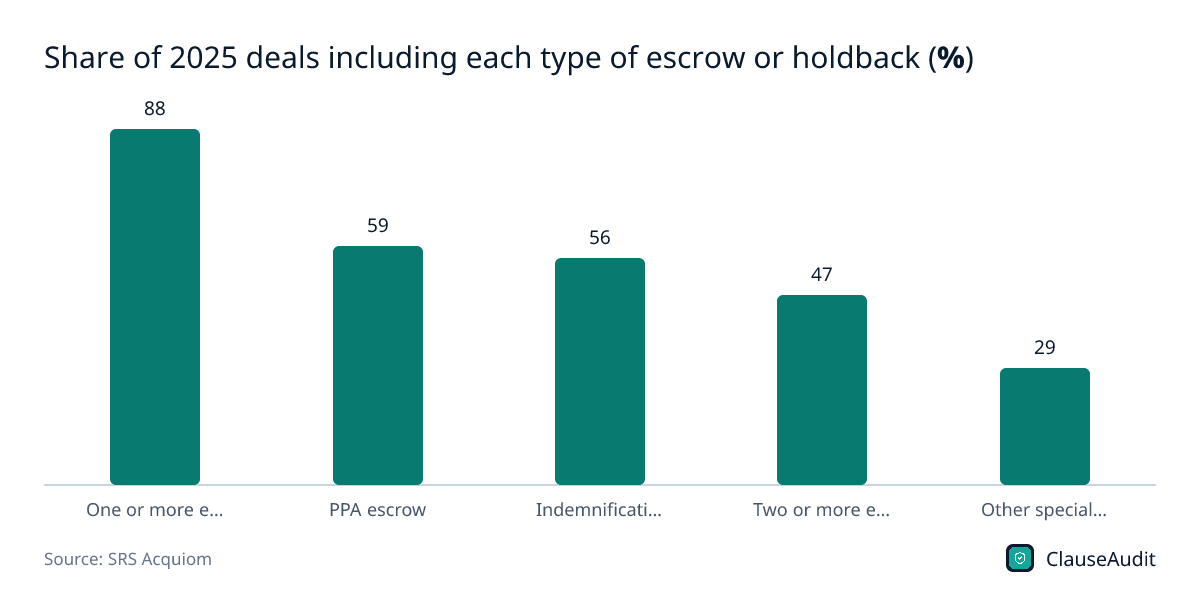
Download this chart (PNG)Share of 2025 deals including each type of escrow or holdback (%)
Chart data
| Label | Value (%) |
|---|---|
| One or more escrows | 88 |
| PPA escrow | 59 |
| Indemnification escrow | 56 |
| Two or more escrows | 47 |
| Other special escrow(s) | 29 |
A purchase price adjustment escrow (59%) is now slightly more common than an indemnification escrow (56%). Nearly half of deals, 47%, carried two or more escrows, so expect money held back for more than one reason.
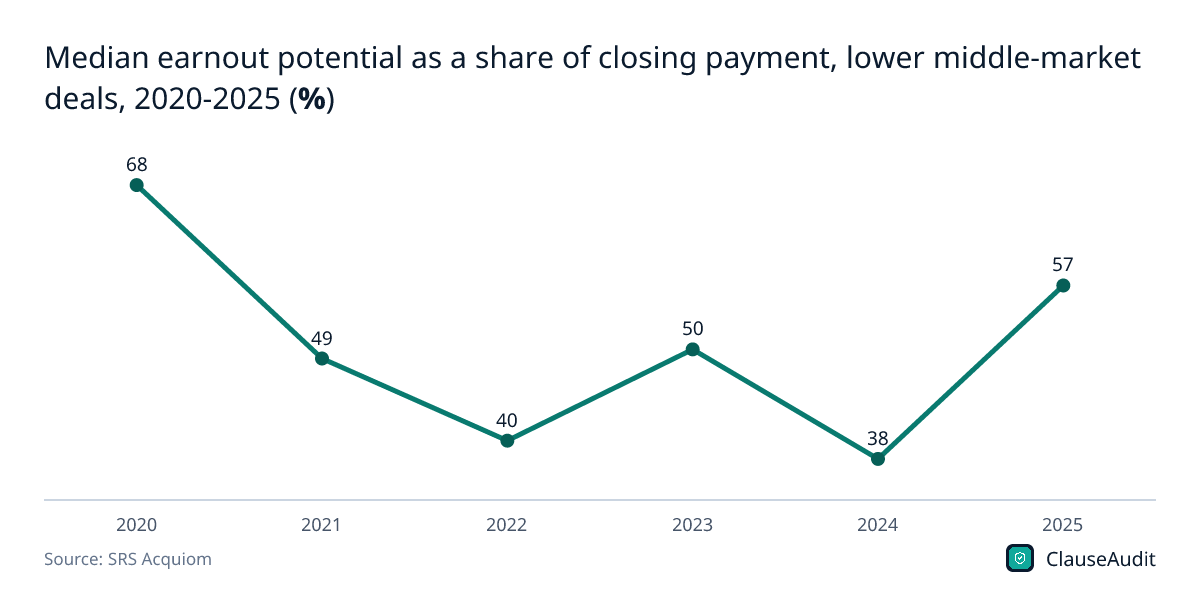
Download this chart (PNG)Median earnout potential as a share of closing payment, lower middle-market deals, 2020-2025 (%)
Chart data
| Label | Value (%) |
|---|---|
| 2020 | 68 |
| 2021 | 49 |
| 2022 | 40 |
| 2023 | 50 |
| 2024 | 38 |
| 2025 | 57 |
In lower middle-market deals the earnout can be a big slice of the price. The 2025 median was 57% of the closing payment, against 34% across all deal sizes.
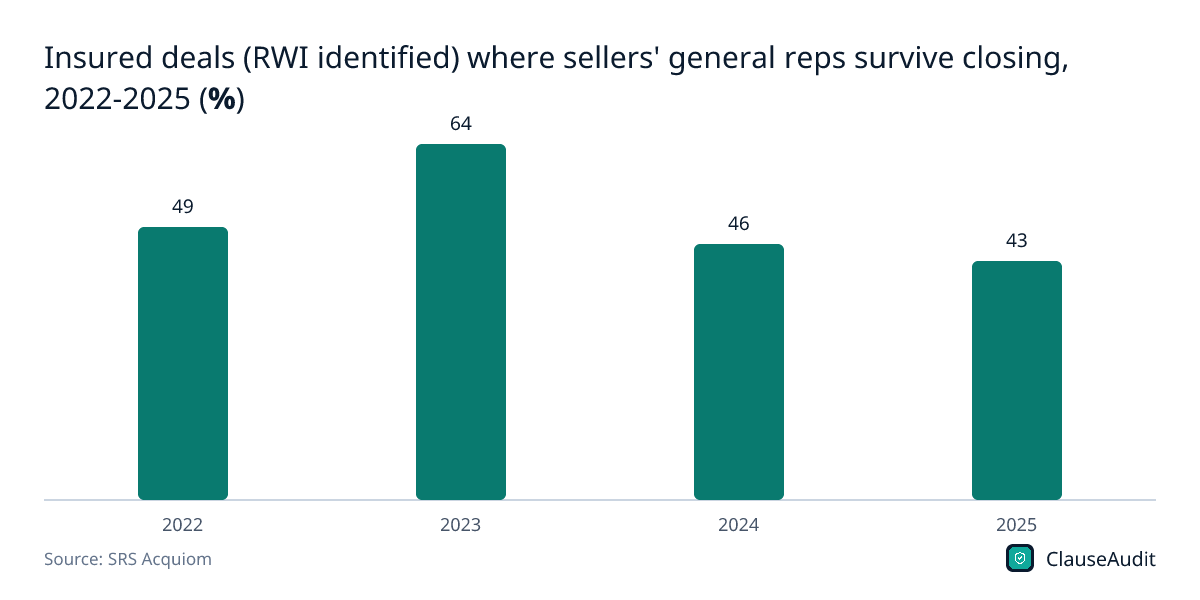
Download this chart (PNG)Insured deals (RWI identified) where sellers' general reps survive closing, 2022-2025 (%)
Chart data
| Label | Value (%) |
|---|---|
| 2022 | 49 |
| 2023 | 64 |
| 2024 | 46 |
| 2025 | 43 |
Insurance has not fully freed sellers. In 2025, general reps still survived closing in 43% of insured deals, compared with 89% of deals with no RWI identified.
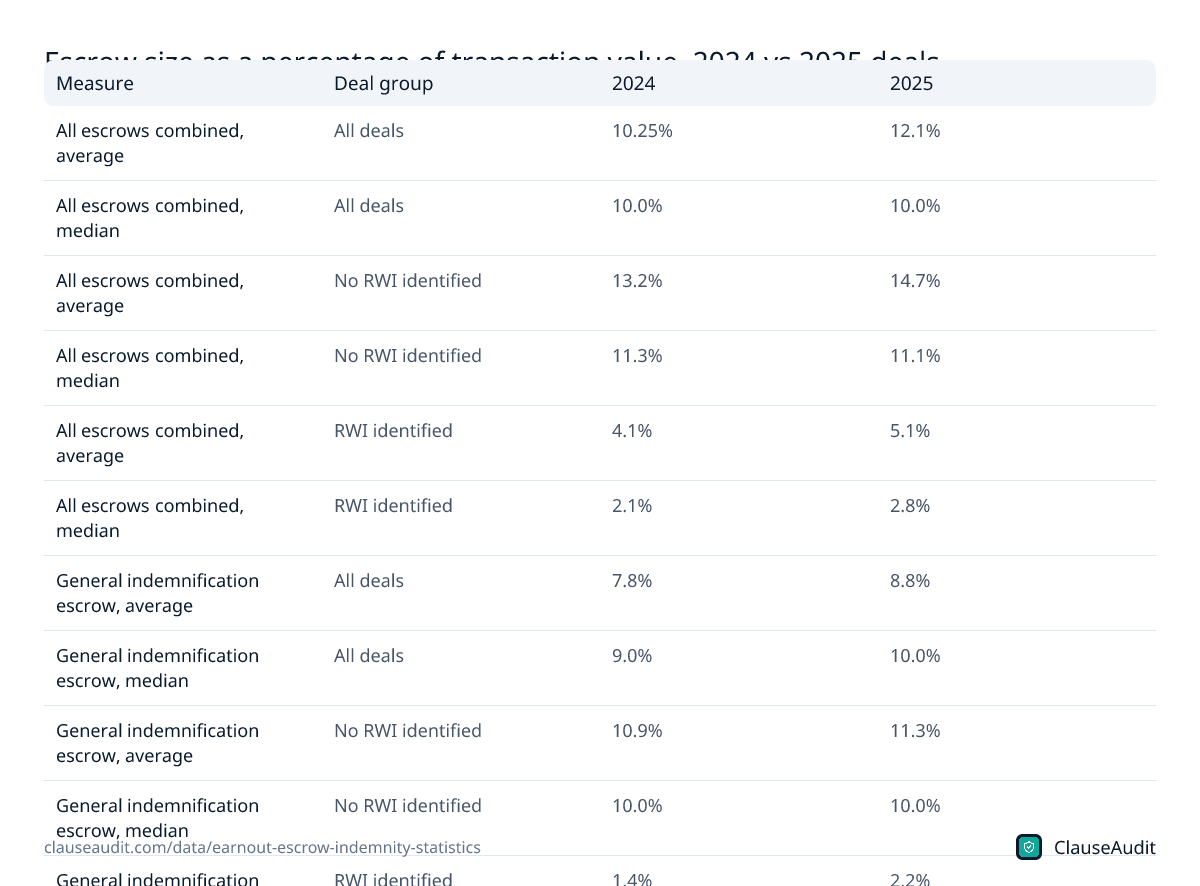
Download this chart (PNG)Escrow size as a percentage of transaction value, 2024 vs 2025 deals
| Measure | Deal group | 2024 | 2025 |
|---|---|---|---|
| All escrows combined, average | All deals | 10.25% | 12.1% |
| All escrows combined, median | All deals | 10.0% | 10.0% |
| All escrows combined, average | No RWI identified | 13.2% | 14.7% |
| All escrows combined, median | No RWI identified | 11.3% | 11.1% |
| All escrows combined, average | RWI identified | 4.1% | 5.1% |
| All escrows combined, median | RWI identified | 2.1% | 2.8% |
| General indemnification escrow, average | All deals | 7.8% | 8.8% |
| General indemnification escrow, median | All deals | 9.0% | 10.0% |
| General indemnification escrow, average | No RWI identified | 10.9% | 11.3% |
| General indemnification escrow, median | No RWI identified | 10.0% | 10.0% |
| General indemnification escrow, average | RWI identified | 1.4% | 2.2% |
| General indemnification escrow, median | RWI identified | 0.35% | 0.5% |
Source: SRS Acquiom, Six Key Findings from the 2026 M&A Deal Terms Study; SRS Acquiom, Deal Terms for M&A Escrows (2026). Download as image
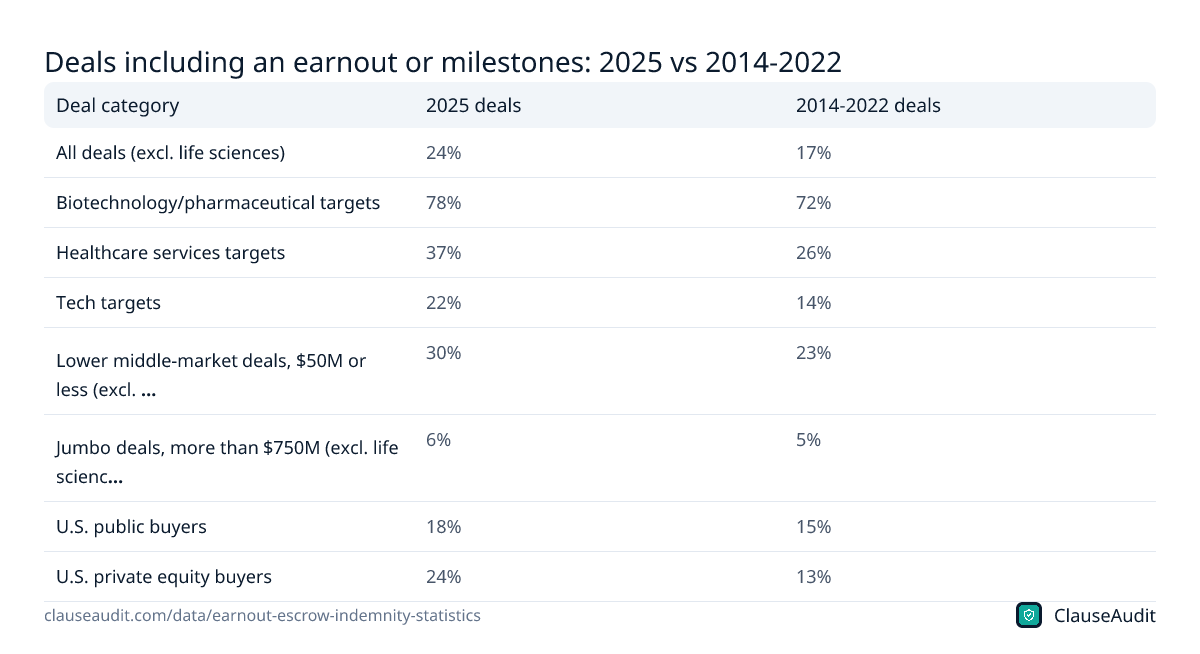
Deals including an earnout or milestones: 2025 vs 2014-2022
| Deal category | 2025 deals | 2014-2022 deals |
|---|---|---|
| All deals (excl. life sciences) | 24% | 17% |
| Biotechnology/pharmaceutical targets | 78% | 72% |
| Healthcare services targets | 37% | 26% |
| Tech targets | 22% | 14% |
| Lower middle-market deals, $50M or less (excl. life sciences) | 30% | 23% |
| Jumbo deals, more than $750M (excl. life sciences) | 6% | 5% |
| U.S. public buyers | 18% | 15% |
| U.S. private equity buyers | 24% | 13% |
Source: SRS Acquiom, M&A Earnout and Milestone Trends (drawing on the 2026 SRS Acquiom M&A Deal Terms Study and other SRS Acquiom studies). Download as image
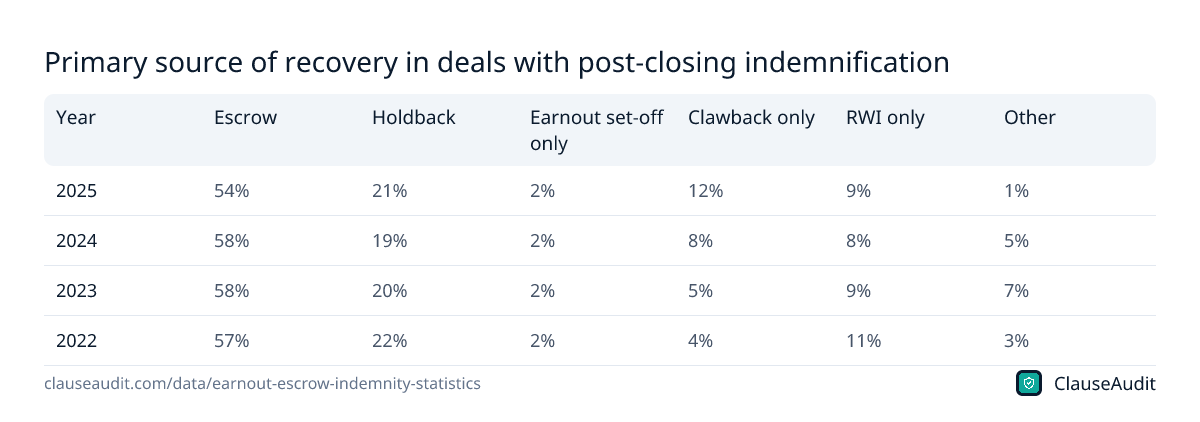
Primary source of recovery in deals with post-closing indemnification
| Year | Escrow | Holdback | Earnout set-off only | Clawback only | RWI only | Other |
|---|---|---|---|---|---|---|
| 2025 | 54% | 21% | 2% | 12% | 9% | 1% |
| 2024 | 58% | 19% | 2% | 8% | 8% | 5% |
| 2023 | 58% | 20% | 2% | 5% | 9% | 7% |
| 2022 | 57% | 22% | 2% | 4% | 11% | 3% |
Source: SRS Acquiom, Six Key Findings from the 2026 M&A Deal Terms Study. Download as image
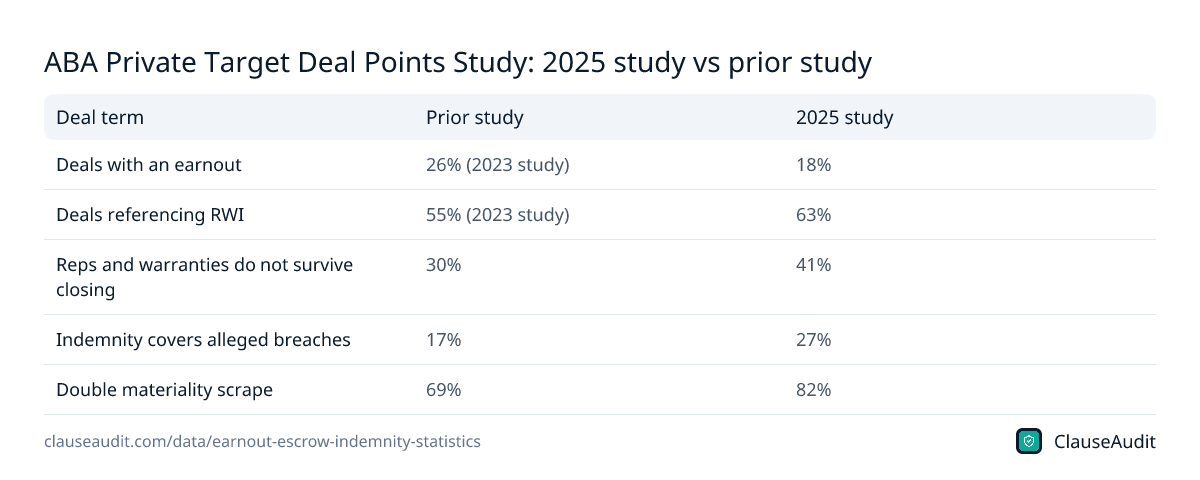
ABA Private Target Deal Points Study: 2025 study vs prior study
| Deal term | Prior study | 2025 study |
|---|---|---|
| Deals with an earnout | 26% (2023 study) | 18% |
| Deals referencing RWI | 55% (2023 study) | 63% |
| Reps and warranties do not survive closing | 30% | 41% |
| Indemnity covers alleged breaches | 17% | 27% |
| Double materiality scrape | 69% | 82% |
Source: K&L Gates (summary of the American Bar Association study), 2025 ABA Private Target Mergers & Acquisitions Deal Points Study (summary). Download as image
How common are earnouts in recent deals?
More common than they used to be. SRS Acquiom says historical norms sat closer to 15%, and the 2025 figure was 24% of private-target deals outside life sciences. Across its 2014 to 2022 deals, the rate was 17%. So if a buyer offers you an earnout today, they are not being unusual.
The ABA study, built on a different sample of 139 publicly available private-target acquisition agreements with prices from US$25 million to US$900 million, found earnouts in 18% of deals in its 2025 study, down from 26% in its 2023 study. The two sources don't contradict each other. They just look at different deals.
Who uses them matters. U.S. private equity buyers put earnouts in 24% of 2025 deals, up from 13% across 2014 to 2022. Healthcare services targets hit 37% and tech targets 22%. If you are selling a smaller company, the lower middle-market rate of 30% is the closer benchmark.
How much of an earnout actually gets paid?
This is the number sellers should tape to the wall. Across 100 private-target deals with earnouts closed from 2021 to mid-2024, sellers had received 21% of the maximum potential earnout dollars. Some money came through on 59% of those deals, but often only a partial payment.
Put that next to the size of the promise. The median earnout potential in 2025 was 34% of the closing payment across all deal sizes, and 57% in lower middle-market deals. A seller who counts the full earnout as part of the price is often counting money that never shows up.
Why the gap? Targets get set high to bridge a valuation dispute. The buyer controls the business after closing and can change pricing, staff or accounting in ways that move the metric. And revenue or EBITDA definitions leave room for argument. If you are a seller, value the earnout as a maybe and negotiate the cash at closing as if it were the real price.
A concrete example helps. Say your deal promises an earnout worth 57% of the closing payment, the 2025 lower middle-market median, tied to revenue growth. The buyer folds your sales team into its own and books some of your customers under its brand. Your revenue line drops on paper even though the customers stayed. Without a clause that fixes how revenue is counted, you are left arguing after the fact with not much to bargain with.
What is a normal escrow or holdback in a business sale?
Some kind of escrow or holdback appeared in 88% of 2025 deals. Across all deals, the median for all escrows combined was 10.0% of transaction value in both 2024 and 2025. The general indemnification escrow, for deals that had one, had a median of 10.0% and an average of 8.8% in 2025.
Insurance changes the picture sharply. On deals with representations and warranties insurance (RWI) identified, the median indemnification escrow was 0.5% in 2025. Without RWI, it was 10.0%. Indemnification escrows showed up in 76% of uninsured deals versus 33% of insured ones.
For a seller, this means a buyer asking for a 10% indemnity escrow is asking for something ordinary, not aggressive. Going well above that should come with a reason tied to a specific risk. If the buyer is also buying an RWI policy, a full-size escrow on top is hard to justify, and you can point to the 0.5% median when you push back.
Buyers should read the same numbers the other way. If you are buying a small company without insurance, a 10.0% indemnity escrow is a normal ask, and walking away with nothing held back leaves you chasing the seller personally if a problem turns up. Pair the escrow with a release date that matches the survival period so the money is still there when a claim is most likely.
How long do sellers stay on the hook for indemnity claims?
The median general survival period for indemnity claims was 12 months in 2025, and it has been 12 months every year from 2021 to 2025. The 2025 average was 13.2 months. That is the window in which the buyer can say a rep was wrong and come after the escrow.
Claims are not rare. In the 2026 SRS Acquiom study, 28% of all deals had indemnification claims beyond purchase price adjustments, and 33% of insured deals did. Tax reps drove 38% of indemnity claims, which is why buyers press hard on tax disclosure schedules.
When a claim lands, escrow pays first. In 2025, escrow was the primary source of recovery in 54% of deals with post-closing indemnification, holdbacks in 21%, and clawbacks from the sellers in 12%. A clawback means writing a check after you thought the money was yours, so it is worth capping.
The ABA data shows the same pressure from the other side. In its 2025 study, 41% of deals said reps and warranties do not survive closing, up from 30% in the prior study. Meanwhile 82% used a double materiality scrape, up from 69%, which makes it easier for a buyer to prove a breach. Sellers are winning on survival and losing on how breaches are measured.
What to do before you sign a purchase agreement
If you are buying a small company or selling the one you built, read these terms as one package. The earnout, the escrow and the indemnity all decide the same thing: how much of the price is actually final at closing.
- Write the earnout metric down to the line item. Say which accounting rules apply, what costs count, and who prepares the statement.
- Ask for operating covenants. The buyer should not be free to starve the business of staff or budget during the earnout period.
- Add an acceleration clause so the full earnout pays if the buyer sells the business or breaches its covenants.
- Compare the escrow to the 10.0% median and ask what risk justifies anything higher. If there is an RWI policy, ask why a large escrow is still needed.
- Check the survival period against the 12-month median, and look for longer carve-outs for tax or fundamental reps.
- Make the escrow the sole source of recovery for general rep breaches, and cap total indemnity so a clawback can't reach the full price.
- Check whether the buyer can set off indemnity claims against earnout payments. Set-off was the main recovery source in only 2% of 2025 deals with indemnity recoveries, but one disputed claim could freeze your earnout.
How ClauseAudit helps
Earnouts, escrows and indemnity sections are long, cross-referenced and easy to misread. Our automated review of a business purchase agreement reads them together and flags the terms that move money away from you after closing.
Upload a letter of intent or a draft asset or stock purchase agreement and you get a plain-English list of what to question, with suggested wording to bring back to the other side.
- Earnout definitions: metric, accounting rules, measurement period and who controls the books
- Buyer operating covenants and acceleration on a sale or breach
- Escrow and holdback size, release dates and what the funds can be used for
- Indemnity caps, baskets and whether the escrow is the sole source of recovery
- Survival periods for general, tax and fundamental reps
- Set-off rights against earnout or seller note payments
Frequently asked questions
What percentage of deals have an earnout?
In SRS Acquiom's dataset, 24% of 2025 private-target deals outside life sciences included an earnout, up from 22% in 2024 and below the 2023 peak of 33%. The 2025 ABA Deal Points Study, which uses a different sample of publicly available agreements, found earnouts in 18% of deals.
Do sellers usually get their earnout?
Often not in full. Across 100 private-target deals with earnouts closed from 2021 to mid-2024, sellers had received 21% of the maximum potential earnout dollars. 59% of those deals paid something, but many payments were partial. Treat the earnout as upside and negotiate hard on the cash paid at closing.
How big is a typical earnout compared with the price?
In 2025 the median earnout potential was 34% of the closing payment across all deal sizes. For lower middle-market deals with $50 million or less paid upfront, it was 57%. So in smaller deals a large share of the headline price can depend on how the business performs after you hand it over.
What is a normal indemnification escrow?
For 2025 deals that had one, the median general indemnification escrow was 10.0% of transaction value, with an average of 8.8%. On deals with representations and warranties insurance identified, the median dropped to 0.5%. Indemnification escrows appeared in 56% of all 2025 deals.
How long is the indemnity survival period?
The median general survival period was 12 months in 2025, and it has held at 12 months every year since 2021. The 2025 average was 13.2 months. Tax and fundamental reps often run longer, so read the carve-outs, not just the headline period.
How often do buyers make indemnity claims?
In the 2026 SRS Acquiom study, 28% of all deals had indemnification claims, not counting purchase price adjustments. For deals with RWI identified the share was 33%. Breaches of tax reps made up 38% of indemnity claims, so tax disclosures deserve extra care.
Does rep and warranty insurance remove the escrow?
It shrinks it a lot. The median general indemnification escrow on insured deals was 0.5% in 2025, versus 10.0% on deals with no RWI identified. But insurance doesn't end seller exposure entirely: general reps still survived closing in 43% of insured 2025 deals.
What is a purchase price adjustment escrow?
It holds back part of the price until the final working capital or similar figures are settled after closing. In 2025, 59% of deals had one, slightly more than the 56% with an indemnification escrow. It is separate from indemnity, so check if your deal stacks both and what each one covers.
Use this data
Every chart and card below is free to reuse under CC BY 4.0. Download what you need and link back to this page.
 Stat cards
 Key findings card
 Infographic
 Share of private-target deals with an earnout, 2014-2025 (excluding life sciences) (%)
 Share of 2025 deals with an earnout or milestones, by deal category (%)
 Share of 2025 deals including each type of escrow or holdback (%)
 Median earnout potential as a share of closing payment, lower middle-market deals, 2020-2025 (%)
 Insured deals (RWI identified) where sellers' general reps survive closing, 2022-2025 (%)
 Escrow size as a percentage of transaction value, 2024 vs 2025 deals
 Deals including an earnout or milestones: 2025 vs 2014-2022
 Primary source of recovery in deals with post-closing indemnification
 ABA Private Target Deal Points Study: 2025 study vs prior study
Embed the infographic
Free to share on your site, blog or slides under CC BY 4.0. Please keep the credit link.
Sources and method
Every number on this page comes from the sources below, each opened and read on or before October 18, 2026. A second, independent review checked every figure against its source and corrected anything that did not match. Figures that could not be confirmed were left out.
- SRS Acquiom, M&A Earnout and Milestone Trends (drawing on the 2026 SRS Acquiom M&A Deal Terms Study and other SRS Acquiom studies) (2026)
- SRS Acquiom, Six Key Findings from the 2026 M&A Deal Terms Study (2026 edition)
- SRS Acquiom, Deal Terms for M&A Escrows (2026) (2026 (linked in SRS Acquiom M&A Insights newsletter, July 14, 2026))
- SRS Acquiom, 2026 M&A Deal Terms Study Special Report: Lower Middle-Market Deals (2026)
- SRS Acquiom, 2026 M&A Deal Terms Study: key findings (2026)
- K&L Gates (summary of the American Bar Association study), 2025 ABA Private Target Mergers & Acquisitions Deal Points Study (summary) (19 December 2025)
Cite this page
ClauseAudit, “Earnout, Escrow and Indemnity Statistics: What Counts as Market Now”, updated October 18, 2026, https://clauseaudit.com/data/earnout-escrow-indemnity-statistics. Free to reuse with a link back (CC BY 4.0).
This page summarises published data and law as checked on October 18, 2026. Figures are updated as new editions are released, and your own situation may differ. It is general information, not legal, tax or financial advice.