SBA Loan Statistics 2026: 7(a) and 504 Volume, Average Loan Size and Top Lenders
By ClauseAudit Research · 6 sources ·
What do the latest SBA loan statistics show?
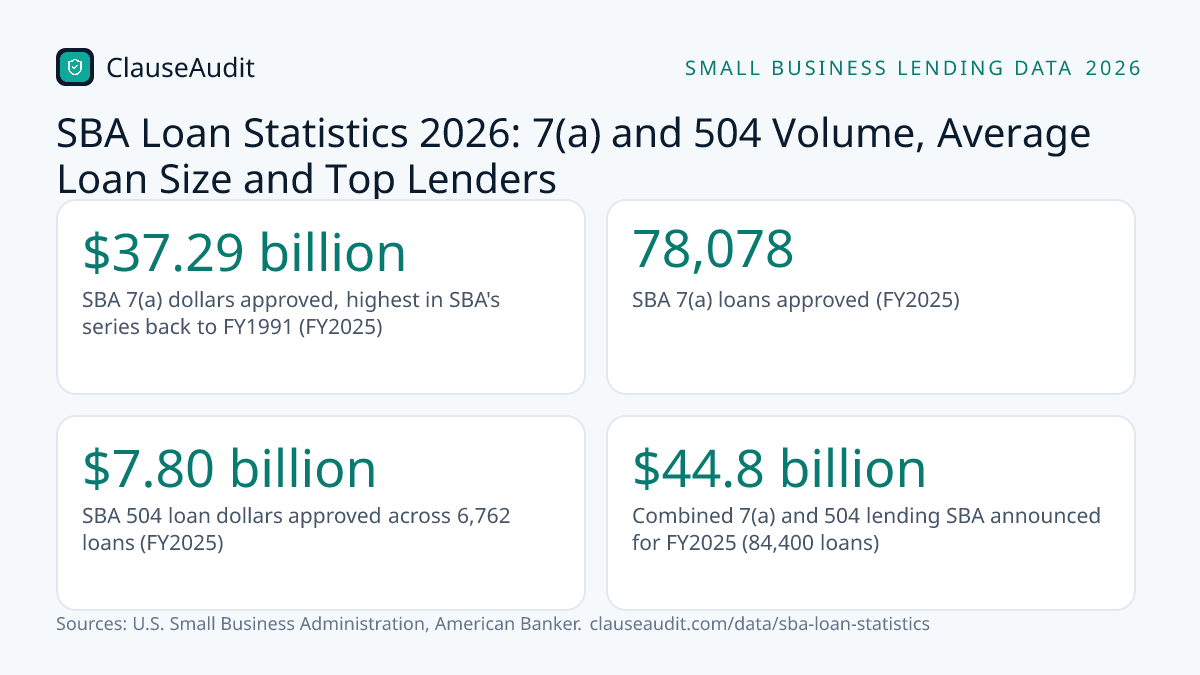
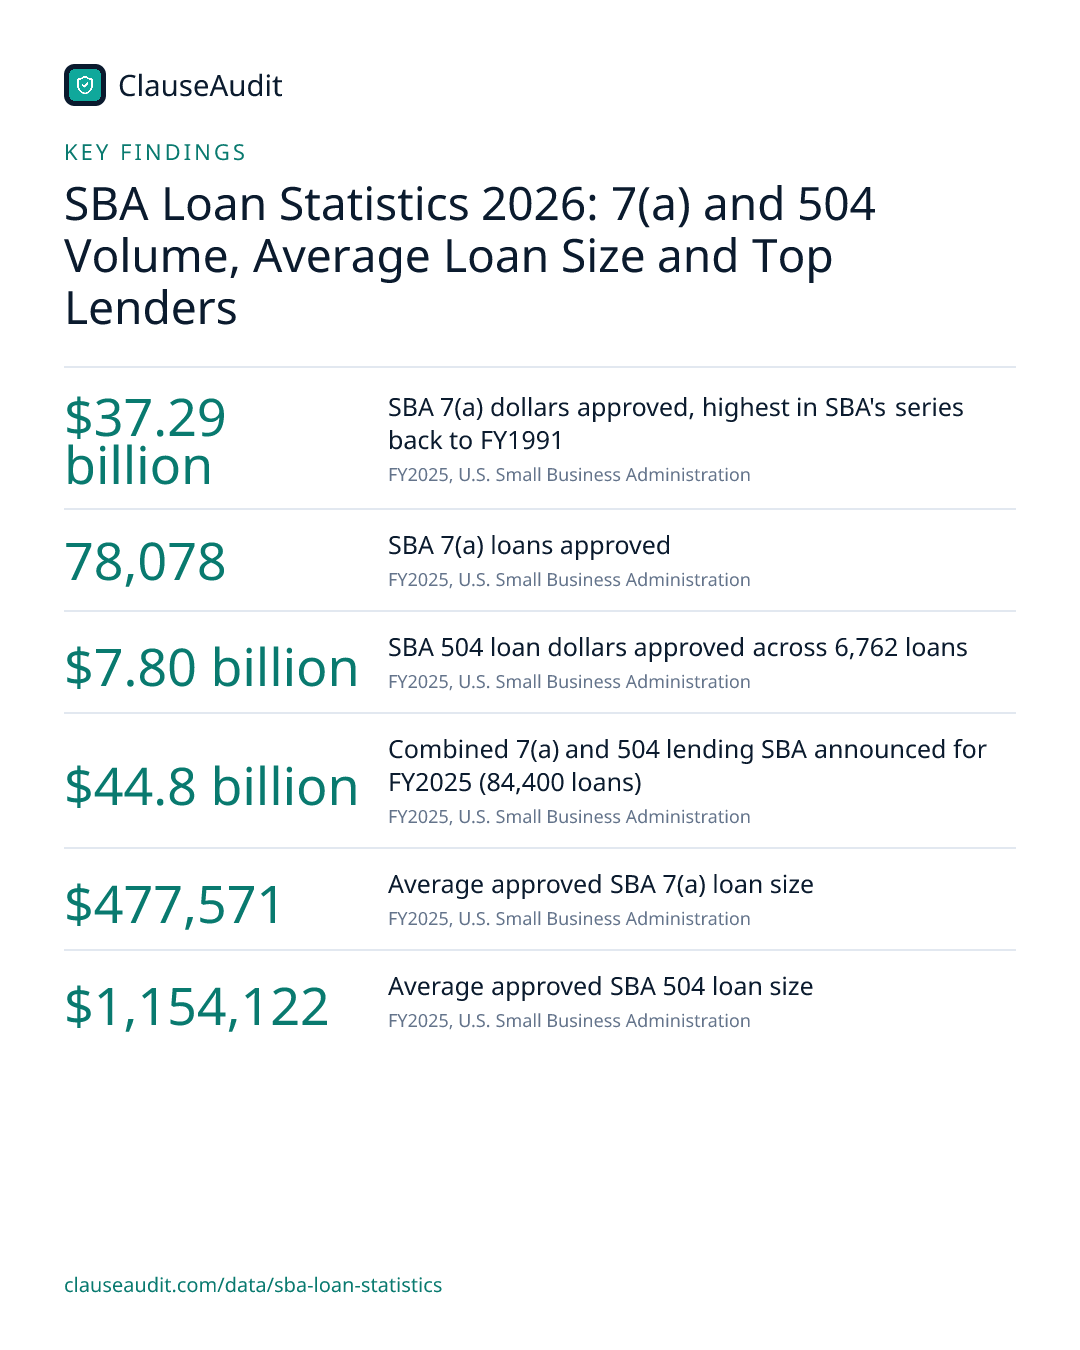
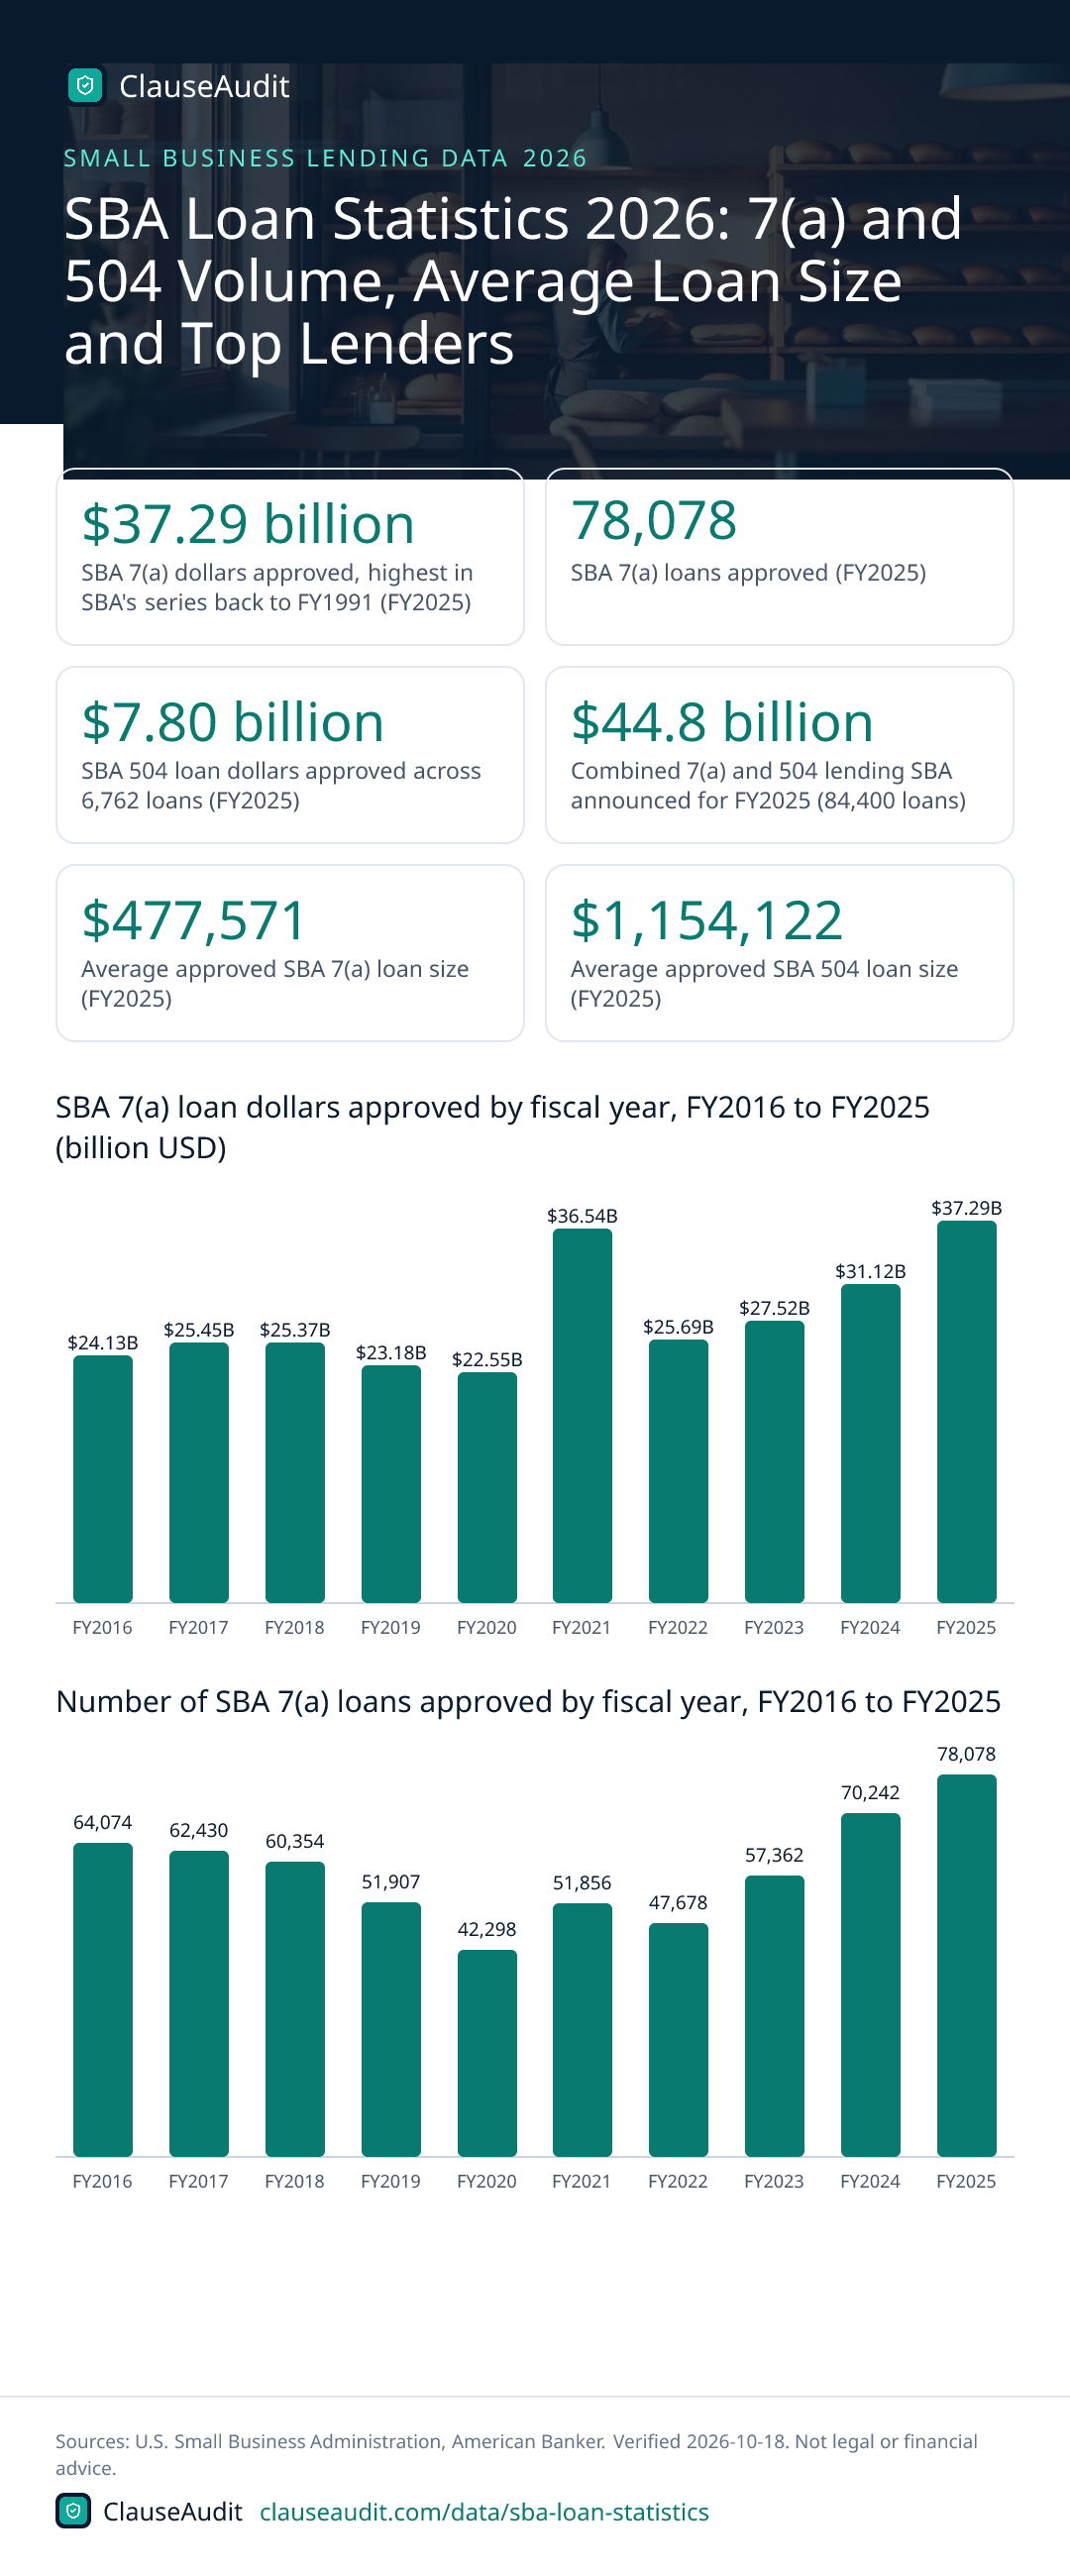
SBA lending hit a record in FY2025. The SBA approved $37.29 billion in 7(a) loans in FY2025, the highest in its series back to FY1991, across 78,078 loans. The average 7(a) loan was $477,571. The 504 program added $7.80 billion more, with an average loan of $1,154,122.

- SBA 7(a) dollars approved, highest in SBA's series back to FY1991 (FY2025, U.S. Small Business Administration)
- $37.29 billion
- SBA 7(a) loans approved (FY2025, U.S. Small Business Administration)
- 78,078
- SBA 504 loan dollars approved across 6,762 loans (FY2025, U.S. Small Business Administration)
- $7.80 billion
- Combined 7(a) and 504 lending SBA announced for FY2025 (84,400 loans) (FY2025, U.S. Small Business Administration)
- $44.8 billion
- Average approved SBA 7(a) loan size (FY2025, U.S. Small Business Administration)
- $477,571
- Average approved SBA 504 loan size (FY2025, U.S. Small Business Administration)
- $1,154,122
- Live Oak Banking Company, the largest SBA 7(a) lender by dollars (FY2025, U.S. Small Business Administration)
- $2.85 billion
- SBA 7(a) loan dollars approved across 56,130 loans (FY2026, American Banker)
- $32.4 billion
The SBA doesn't lend you the money itself. A bank or another approved lender makes the loan, and the SBA guarantees part of it, so the lender takes a smaller hit if you stop paying. That guarantee is why banks will say yes to businesses they'd otherwise turn away, and it's why the yearly numbers tell you a lot about how open the credit window really is.
FY2025 was a big year. The 7(a) program approved $37.29 billion across 78,078 loans, beating the old FY2021 high of $36.54B, which was boosted by pandemic-era guaranties. The 504 program, built for real estate and heavy equipment, approved $7.80 billion across 6,762 loans. Below, you'll see what those numbers mean if you're about to apply.
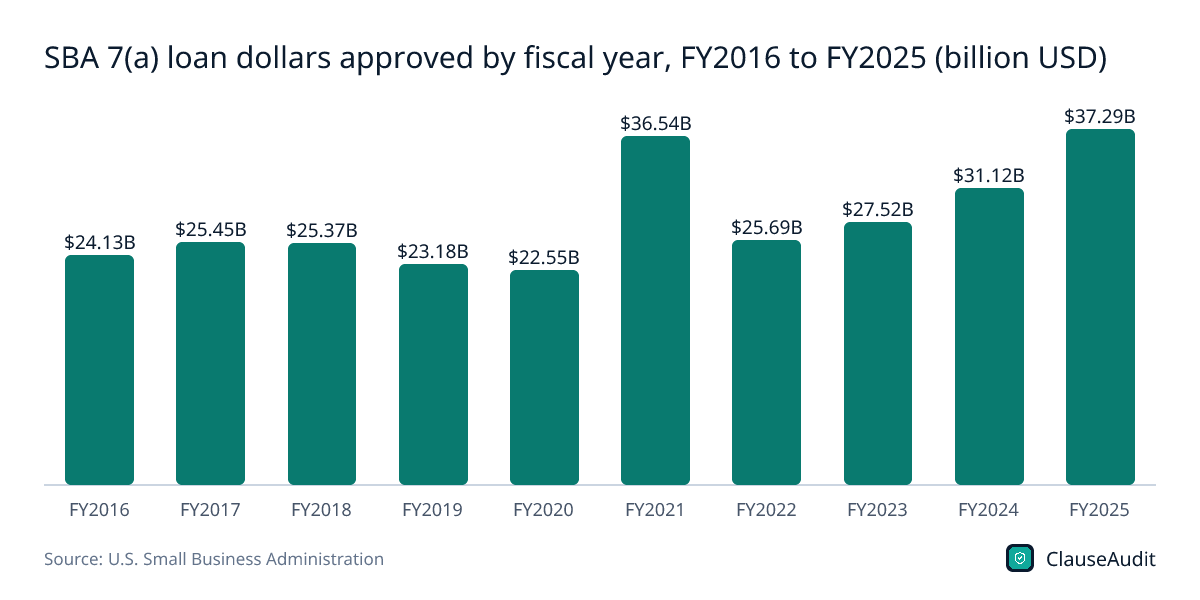
SBA 7(a) loan dollars approved by fiscal year, FY2016 to FY2025 (billion USD)
Chart data
| Label | Value (billion USD) |
|---|---|
| FY2016 | $24.13B |
| FY2017 | $25.45B |
| FY2018 | $25.37B |
| FY2019 | $23.18B |
| FY2020 | $22.55B |
| FY2021 | $36.54B |
| FY2022 | $25.69B |
| FY2023 | $27.52B |
| FY2024 | $31.12B |
| FY2025 | $37.29B |
Dollars sat in a narrow band through FY2020, jumped in FY2021 on pandemic support, then fell back to $25.69B in FY2022. The climb since then came without pandemic-era guaranties, which is why the FY2025 record stands out.
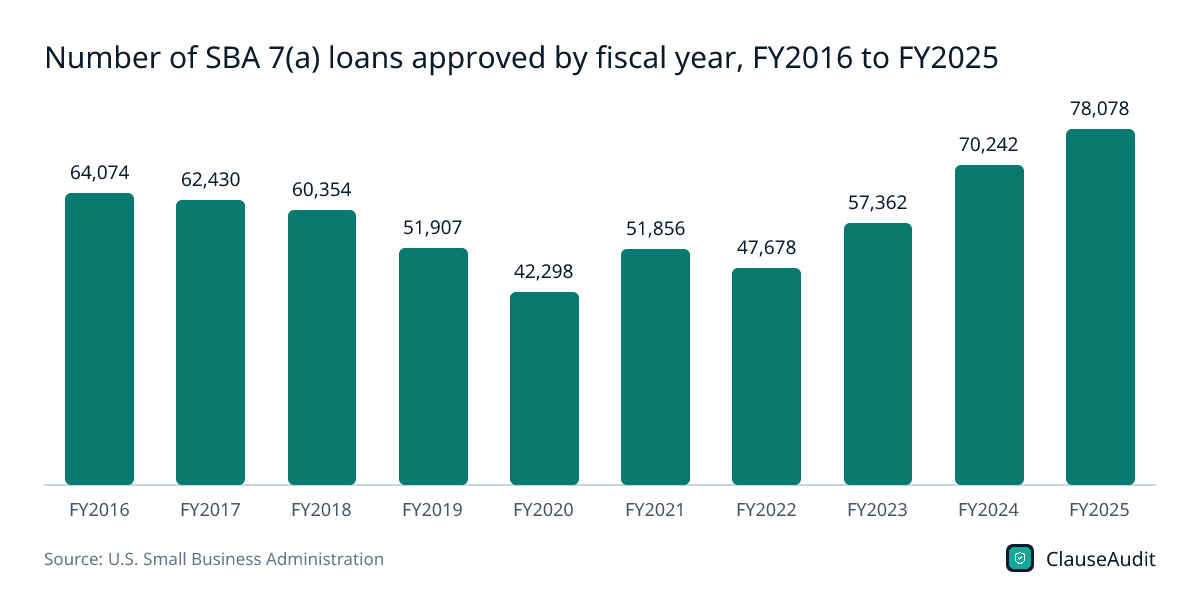
Download this chart (PNG)Number of SBA 7(a) loans approved by fiscal year, FY2016 to FY2025
Chart data
| Label | Value |
|---|---|
| FY2016 | 64,074 |
| FY2017 | 62,430 |
| FY2018 | 60,354 |
| FY2019 | 51,907 |
| FY2020 | 42,298 |
| FY2021 | 51,856 |
| FY2022 | 47,678 |
| FY2023 | 57,362 |
| FY2024 | 70,242 |
| FY2025 | 78,078 |
Loan counts bottomed at 42,298 in FY2020, dipped again to 47,678 in FY2022, and have risen every year since, reaching 78,078 in FY2025. More loans means more small borrowers getting through, not just a few big deals pushing the dollar total up.
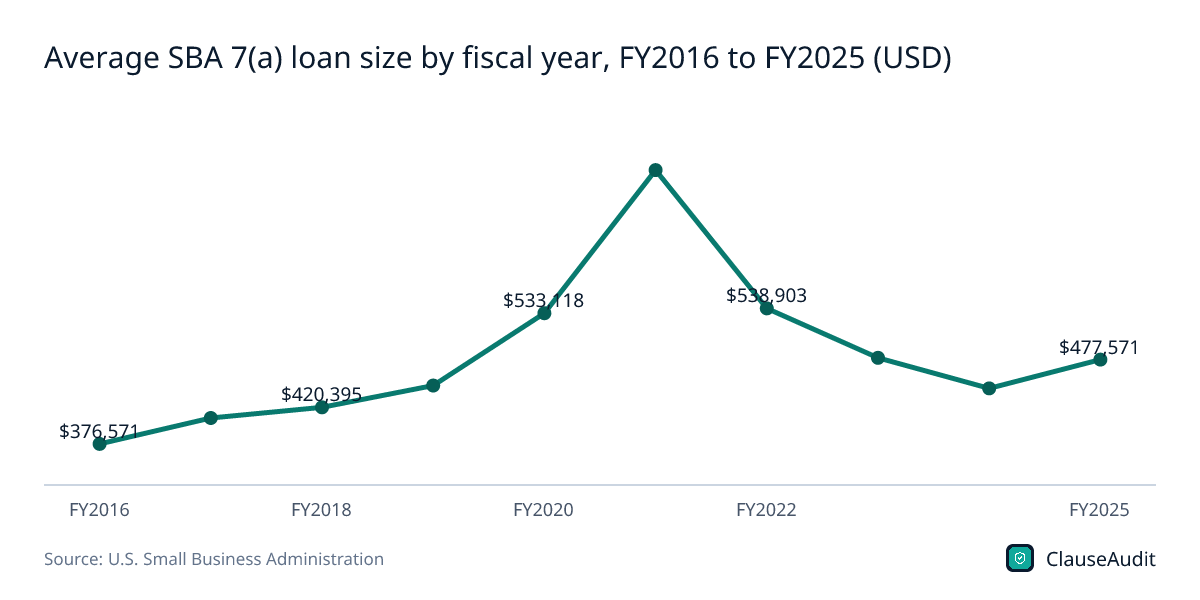
Download this chart (PNG)Average SBA 7(a) loan size by fiscal year, FY2016 to FY2025 (USD)
Chart data
| Label | Value (USD) |
|---|---|
| FY2016 | $376,571 |
| FY2017 | $407,616 |
| FY2018 | $420,395 |
| FY2019 | $446,487 |
| FY2020 | $533,118 |
| FY2021 | $704,581 |
| FY2022 | $538,903 |
| FY2023 | $479,685 |
| FY2024 | $443,097 |
| FY2025 | $477,571 |
The average 7(a) loan spiked to $704,581 in FY2021 and has settled since. At $477,571 in FY2025, it's close to the FY2023 level of $479,685.
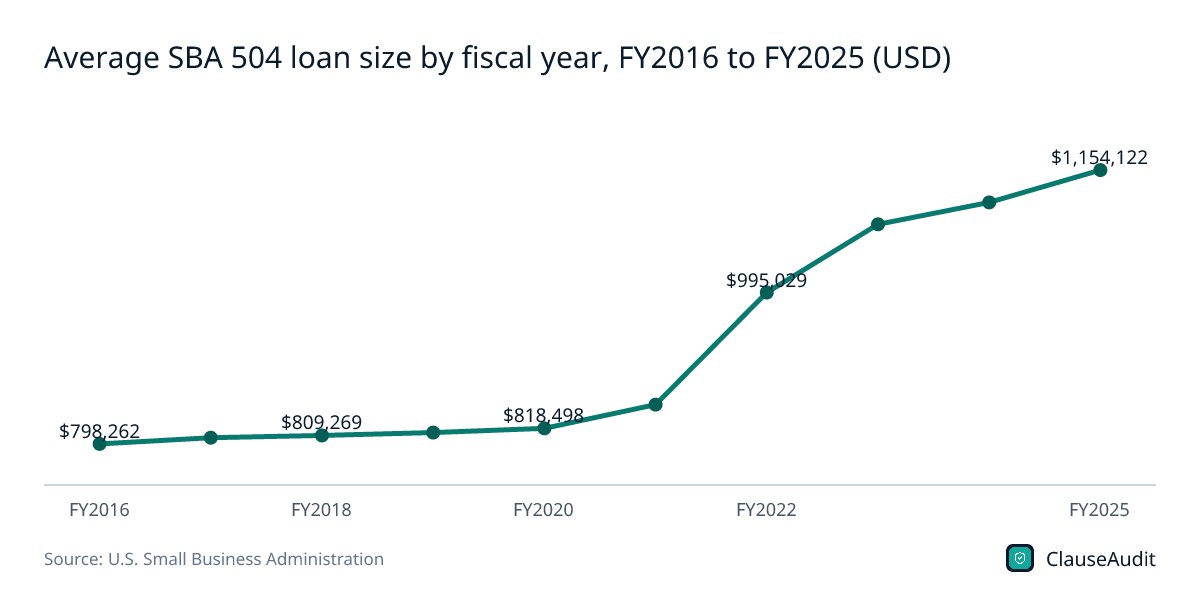
Download this chart (PNG)Average SBA 504 loan size by fiscal year, FY2016 to FY2025 (USD)
Chart data
| Label | Value (USD) |
|---|---|
| FY2016 | $798,262 |
| FY2017 | $806,324 |
| FY2018 | $809,269 |
| FY2019 | $813,011 |
| FY2020 | $818,498 |
| FY2021 | $849,329 |
| FY2022 | $995,029 |
| FY2023 | $1,083,622 |
| FY2024 | $1,112,115 |
| FY2025 | $1,154,122 |
Unlike 7(a), the average 504 loan has grown steadily, from $798,262 in FY2016 to $1,154,122 in FY2025.
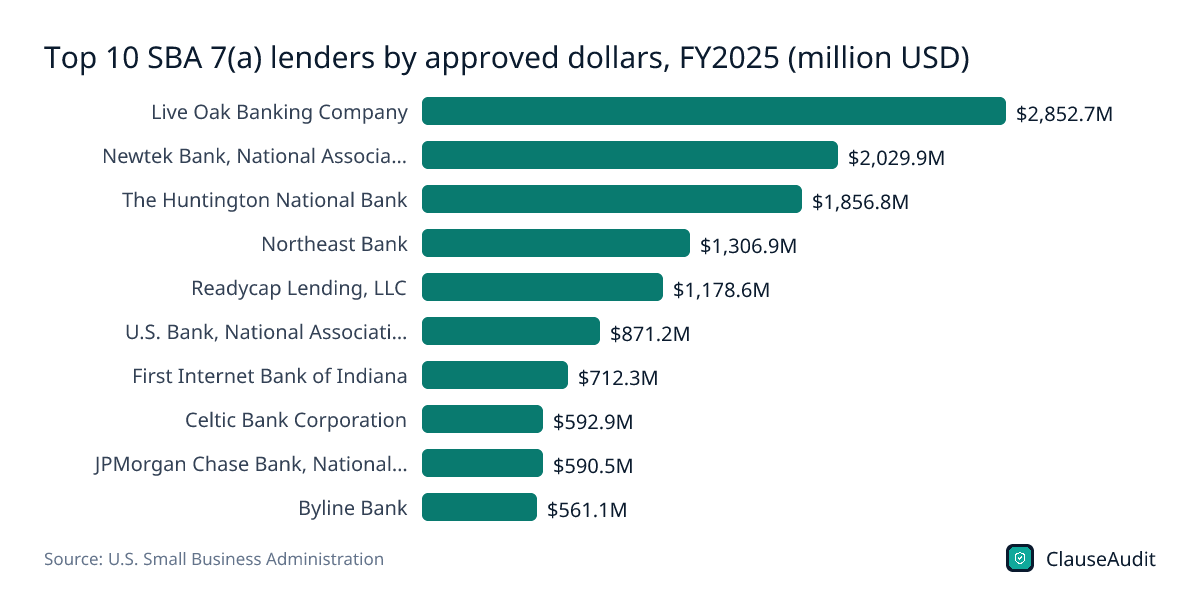
Download this chart (PNG)Top 10 SBA 7(a) lenders by approved dollars, FY2025 (million USD)
Chart data
| Label | Value |
|---|---|
| Live Oak Banking Company | $2,852.7M |
| Newtek Bank, National Association | $2,029.9M |
| The Huntington National Bank | $1,856.8M |
| Northeast Bank | $1,306.9M |
| Readycap Lending, LLC | $1,178.6M |
| U.S. Bank, National Association | $871.2M |
| First Internet Bank of Indiana | $712.3M |
| Celtic Bank Corporation | $592.9M |
| JPMorgan Chase Bank, National Association | $590.5M |
| Byline Bank | $561.1M |
Live Oak Banking Company led by dollars with $2,852.7M. Many of the top names lend nationally, so your local bank isn't your only option.
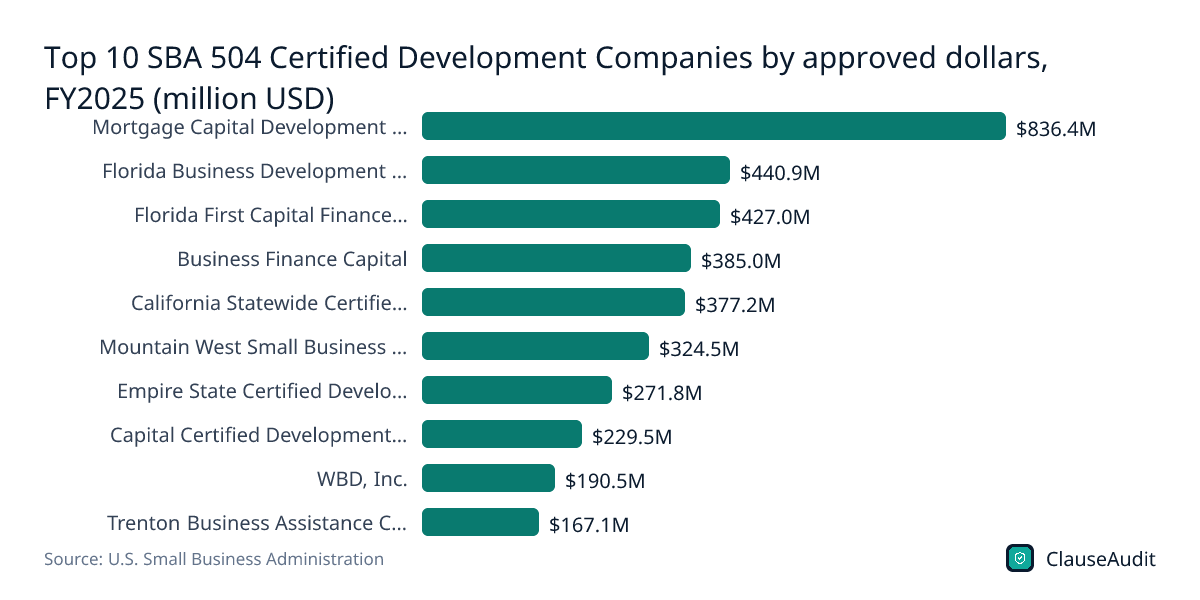
Download this chart (PNG)Top 10 SBA 504 Certified Development Companies by approved dollars, FY2025 (million USD)
Chart data
| Label | Value |
|---|---|
| Mortgage Capital Development Corporation | $836.4M |
| Florida Business Development Corporation | $440.9M |
| Florida First Capital Finance Corporation, Inc. | $427.0M |
| Business Finance Capital | $385.0M |
| California Statewide Certified Development Corporation | $377.2M |
| Mountain West Small Business Finance | $324.5M |
| Empire State Certified Development Corporation | $271.8M |
| Capital Certified Development Corporation | $229.5M |
| WBD, Inc. | $190.5M |
| Trenton Business Assistance Corporation | $167.1M |
504 loans run through Certified Development Companies. Mortgage Capital Development Corporation led with $836.4M, well ahead of the next CDC at $440.9M.
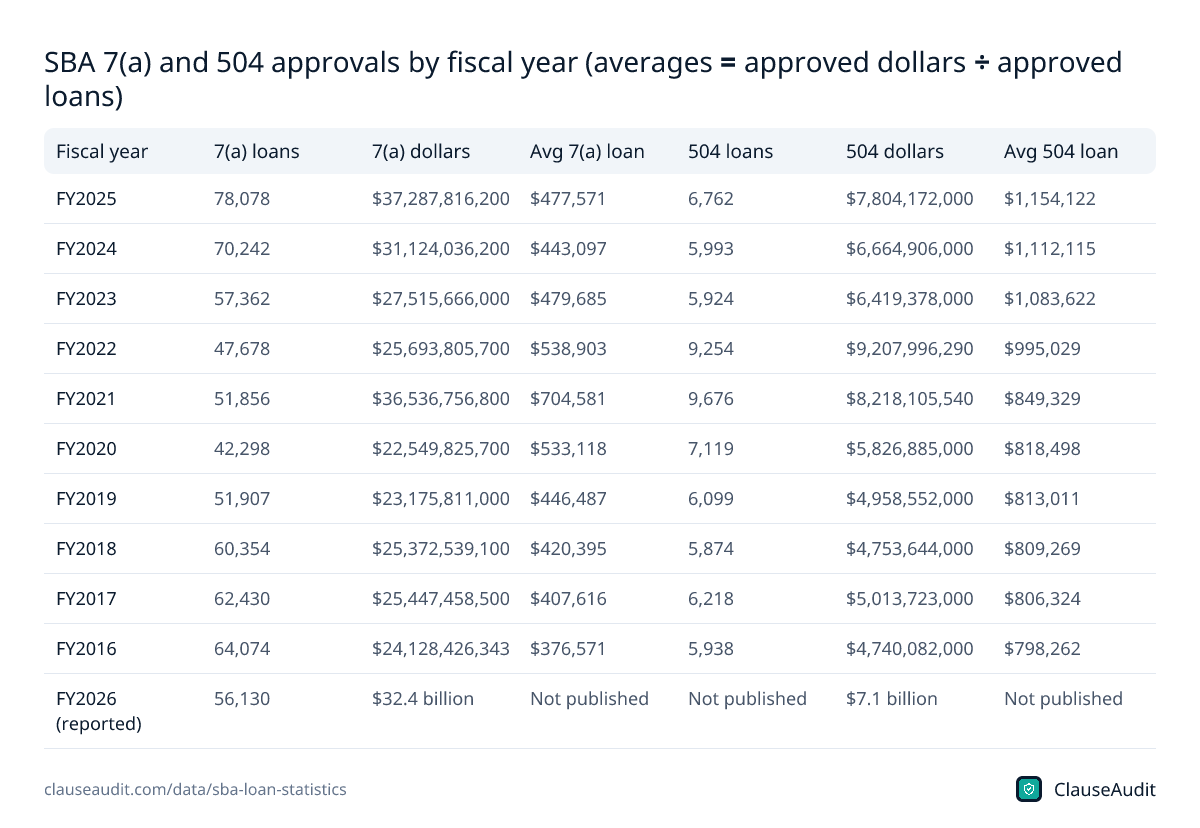
Download this chart (PNG)SBA 7(a) and 504 approvals by fiscal year (averages = approved dollars ÷ approved loans)
| Fiscal year | 7(a) loans | 7(a) dollars | Avg 7(a) loan | 504 loans | 504 dollars | Avg 504 loan |
|---|---|---|---|---|---|---|
| FY2025 | 78,078 | $37,287,816,200 | $477,571 | 6,762 | $7,804,172,000 | $1,154,122 |
| FY2024 | 70,242 | $31,124,036,200 | $443,097 | 5,993 | $6,664,906,000 | $1,112,115 |
| FY2023 | 57,362 | $27,515,666,000 | $479,685 | 5,924 | $6,419,378,000 | $1,083,622 |
| FY2022 | 47,678 | $25,693,805,700 | $538,903 | 9,254 | $9,207,996,290 | $995,029 |
| FY2021 | 51,856 | $36,536,756,800 | $704,581 | 9,676 | $8,218,105,540 | $849,329 |
| FY2020 | 42,298 | $22,549,825,700 | $533,118 | 7,119 | $5,826,885,000 | $818,498 |
| FY2019 | 51,907 | $23,175,811,000 | $446,487 | 6,099 | $4,958,552,000 | $813,011 |
| FY2018 | 60,354 | $25,372,539,100 | $420,395 | 5,874 | $4,753,644,000 | $809,269 |
| FY2017 | 62,430 | $25,447,458,500 | $407,616 | 6,218 | $5,013,723,000 | $806,324 |
| FY2016 | 64,074 | $24,128,426,343 | $376,571 | 5,938 | $4,740,082,000 | $798,262 |
| FY2026 (reported) | 56,130 | $32.4 billion | Not published | Not published | $7.1 billion | Not published |
Source: U.S. Small Business Administration, 7(a) & 504 Monthly & Yearly Activity Report, 1991 to present (FY2025 year-end, data as of 9/30/2025); American Banker, SBA starts new fiscal year with even tighter credit box. Download as image
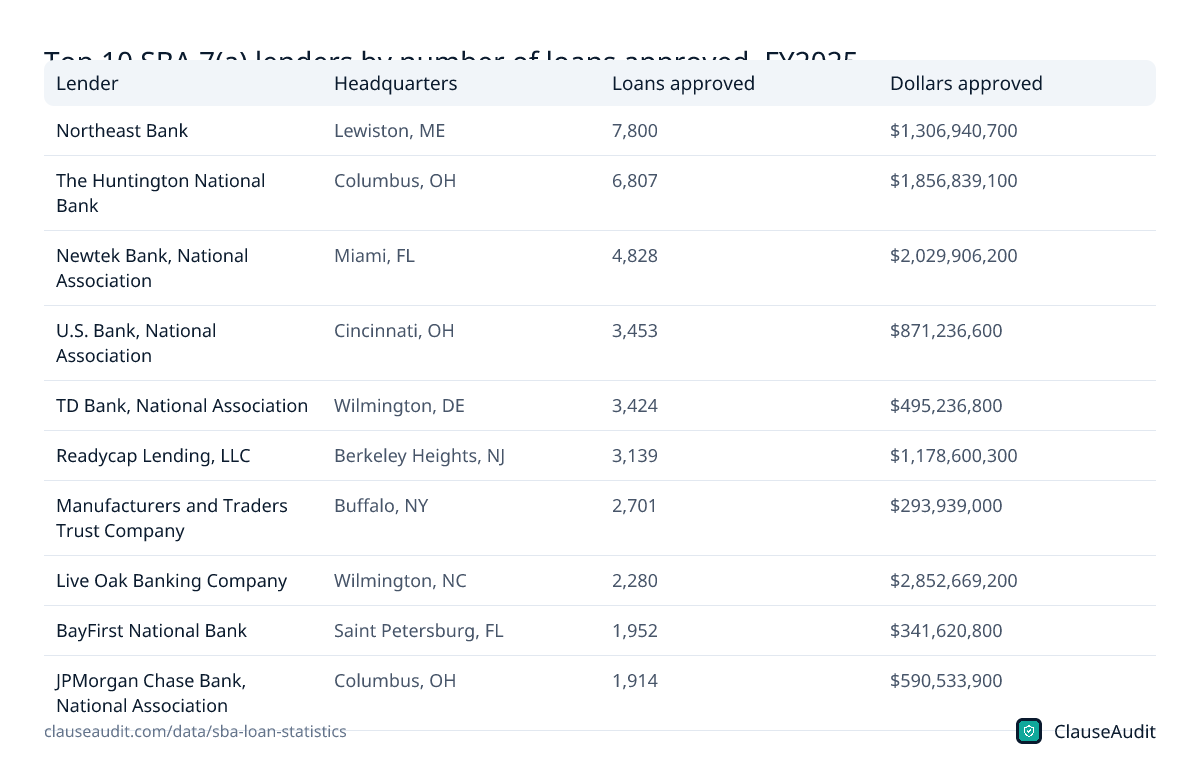
Top 10 SBA 7(a) lenders by number of loans approved, FY2025
| Lender | Headquarters | Loans approved | Dollars approved |
|---|---|---|---|
| Northeast Bank | Lewiston, ME | 7,800 | $1,306,940,700 |
| The Huntington National Bank | Columbus, OH | 6,807 | $1,856,839,100 |
| Newtek Bank, National Association | Miami, FL | 4,828 | $2,029,906,200 |
| U.S. Bank, National Association | Cincinnati, OH | 3,453 | $871,236,600 |
| TD Bank, National Association | Wilmington, DE | 3,424 | $495,236,800 |
| Readycap Lending, LLC | Berkeley Heights, NJ | 3,139 | $1,178,600,300 |
| Manufacturers and Traders Trust Company | Buffalo, NY | 2,701 | $293,939,000 |
| Live Oak Banking Company | Wilmington, NC | 2,280 | $2,852,669,200 |
| BayFirst National Bank | Saint Petersburg, FL | 1,952 | $341,620,800 |
| JPMorgan Chase Bank, National Association | Columbus, OH | 1,914 | $590,533,900 |
Source: U.S. Small Business Administration, 7(a) Lender Activity Report, FY2025. Download as image
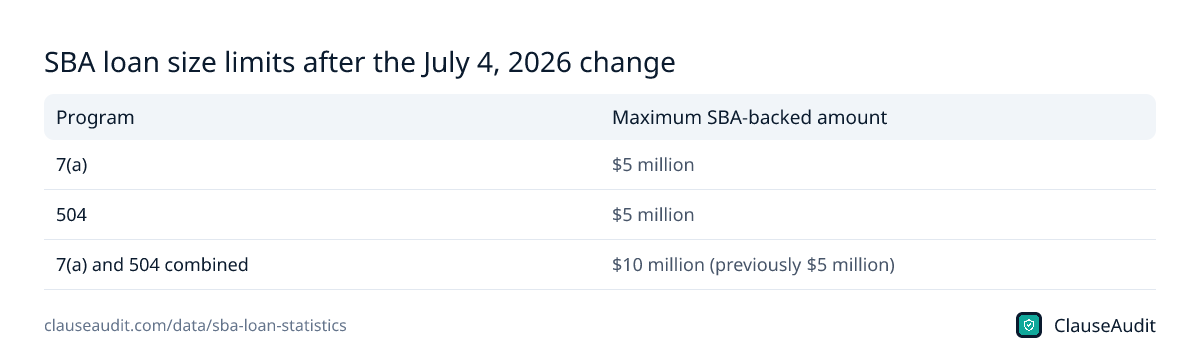
SBA loan size limits after the July 4, 2026 change
| Program | Maximum SBA-backed amount |
|---|---|
| 7(a) | $5 million |
| 504 | $5 million |
| 7(a) and 504 combined | $10 million (previously $5 million) |
Source: U.S. Small Business Administration, Small Businesses Now Eligible for $10 Million in SBA Financing (News release 26-69). Download as image
How much did the SBA lend in 2025?
In fiscal year 2025, which ended on September 30, 2025, the SBA approved $37.29 billion in 7(a) loans and $7.80 billion in 504 loans. On the last day of the year, the agency announced $44.8 billion across 84,400 loans combined. The year-end data file came in a little higher once every approval was counted, which is normal.
The 7(a) total is the highest in SBA's series going back to FY1991. The prior peak, $36.54B in FY2021, leaned on pandemic-era enhanced guaranties. FY2025 got there without that help.
The loan count tells the same story. The SBA approved 78,078 7(a) loans in FY2025, up from 70,242 in FY2024 and 57,362 in FY2023. So it isn't only that loans got bigger. More businesses got one.
For you, a record year doesn't guarantee a yes. It means lenders were active and the program had room. Your approval still turns on cash flow, credit, collateral and how clearly you explain what the money is for.
What is the average SBA loan size?
The average 7(a) loan in FY2025 was $477,571. The average 504 loan was $1,154,122. These are approved dollars divided by approved loans, so a handful of very large deals pull the average up. The typical borrower you know, a contractor buying a second truck or a cafe owner refinancing expensive debt, may well be borrowing far less.
The two averages have moved in different directions. The 7(a) average jumped to $704,581 in FY2021, then slid to $443,097 by FY2024 even as the number of loans kept rising. The 504 average has climbed every year in this series. If you're pricing a building or a big machine, expect your deal to look more like the 504 numbers.
Use the averages as a sense check, not a target. If you're asking for a modest working capital loan, you're inside the range lenders see every day. If you're asking for a seven-figure building loan, you're in 504 territory, and you should expect a longer process with an appraisal, environmental review and a CDC in the mix.
Which banks make the most SBA loans?
By dollars, Live Oak Banking Company was the largest 7(a) lender in FY2025 at $2.85 billion. By loan count, the leader was Northeast Bank with 7,800 loans. Those two facts point to different business models. Some lenders focus on fewer, larger loans in specific industries. Others run high volumes of smaller loans.
That matters when you shop. A lender that closes thousands of small loans a year usually has a fast, standardized process. A lender with a big average deal may know your industry well but care less about a small request. Ask each lender how many SBA loans like yours it closed last year. A confident answer is a good sign.
Don't skip the 504 side either. Certified Development Companies are often regional, and the 504 chart shows the leader approving almost twice the dollars of the next CDC. If you're buying property, ask your bank which CDC it usually works with, then call that CDC directly. You'll learn its timeline and fees before you're locked in.
What changed for SBA borrowers in 2026?
On July 4, 2026, the combined cap on 7(a) and 504 financing rose to $10 million, up from $5 million. Each program still tops out at $5 million on its own, but a business can now stack both. That helps a growing company that needs a building through 504 and working capital through 7(a) at the same time.
Volume cooled from the record. American Banker reported $32.4 billion in 7(a) approvals across 56,130 loans for FY2026, citing SBA figures, along with $7.1 billion in 504 lending. SBA's own year-end FY2026 files weren't posted yet when this page was checked, so treat those as early numbers. The same report described a tighter credit box, which in plain terms means lenders are asking for stronger files.
7(a) or 504: which SBA loan fits your business?
Think of 7(a) as the general-purpose loan. You can use it for working capital, inventory, equipment, buying an existing business, refinancing costly debt, or a mix of those. It's the program behind most SBA approvals, and it's the program the top lenders chart ranks.
The 504 loan is narrower. It pays for owner-occupied real estate or major long-life equipment, and it splits the deal between a bank and a Certified Development Company. The paperwork is heavier, and you'll deal with two lenders instead of one. In return, you get long fixed terms on the CDC portion, which helps when you're locking in a building you plan to stay in for years.
Here's a simple example. A dental practice buying the office it rents would look at 504. The same practice buying a second practice across town, with patient lists, goodwill and some equipment, would look at 7(a). Since the 2026 limit change, a larger practice could use both at once.
How to use these numbers before you apply
- Pick the right program first. Real estate and major equipment usually fit 504. Working capital, buying a business, inventory and mixed needs usually fit 7(a).
- Talk to at least three lenders, including one high-volume national lender from the top lenders chart and one local bank that knows you.
- Ask for the rate as an index plus a spread in writing, along with every fee, before you sign a commitment letter.
- Expect a personal guarantee. Owners with a large stake are usually required to sign one, so read exactly what it covers.
- Get your file ready: tax returns, a current balance sheet, a debt schedule, and a short plain-language reason for the loan. A tighter credit box rewards borrowers who show up organized.
- Read the loan agreement and the guarantee as two separate documents. The guarantee is often the one that reaches your house.
How ClauseAudit helps
An SBA guarantee protects the lender, not you. Your loan agreement, note and personal guarantee still set the rate, the fees and what happens if things go wrong. Upload them before you sign and our automated review flags the clauses that carry the most risk, in plain English.
These are the terms worth checking line by line in any SBA loan package.
- Personal guarantee scope: whether it's unlimited, joint with other owners, and whether your spouse is asked to sign
- Interest rate: the index, the spread, how often it adjusts and whether there's a floor
- Prepayment penalties and fees, including packaging or referral fees on top of the guarantee fee
- Default triggers, including cross-default with other loans and vague material adverse change language
- Collateral and liens, especially a lien on your home or a blanket lien on all business assets
- Reporting duties and covenants, such as annual financials and limits on new debt or owner pay
Frequently asked questions
How many SBA loans were approved in 2025?
In FY2025 the SBA approved 78,078 7(a) loans and 6,762 504 loans. The agency announced 84,400 loans and $44.8 billion combined on the last day of the fiscal year. The year-end file counted a few more approvals that came in at the end, which is why totals can differ slightly between sources.
What is the average SBA 7(a) loan amount?
The average approved 7(a) loan in FY2025 was $477,571, up from $443,097 in FY2024. It's an average, so large deals pull it up. Many 7(a) borrowers take much smaller loans for working capital, equipment or refinancing, and lenders handle those requests every day.
What is the average SBA 504 loan size?
The average 504 loan in FY2025 was $1,154,122. It has grown every year in the series shown here, from $798,262 in FY2016. 504 loans fund buildings and major equipment, so they tend to be larger and take longer to close than a typical 7(a) loan.
Who is the largest SBA lender?
By dollars, Live Oak Banking Company was the largest 7(a) lender in FY2025 at $2.85 billion. By number of loans, Northeast Bank led with 7,800. The best lender for you depends on your loan size and industry, so compare a few rather than going with the biggest name.
What is the maximum SBA loan in 2026?
Each program, 7(a) and 504, is capped at $5 million. Since the July 4, 2026 change, a business can combine both for up to $10 million, where the combined limit used to be $5 million. Most borrowers ask for far less than the cap.
Is SBA lending going down in 2026?
Early figures suggest it cooled from the FY2025 record. American Banker reported $32.4 billion in 7(a) approvals across 56,130 loans for FY2026, citing SBA. The SBA's own year-end files weren't published yet when we checked, so the final count could shift.
Should I choose a 7(a) or a 504 loan?
Use 504 if you're buying or building real estate or buying major long-life equipment. It runs through a Certified Development Company alongside a bank. Use 7(a) for nearly everything else, such as working capital, inventory, buying a business or refinancing. Some businesses use both, which the 2026 limit change makes easier.
Do SBA loans require a personal guarantee?
Usually, yes. Owners with a significant stake are generally asked to sign a personal guarantee, which makes you personally liable if the business can't repay. Read it closely. Check whether it's unlimited, whether it covers costs and fees, and whether it lets the lender go after you before the business assets.
Use this data
Every chart and card below is free to reuse under CC BY 4.0. Download what you need and link back to this page.
 Stat cards
 Key findings card
 Infographic
 SBA 7(a) loan dollars approved by fiscal year, FY2016 to FY2025 (billion USD)
 Number of SBA 7(a) loans approved by fiscal year, FY2016 to FY2025
 Average SBA 7(a) loan size by fiscal year, FY2016 to FY2025 (USD)
 Average SBA 504 loan size by fiscal year, FY2016 to FY2025 (USD)
 Top 10 SBA 7(a) lenders by approved dollars, FY2025 (million USD)
 Top 10 SBA 504 Certified Development Companies by approved dollars, FY2025 (million USD)
 SBA 7(a) and 504 approvals by fiscal year (averages = approved dollars ÷ approved loans)
 Top 10 SBA 7(a) lenders by number of loans approved, FY2025
 SBA loan size limits after the July 4, 2026 change
Embed the infographic
Free to share on your site, blog or slides under CC BY 4.0. Please keep the credit link.
Sources and method
Every number on this page comes from the sources below, each opened and read on or before October 18, 2026. A second, independent review checked every figure against its source and corrected anything that did not match. Figures that could not be confirmed were left out.
- U.S. Small Business Administration, 7(a) & 504 Monthly & Yearly Activity Report, 1991 to present (FY2025 year-end, data as of 9/30/2025) (FY2025 year-end edition, data as of 9/30/2025)
- U.S. Small Business Administration, 7(a) Lender Activity Report, FY2025 (FY2025 year-end edition, data as of 9/30/2025)
- U.S. Small Business Administration, 504 CDC Activity Report, FY2025 (FY2025 year-end edition, data as of 9/30/2025)
- U.S. Small Business Administration, Trump SBA Delivers Record Capital to Small Businesses in FY25 (News release 25-83) (September 30, 2025)
- U.S. Small Business Administration, Small Businesses Now Eligible for $10 Million in SBA Financing (News release 26-69) (July 7, 2026)
- American Banker, SBA starts new fiscal year with even tighter credit box (October 9, 2026 (updated October 13, 2026))
Cite this page
ClauseAudit, “SBA Loan Statistics 2026: 7(a) and 504 Volume, Average Loan Size and Top Lenders”, updated October 18, 2026, https://clauseaudit.com/data/sba-loan-statistics. Free to reuse with a link back (CC BY 4.0).
This page summarises published data and law as checked on October 18, 2026. Figures are updated as new editions are released, and your own situation may differ. It is general information, not legal, tax or financial advice.