SBA Loans by State: Volume, Average Size and Top Lenders in Each State
By ClauseAudit Research · 5 sources ·
Which states get the most SBA loans?
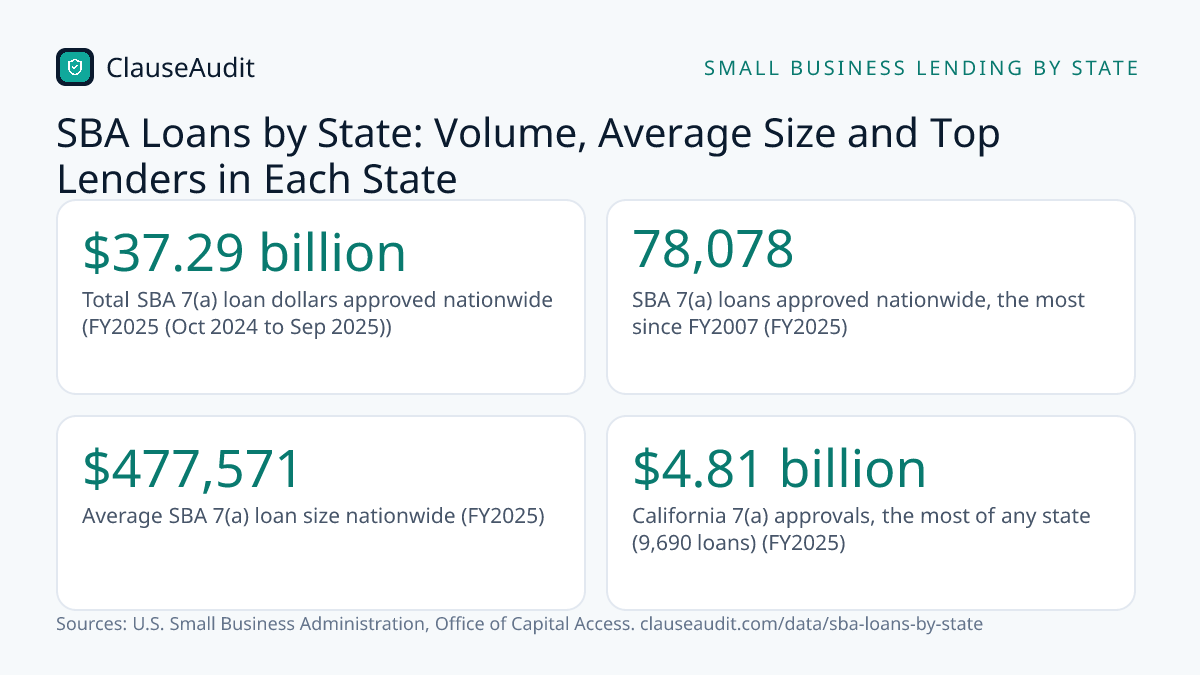
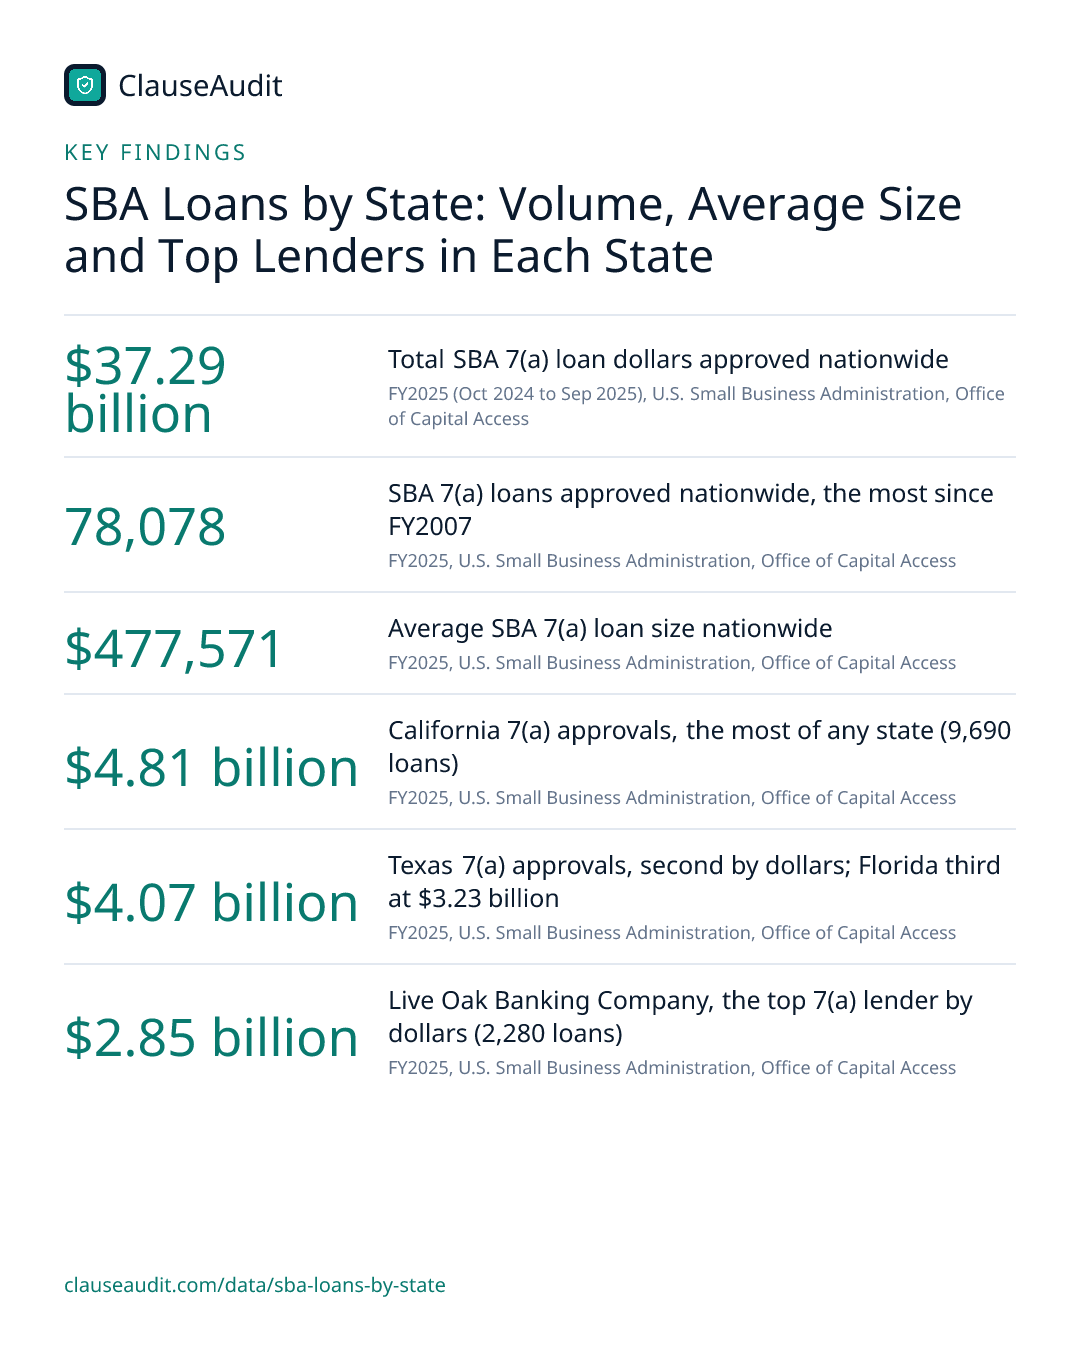
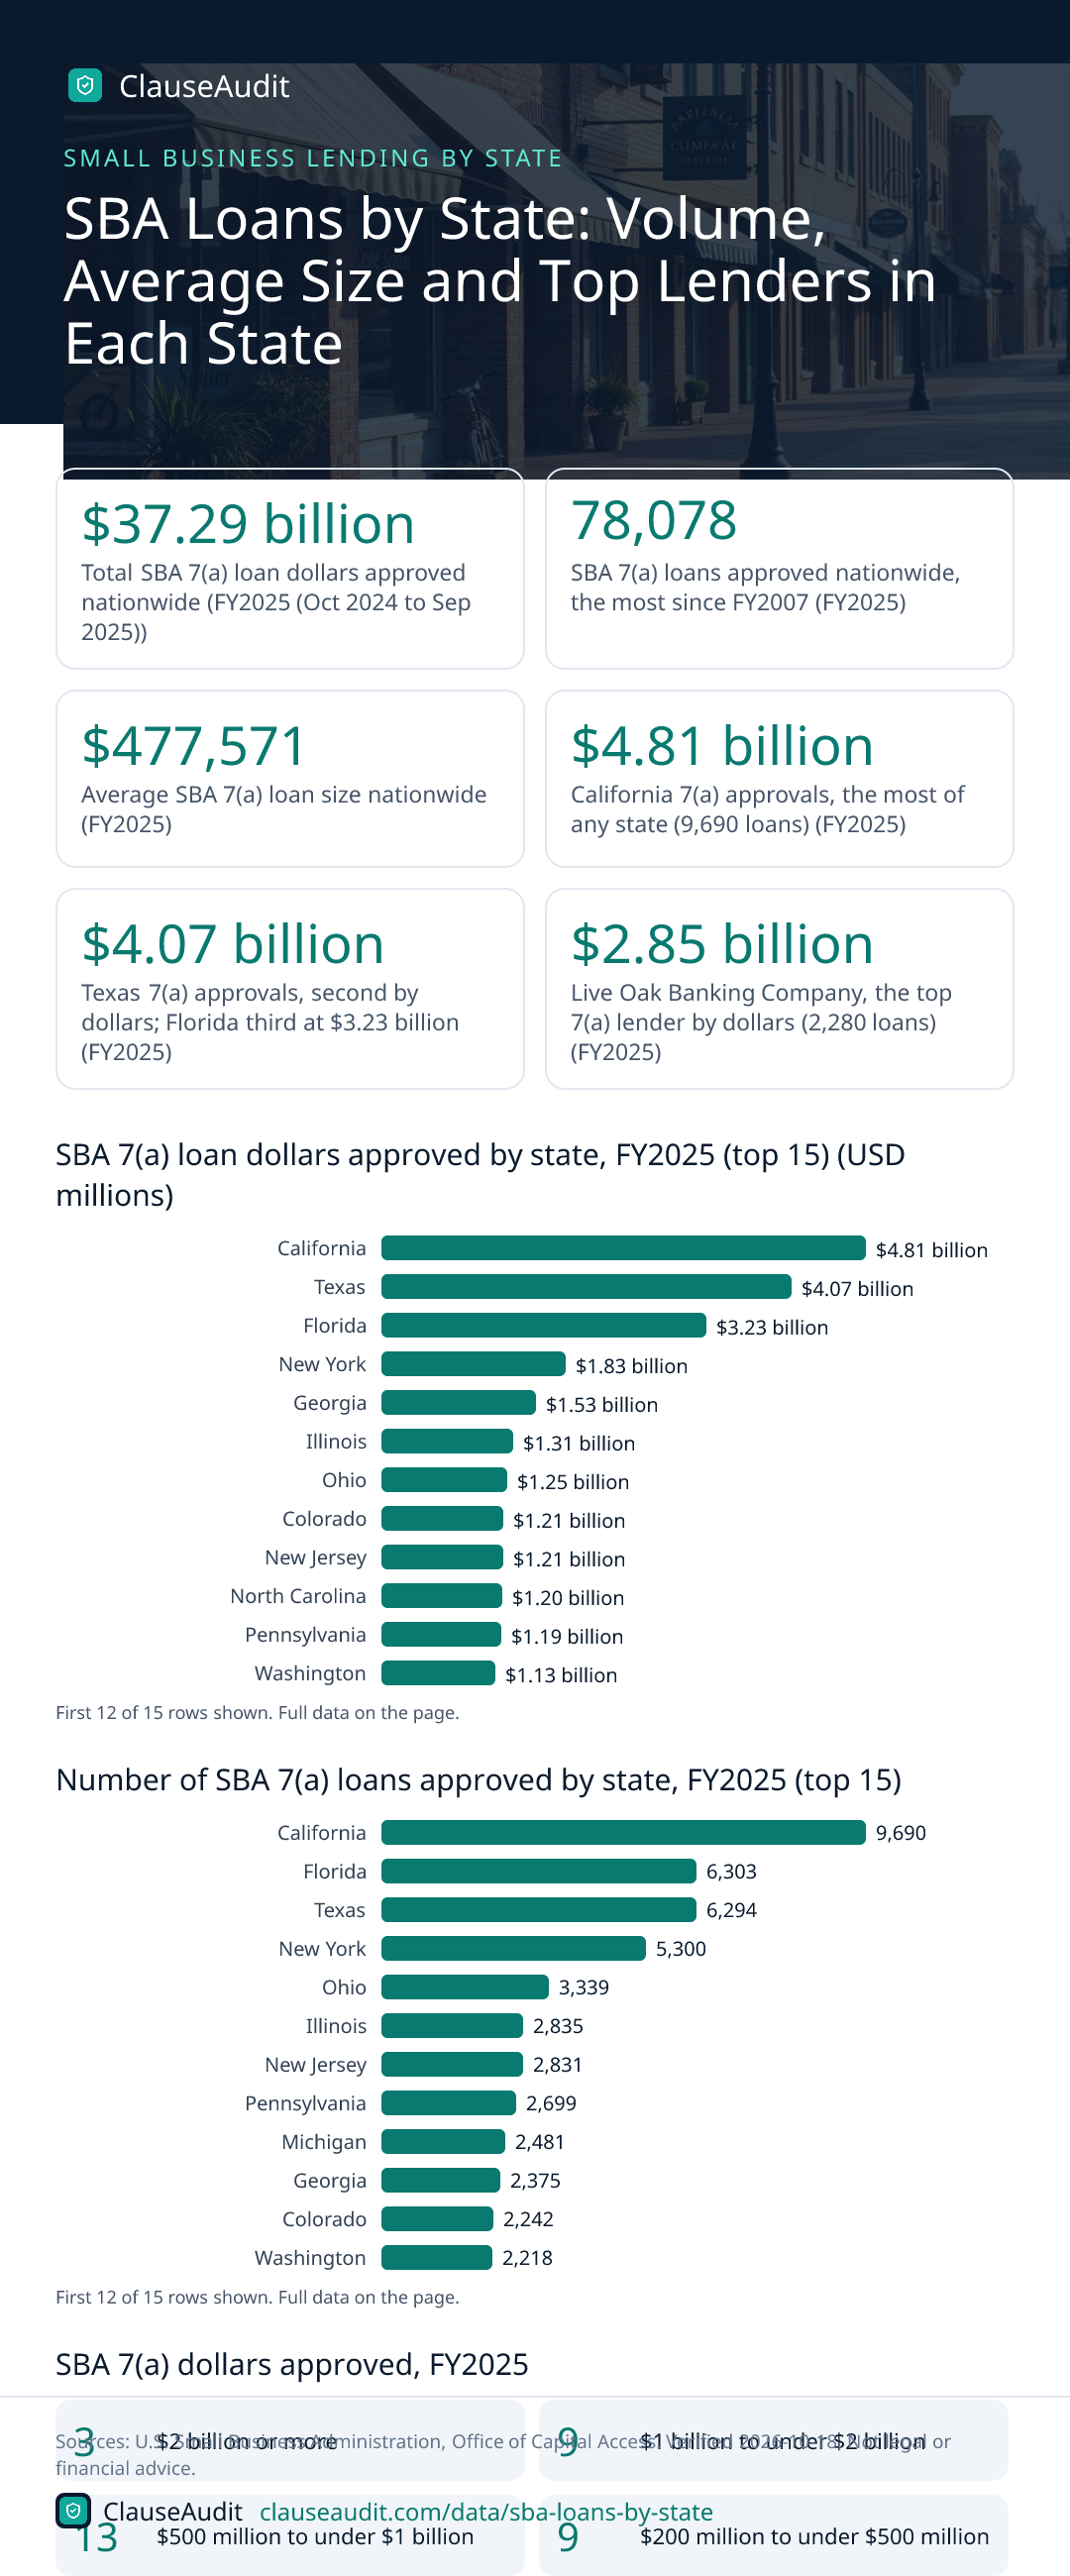
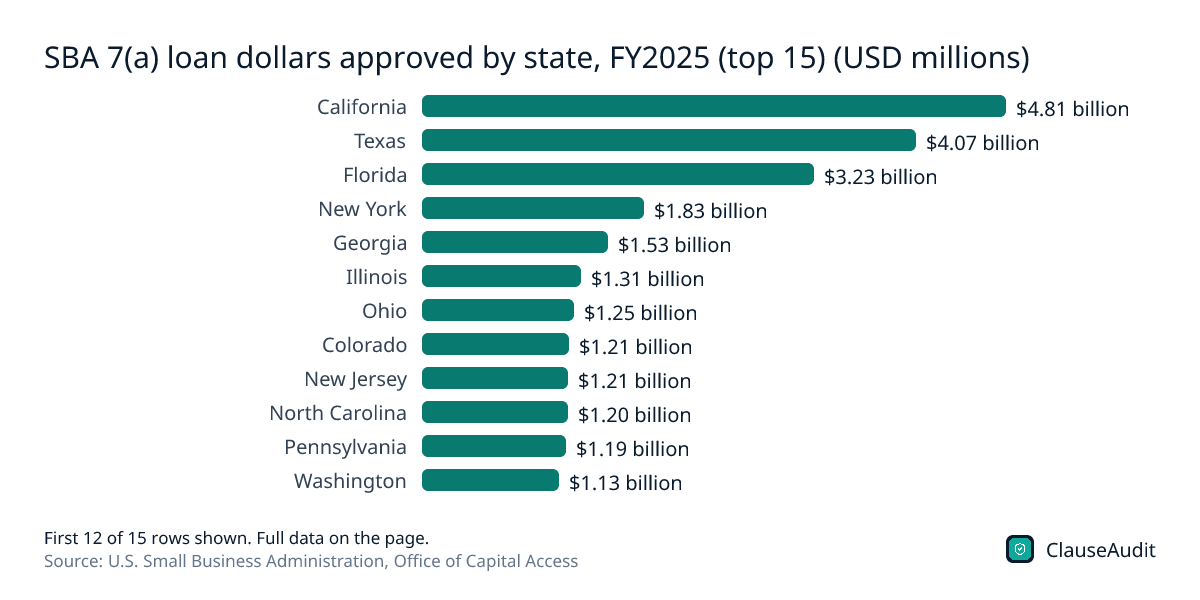
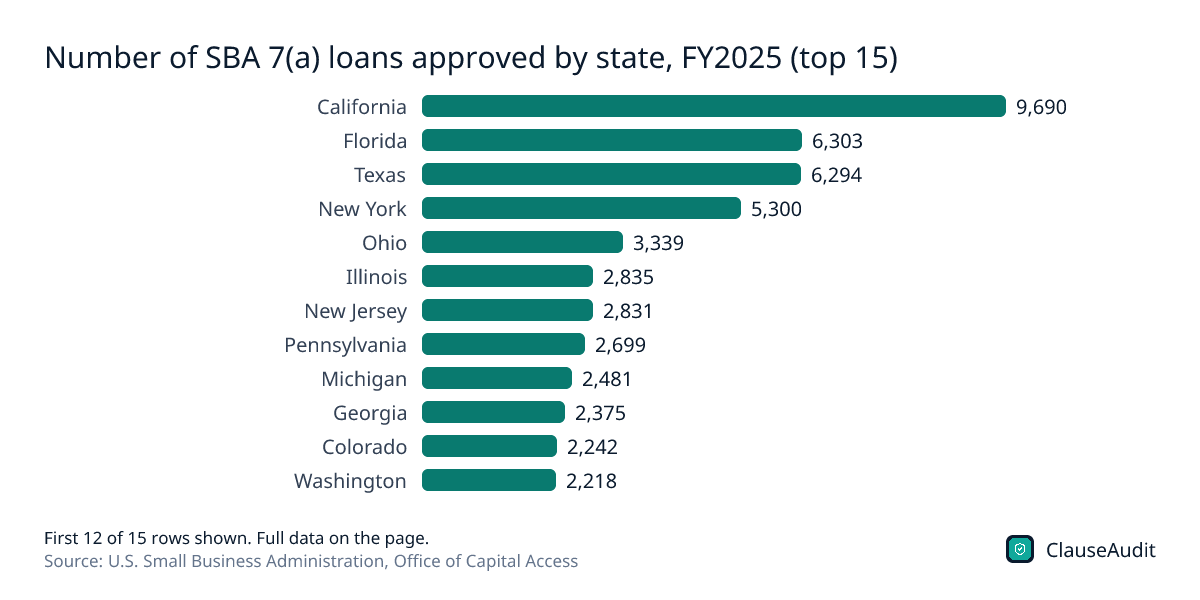
California leads the country in SBA lending. Its businesses got $4.81 billion in 7(a) loans across 9,690 approvals in FY2025, ahead of Texas at $4.07 billion and Florida at $3.23 billion. Nationwide, SBA approved 78,078 7(a) loans worth $37.29 billion, an average of $477,571 per loan.
- Total SBA 7(a) loan dollars approved nationwide (FY2025 (Oct 2024 to Sep 2025), U.S. Small Business Administration, Office of Capital Access)
- $37.29 billion
- SBA 7(a) loans approved nationwide, the most since FY2007 (FY2025, U.S. Small Business Administration, Office of Capital Access)
- 78,078
- Average SBA 7(a) loan size nationwide (FY2025, U.S. Small Business Administration, Office of Capital Access)
- $477,571
- California 7(a) approvals, the most of any state (9,690 loans) (FY2025, U.S. Small Business Administration, Office of Capital Access)
- $4.81 billion
- Texas 7(a) approvals, second by dollars; Florida third at $3.23 billion (FY2025, U.S. Small Business Administration, Office of Capital Access)
- $4.07 billion
- Live Oak Banking Company, the top 7(a) lender by dollars (2,280 loans) (FY2025, U.S. Small Business Administration, Office of Capital Access)
- $2.85 billion
- 7(a) loans approved by Northeast Bank, the most of any lender (FY2025, U.S. Small Business Administration, Office of Capital Access)
- 7,800
- SBA 504 loan dollars approved nationwide across 6,762 loans (FY2025, U.S. Small Business Administration, Office of Capital Access)
- $7.80 billion
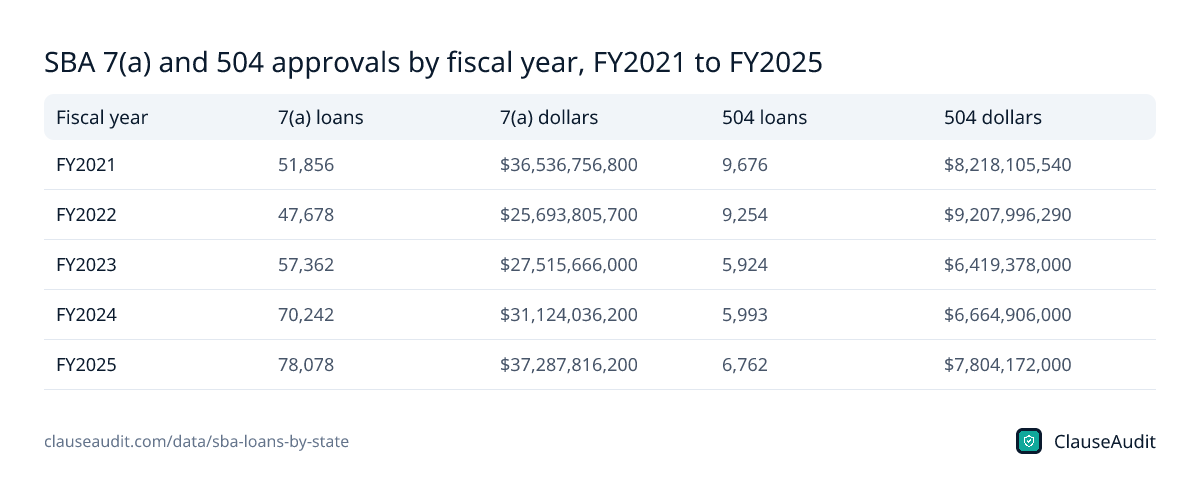
SBA lending had a record year. In FY2025 the agency approved $37.29 billion in 7(a) loans, the highest annual total in its own records going back to FY1991, and 78,078 individual loans, the most since FY2007.
That money did not spread evenly. A few big states took most of it, a handful of lenders wrote a large share of it, and the typical loan in one state is far bigger than in another. Here is what the state numbers mean if you are about to apply, and what to read before you sign.
SBA 7(a) loan dollars approved by state, FY2025 (top 15) (USD millions)
Chart data
| Label | Value |
|---|---|
| California | $4.81 billion |
| Texas | $4.07 billion |
| Florida | $3.23 billion |
| New York | $1.83 billion |
| Georgia | $1.53 billion |
| Illinois | $1.31 billion |
| Ohio | $1.25 billion |
| Colorado | $1.21 billion |
| New Jersey | $1.21 billion |
| North Carolina | $1.20 billion |
| Pennsylvania | $1.19 billion |
| Washington | $1.13 billion |
| Michigan | $982.0 million |
| Arizona | $845.2 million |
| Virginia | $757.4 million |
Big economies lead, as you would expect. The surprise is Colorado at $1.21 billion, ahead of larger states like Pennsylvania and Michigan.
Download this chart (PNG)Number of SBA 7(a) loans approved by state, FY2025 (top 15)
Chart data
| Label | Value |
|---|---|
| California | 9,690 |
| Florida | 6,303 |
| Texas | 6,294 |
| New York | 5,300 |
| Ohio | 3,339 |
| Illinois | 2,835 |
| New Jersey | 2,831 |
| Pennsylvania | 2,699 |
| Michigan | 2,481 |
| Georgia | 2,375 |
| Colorado | 2,242 |
| Washington | 2,218 |
| Massachusetts | 2,038 |
| North Carolina | 1,905 |
| Arizona | 1,647 |
Loan counts and dollar totals tell different stories. Florida approved more loans than Texas, but Texas borrowers took home more money because their loans were bigger.
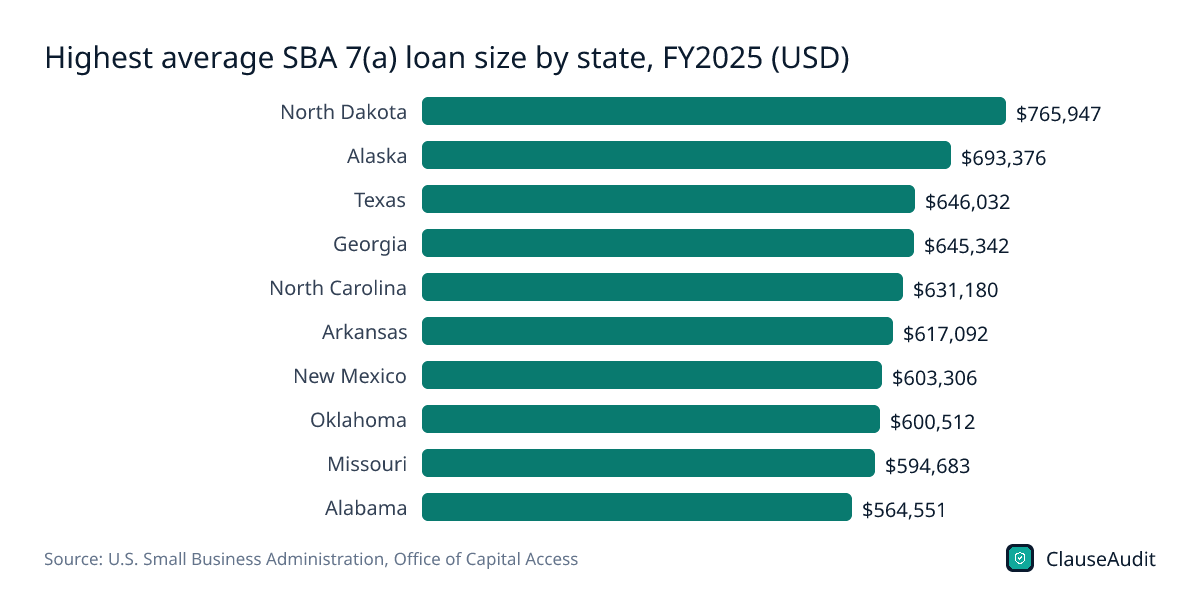
Download this chart (PNG)Highest average SBA 7(a) loan size by state, FY2025 (USD)
Chart data
| Label | Value |
|---|---|
| North Dakota | $765,947 |
| Alaska | $693,376 |
| Texas | $646,032 |
| Georgia | $645,342 |
| North Carolina | $631,180 |
| Arkansas | $617,092 |
| New Mexico | $603,306 |
| Oklahoma | $600,512 |
| Missouri | $594,683 |
| Alabama | $564,551 |
North Dakota tops the list at $765,947 per loan on a small number of deals. A few large loans for real estate or business purchases can pull a small state's average up fast.
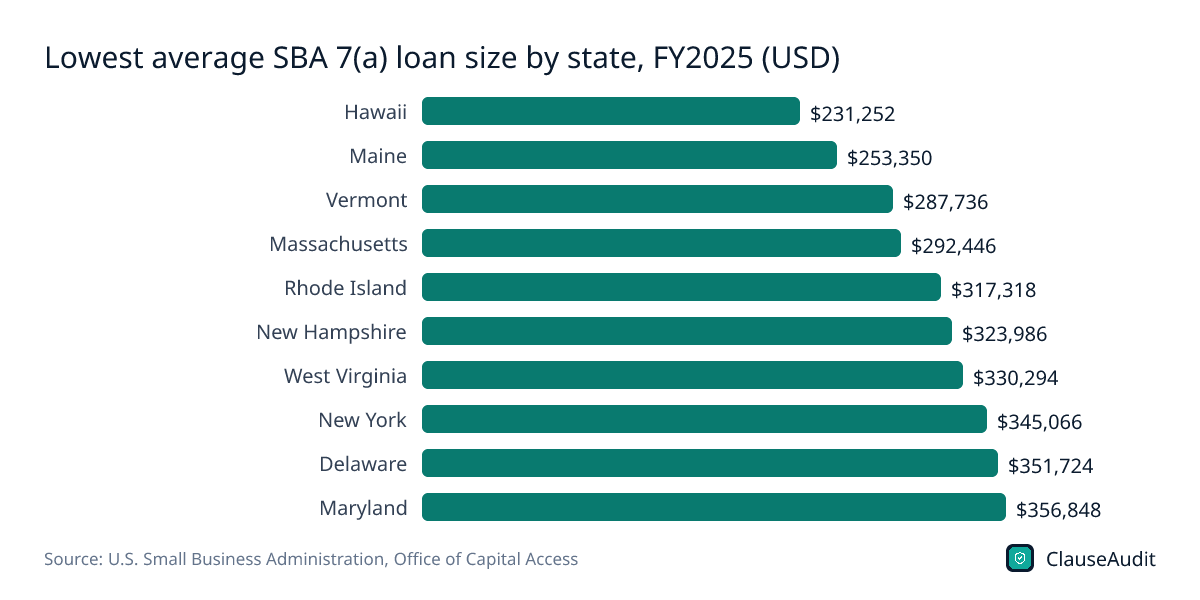
Download this chart (PNG)Lowest average SBA 7(a) loan size by state, FY2025 (USD)
Chart data
| Label | Value |
|---|---|
| Hawaii | $231,252 |
| Maine | $253,350 |
| Vermont | $287,736 |
| Massachusetts | $292,446 |
| Rhode Island | $317,318 |
| New Hampshire | $323,986 |
| West Virginia | $330,294 |
| New York | $345,066 |
| Delaware | $351,724 |
| Maryland | $356,848 |
Hawaii, Maine and Vermont sit at the bottom. Lower averages usually point to a mix with more small working capital loans.
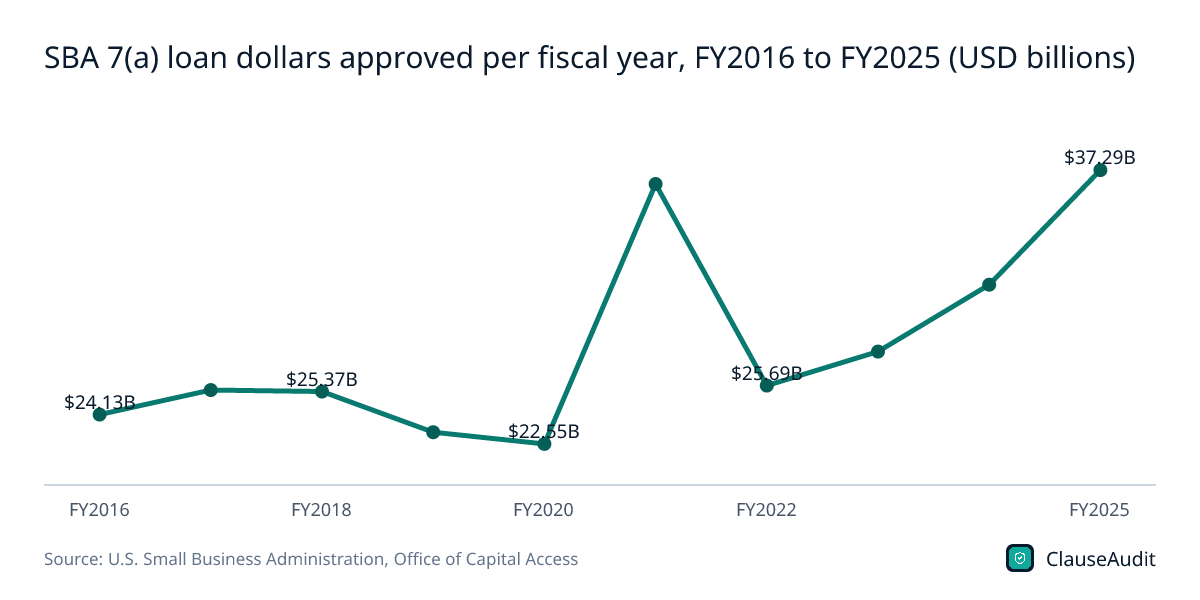
Download this chart (PNG)SBA 7(a) loan dollars approved per fiscal year, FY2016 to FY2025 (USD billions)
Chart data
| Label | Value (USD billions) |
|---|---|
| FY2016 | $24.13B |
| FY2017 | $25.45B |
| FY2018 | $25.37B |
| FY2019 | $23.18B |
| FY2020 | $22.55B |
| FY2021 | $36.54B |
| FY2022 | $25.69B |
| FY2023 | $27.52B |
| FY2024 | $31.12B |
| FY2025 | $37.29B |
FY2021 was inflated by pandemic relief terms, including fee waivers and bigger guarantees. FY2025 still came in higher, at $37.29 billion, the largest total in SBA's records back to FY1991.
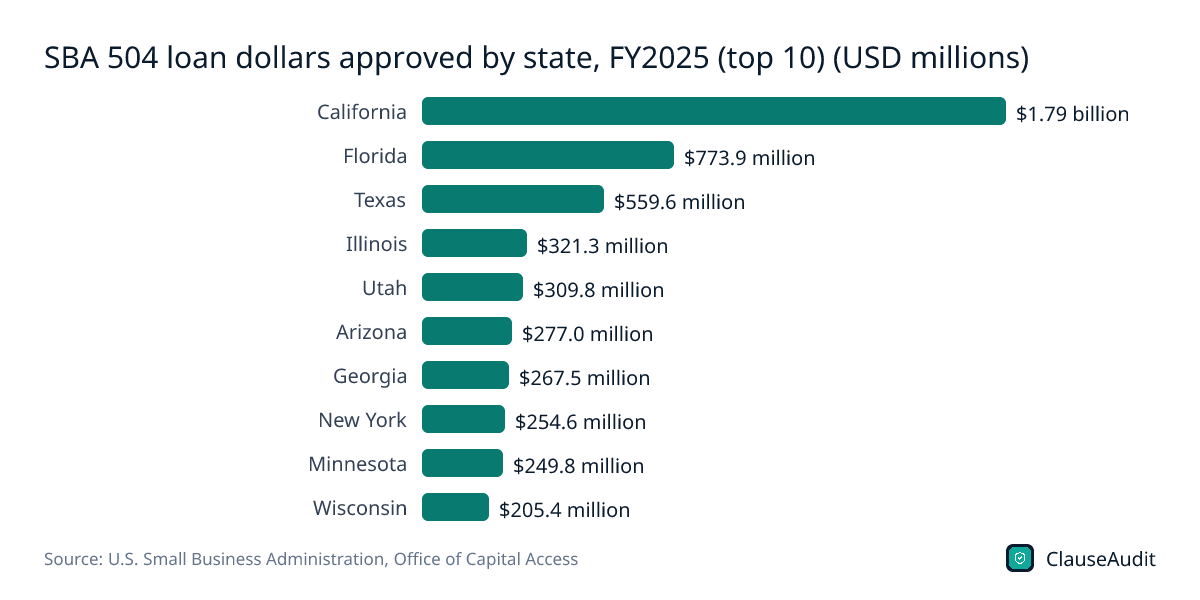
Download this chart (PNG)SBA 504 loan dollars approved by state, FY2025 (top 10) (USD millions)
Chart data
| Label | Value |
|---|---|
| California | $1.79 billion |
| Florida | $773.9 million |
| Texas | $559.6 million |
| Illinois | $321.3 million |
| Utah | $309.8 million |
| Arizona | $277.0 million |
| Georgia | $267.5 million |
| New York | $254.6 million |
| Minnesota | $249.8 million |
| Wisconsin | $205.4 million |
The 504 program funds buildings and heavy equipment, so it favors states with active commercial real estate. Utah ranks fifth at $309.8 million, well above its rank on 7(a) dollars.
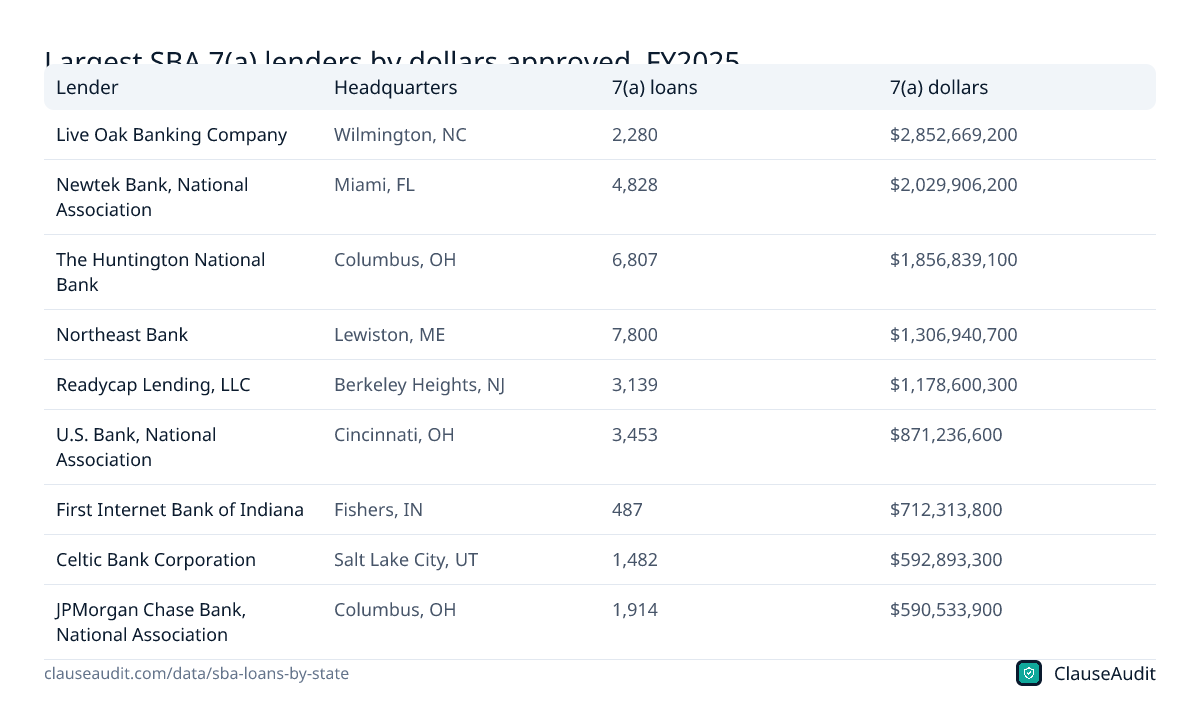
Download this chart (PNG)Largest SBA 7(a) lenders by dollars approved, FY2025
| Lender | Headquarters | 7(a) loans | 7(a) dollars |
|---|---|---|---|
| Live Oak Banking Company | Wilmington, NC | 2,280 | $2,852,669,200 |
| Newtek Bank, National Association | Miami, FL | 4,828 | $2,029,906,200 |
| The Huntington National Bank | Columbus, OH | 6,807 | $1,856,839,100 |
| Northeast Bank | Lewiston, ME | 7,800 | $1,306,940,700 |
| Readycap Lending, LLC | Berkeley Heights, NJ | 3,139 | $1,178,600,300 |
| U.S. Bank, National Association | Cincinnati, OH | 3,453 | $871,236,600 |
| First Internet Bank of Indiana | Fishers, IN | 487 | $712,313,800 |
| Celtic Bank Corporation | Salt Lake City, UT | 1,482 | $592,893,300 |
| JPMorgan Chase Bank, National Association | Columbus, OH | 1,914 | $590,533,900 |
Source: U.S. Small Business Administration, Office of Capital Access, FYE25 7(a) Lender Activity Report (Lender and Lender_ProjSt tabs). Download as image
SBA 7(a) and 504 approvals by fiscal year, FY2021 to FY2025
| Fiscal year | 7(a) loans | 7(a) dollars | 504 loans | 504 dollars |
|---|---|---|---|---|
| FY2021 | 51,856 | $36,536,756,800 | 9,676 | $8,218,105,540 |
| FY2022 | 47,678 | $25,693,805,700 | 9,254 | $9,207,996,290 |
| FY2023 | 57,362 | $27,515,666,000 | 5,924 | $6,419,378,000 |
| FY2024 | 70,242 | $31,124,036,200 | 5,993 | $6,664,906,000 |
| FY2025 | 78,078 | $37,287,816,200 | 6,762 | $7,804,172,000 |
Source: U.S. Small Business Administration, Office of Capital Access, FYE25 Monthly & Yearly Activity Report (7(a) and 504, FY1991 to FY2025), Yearly tab. Download as image
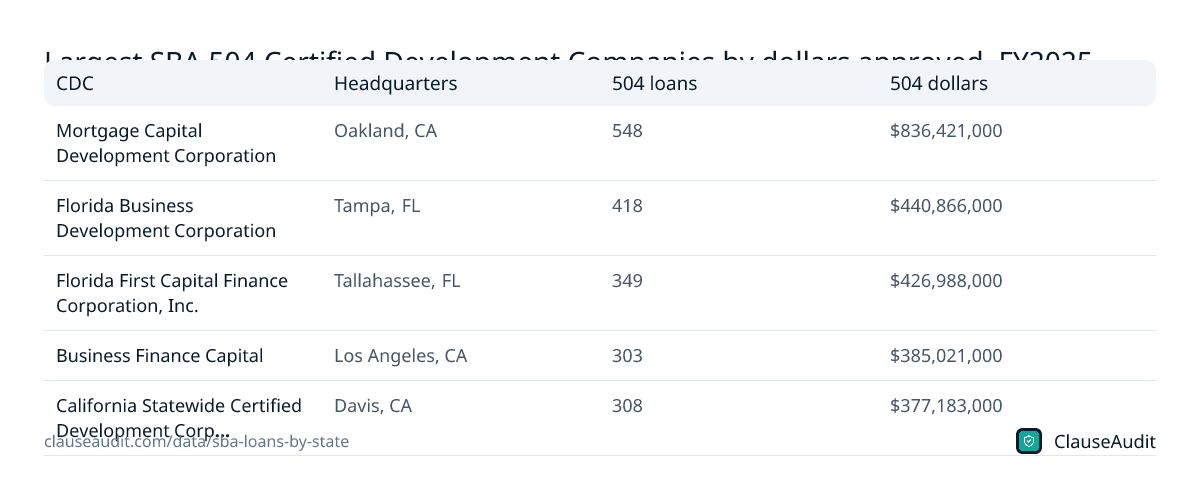
Largest SBA 504 Certified Development Companies by dollars approved, FY2025
| CDC | Headquarters | 504 loans | 504 dollars |
|---|---|---|---|
| Mortgage Capital Development Corporation | Oakland, CA | 548 | $836,421,000 |
| Florida Business Development Corporation | Tampa, FL | 418 | $440,866,000 |
| Florida First Capital Finance Corporation, Inc. | Tallahassee, FL | 349 | $426,988,000 |
| Business Finance Capital | Los Angeles, CA | 303 | $385,021,000 |
| California Statewide Certified Development Corporation | Davis, CA | 308 | $377,183,000 |
Source: U.S. Small Business Administration, Office of Capital Access, FYE25 504 CDC Activity Report (CDC and CDC_ProjSt tabs). Download as image
SBA 7(a) dollars approved, FY2025 by state
- 3$2 billion or more
- 9$1 billion to under $2 billion
- 13$500 million to under $1 billion
- 9$200 million to under $500 million
- 17Under $200 million
- $2 billion or more3
- $1 billion to under $2 billion9
- $500 million to under $1 billion13
- $200 million to under $500 million9
- Under $200 million17
| State | 7(a) loans | 7(a) dollars | Average 7(a) loan | Top 7(a) lender by dollars | Top 7(a) lender by number of loans | 504 loans | 504 dollars | Top 504 CDC by dollars | Source |
|---|---|---|---|---|---|---|---|---|---|
| Alabama | 624 | $352.3 million | $564,551 | Live Oak Banking Company ($47.5 million, 36 loans) | Northeast Bank (102 loans) | 59 | $71.0 million | Southern Development Council (24 loans) | 7(a): Small Business Act §7(a), 15 U.S.C. 636(a); 504: Small Business Investment Act of 1958 Title V, 15 U.S.C. 695 et seq. |
| Alaska | 116 | $80.4 million | $693,376 | Alaska Growth Capital BIDCO, Inc. ($25.3 million, 22 loans) | Alaska Growth Capital BIDCO, Inc. (22 loans) | 13 | $6.7 million | Evergreen Business Capital (13 loans) | 7(a): Small Business Act §7(a), 15 U.S.C. 636(a); 504: Small Business Investment Act of 1958 Title V, 15 U.S.C. 695 et seq. |
| Arizona | 1,647 | $845.2 million | $513,171 | Live Oak Banking Company ($76.9 million, 63 loans) | Northeast Bank (151 loans) | 222 | $277.0 million | Mortgage Capital Development Corporation (137 loans) | 7(a): Small Business Act §7(a), 15 U.S.C. 636(a); 504: Small Business Investment Act of 1958 Title V, 15 U.S.C. 695 et seq. |
| Arkansas | 401 | $247.5 million | $617,092 | Southern Bancorp Bank ($23.2 million, 41 loans) | Southern Bancorp Bank (41 loans) | 20 | $15.5 million | Rural Missouri, Inc. (17 loans) | 7(a): Small Business Act §7(a), 15 U.S.C. 636(a); 504: Small Business Investment Act of 1958 Title V, 15 U.S.C. 695 et seq. |
| California | 9,690 | $4.81 billion | $496,081 | Live Oak Banking Company ($381.9 million, 326 loans) | Northeast Bank (1267 loans) | 1,352 | $1.79 billion | Mortgage Capital Development Corporation (333 loans) | 7(a): Small Business Act §7(a), 15 U.S.C. 636(a); 504: Small Business Investment Act of 1958 Title V, 15 U.S.C. 695 et seq. |
| Colorado | 2,242 | $1.21 billion | $539,880 | Live Oak Banking Company ($117.3 million, 97 loans) | The Huntington National Bank (285 loans) | 166 | $163.0 million | B:Side Capital (104 loans) | 7(a): Small Business Act §7(a), 15 U.S.C. 636(a); 504: Small Business Investment Act of 1958 Title V, 15 U.S.C. 695 et seq. |
| Connecticut | 1,005 | $388.7 million | $386,793 | Live Oak Banking Company ($51.4 million, 31 loans) | Manufacturers and Traders Trust Company (240 loans) | 86 | $90.9 million | New England Certified Development Corporation (47 loans) | 7(a): Small Business Act §7(a), 15 U.S.C. 636(a); 504: Small Business Investment Act of 1958 Title V, 15 U.S.C. 695 et seq. |
| Delaware | 276 | $97.1 million | $351,724 | Wilmington Savings Fund Society FSB ($19.6 million, 20 loans) | Manufacturers and Traders Trust Company (112 loans) | 7 | $4.8 million | Delaware Community Development Corporation (4 loans) | 7(a): Small Business Act §7(a), 15 U.S.C. 636(a); 504: Small Business Investment Act of 1958 Title V, 15 U.S.C. 695 et seq. |
| District of Columbia | 178 | $78.0 million | $438,035 | Newtek Bank, National Association ($9.7 million, 21 loans) | Manufacturers and Traders Trust Company (44 loans) | 7 | $8.6 million | Rappahannock Economic Development Corporation (3 loans) | 7(a): Small Business Act §7(a), 15 U.S.C. 636(a); 504: Small Business Investment Act of 1958 Title V, 15 U.S.C. 695 et seq. |
| Florida | 6,303 | $3.23 billion | $511,750 | Live Oak Banking Company ($269.8 million, 206 loans) | Northeast Bank (709 loans) | 713 | $773.9 million | Florida First Capital Finance Corporation, Inc. (330 loans) | 7(a): Small Business Act §7(a), 15 U.S.C. 636(a); 504: Small Business Investment Act of 1958 Title V, 15 U.S.C. 695 et seq. |
| Georgia | 2,375 | $1.53 billion | $645,342 | Live Oak Banking Company ($127.2 million, 87 loans) | Northeast Bank (320 loans) | 189 | $267.5 million | Florida Business Development Corporation (56 loans) | 7(a): Small Business Act §7(a), 15 U.S.C. 636(a); 504: Small Business Investment Act of 1958 Title V, 15 U.S.C. 695 et seq. |
| Hawaii | 231 | $53.4 million | $231,252 | Newtek Bank, National Association ($13.0 million, 23 loans) | Central Pacific Bank (89 loans) | 23 | $27.6 million | Mortgage Capital Development Corporation (12 loans) | 7(a): Small Business Act §7(a), 15 U.S.C. 636(a); 504: Small Business Investment Act of 1958 Title V, 15 U.S.C. 695 et seq. |
| Idaho | 811 | $289.9 million | $357,507 | Idaho Central CU ($45.8 million, 86 loans) | Zions Bank, A Division of (178 loans) | 91 | $73.0 million | Capital Matrix, Inc. (45 loans) | 7(a): Small Business Act §7(a), 15 U.S.C. 636(a); 504: Small Business Investment Act of 1958 Title V, 15 U.S.C. 695 et seq. |
| Illinois | 2,835 | $1.31 billion | $460,485 | Byline Bank ($136.9 million, 99 loans) | The Huntington National Bank (660 loans) | 303 | $321.3 million | Small Business Growth Corporation (168 loans) | 7(a): Small Business Act §7(a), 15 U.S.C. 636(a); 504: Small Business Investment Act of 1958 Title V, 15 U.S.C. 695 et seq. |
| Indiana | 1,240 | $564.9 million | $455,592 | The Huntington National Bank ($52.3 million, 233 loans) | The Huntington National Bank (233 loans) | 129 | $130.8 million | Indiana Statewide Certified Development Corporation (51 loans) | 7(a): Small Business Act §7(a), 15 U.S.C. 636(a); 504: Small Business Investment Act of 1958 Title V, 15 U.S.C. 695 et seq. |
| Iowa | 429 | $178.6 million | $416,335 | Newtek Bank, National Association ($8.4 million, 18 loans) | U.S. Bank, National Association (85 loans) | 61 | $46.3 million | Iowa Business Growth Company (28 loans) | 7(a): Small Business Act §7(a), 15 U.S.C. 636(a); 504: Small Business Investment Act of 1958 Title V, 15 U.S.C. 695 et seq. |
| Kansas | 496 | $243.6 million | $491,220 | Live Oak Banking Company ($18.1 million, 15 loans) | Northeast Bank (47 loans) | 24 | $24.6 million | Rural Missouri, Inc. (7 loans) | 7(a): Small Business Act §7(a), 15 U.S.C. 636(a); 504: Small Business Investment Act of 1958 Title V, 15 U.S.C. 695 et seq. |
| Kentucky | 597 | $288.0 million | $482,459 | Stock Yards Bank & Trust Company ($35.0 million, 45 loans) | Northeast Bank (82 loans) | 18 | $22.1 million | Alloy Development Co., Inc. (5 loans) | 7(a): Small Business Act §7(a), 15 U.S.C. 636(a); 504: Small Business Investment Act of 1958 Title V, 15 U.S.C. 695 et seq. |
| Louisiana | 624 | $348.7 million | $558,783 | Newtek Bank, National Association ($36.5 million, 88 loans) | Northeast Bank (104 loans) | 18 | $28.0 million | JEDCO Development Corporation (6 loans) | 7(a): Small Business Act §7(a), 15 U.S.C. 636(a); 504: Small Business Investment Act of 1958 Title V, 15 U.S.C. 695 et seq. |
| Maine | 411 | $104.1 million | $253,350 | Live Oak Banking Company ($13.0 million, 7 loans) | TD Bank, National Association (87 loans) | 55 | $44.3 million | Granite State Economic Development Corporation (44 loans) | 7(a): Small Business Act §7(a), 15 U.S.C. 636(a); 504: Small Business Investment Act of 1958 Title V, 15 U.S.C. 695 et seq. |
| Maryland | 1,481 | $528.5 million | $356,848 | Manufacturers and Traders Trust Company ($65.2 million, 554 loans) | Manufacturers and Traders Trust Company (554 loans) | 35 | $43.5 million | Business Finance Group, Inc. (18 loans) | 7(a): Small Business Act §7(a), 15 U.S.C. 636(a); 504: Small Business Investment Act of 1958 Title V, 15 U.S.C. 695 et seq. |
| Massachusetts | 2,038 | $596.0 million | $292,446 | Live Oak Banking Company ($53.3 million, 41 loans) | Eastern Bank (290 loans) | 245 | $187.1 million | Granite State Economic Development Corporation (84 loans) | 7(a): Small Business Act §7(a), 15 U.S.C. 636(a); 504: Small Business Investment Act of 1958 Title V, 15 U.S.C. 695 et seq. |
| Michigan | 2,481 | $982.0 million | $395,812 | The Huntington National Bank ($197.8 million, 1060 loans) | The Huntington National Bank (1060 loans) | 144 | $134.9 million | Great Lakes Commercial Finance (58 loans) | 7(a): Small Business Act §7(a), 15 U.S.C. 636(a); 504: Small Business Investment Act of 1958 Title V, 15 U.S.C. 695 et seq. |
| Minnesota | 1,584 | $686.8 million | $433,574 | U.S. Bank, National Association ($67.9 million, 257 loans) | U.S. Bank, National Association (257 loans) | 238 | $249.8 million | Minnesota Business Finance Corporation (85 loans) | 7(a): Small Business Act §7(a), 15 U.S.C. 636(a); 504: Small Business Investment Act of 1958 Title V, 15 U.S.C. 695 et seq. |
| Mississippi | 347 | $192.3 million | $554,087 | Live Oak Banking Company ($30.6 million, 22 loans) | Northeast Bank (38 loans) | 8 | $14.4 million | Three Rivers Local Development Company, Inc. (6 loans) | 7(a): Small Business Act §7(a), 15 U.S.C. 636(a); 504: Small Business Investment Act of 1958 Title V, 15 U.S.C. 695 et seq. |
| Missouri | 1,201 | $714.2 million | $594,683 | Live Oak Banking Company ($101.5 million, 55 loans) | U.S. Bank, National Association (142 loans) | 84 | $100.3 million | Rural Missouri, Inc. (34 loans) | 7(a): Small Business Act §7(a), 15 U.S.C. 636(a); 504: Small Business Investment Act of 1958 Title V, 15 U.S.C. 695 et seq. |
| Montana | 266 | $145.7 million | $547,829 | Glacier Bank ($14.1 million, 26 loans) | Northeast Bank (28 loans) | 52 | $34.6 million | Capital Matrix, Inc. (20 loans) | 7(a): Small Business Act §7(a), 15 U.S.C. 636(a); 504: Small Business Investment Act of 1958 Title V, 15 U.S.C. 695 et seq. |
| Nebraska | 330 | $159.8 million | $484,236 | Union Bank and Trust Company ($24.4 million, 58 loans) | Union Bank and Trust Company (58 loans) | 30 | $34.2 million | Nebraska Economic Development Corporation (28 loans) | 7(a): Small Business Act §7(a), 15 U.S.C. 636(a); 504: Small Business Investment Act of 1958 Title V, 15 U.S.C. 695 et seq. |
| Nevada | 880 | $397.3 million | $451,532 | Newtek Bank, National Association ($26.6 million, 61 loans) | U.S. Bank, National Association (132 loans) | 101 | $125.4 million | Nevada State Development Corporation (50 loans) | 7(a): Small Business Act §7(a), 15 U.S.C. 636(a); 504: Small Business Investment Act of 1958 Title V, 15 U.S.C. 695 et seq. |
| New Hampshire | 605 | $196.0 million | $323,986 | Live Oak Banking Company ($19.9 million, 16 loans) | TD Bank, National Association (146 loans) | 77 | $61.9 million | Granite State Economic Development Corporation (48 loans) | 7(a): Small Business Act §7(a), 15 U.S.C. 636(a); 504: Small Business Investment Act of 1958 Title V, 15 U.S.C. 695 et seq. |
| New Jersey | 2,831 | $1.21 billion | $425,798 | TD Bank, National Association ($111.1 million, 644 loans) | TD Bank, National Association (644 loans) | 83 | $137.5 million | Trenton Business Assistance Corporation (55 loans) | 7(a): Small Business Act §7(a), 15 U.S.C. 636(a); 504: Small Business Investment Act of 1958 Title V, 15 U.S.C. 695 et seq. |
| New Mexico | 311 | $187.6 million | $603,306 | Live Oak Banking Company ($21.5 million, 21 loans) | U.S. Bank, National Association (32 loans) | 34 | $33.1 million | B:Side Capital (13 loans) | 7(a): Small Business Act §7(a), 15 U.S.C. 636(a); 504: Small Business Investment Act of 1958 Title V, 15 U.S.C. 695 et seq. |
| New York | 5,300 | $1.83 billion | $345,066 | Newtek Bank, National Association ($152.8 million, 291 loans) | TD Bank, National Association (806 loans) | 219 | $254.6 million | Empire State Certified Development Corporation (167 loans) | 7(a): Small Business Act §7(a), 15 U.S.C. 636(a); 504: Small Business Investment Act of 1958 Title V, 15 U.S.C. 695 et seq. |
| North Carolina | 1,905 | $1.20 billion | $631,180 | Live Oak Banking Company ($134.9 million, 124 loans) | Northeast Bank (242 loans) | 84 | $129.5 million | Business Expansion Funding Corporation (57 loans) | 7(a): Small Business Act §7(a), 15 U.S.C. 636(a); 504: Small Business Investment Act of 1958 Title V, 15 U.S.C. 695 et seq. |
| North Dakota | 131 | $100.3 million | $765,947 | Readycap Lending, LLC ($11.1 million, 5 loans) | U.S. Bank, National Association (13 loans) | 56 | $45.8 million | Dakota Business Lending (26 loans) | 7(a): Small Business Act §7(a), 15 U.S.C. 636(a); 504: Small Business Investment Act of 1958 Title V, 15 U.S.C. 695 et seq. |
| Ohio | 3,339 | $1.25 billion | $374,311 | The Huntington National Bank ($323.3 million, 1691 loans) | The Huntington National Bank (1691 loans) | 127 | $116.1 million | Alloy Development Co., Inc. (32 loans) | 7(a): Small Business Act §7(a), 15 U.S.C. 636(a); 504: Small Business Investment Act of 1958 Title V, 15 U.S.C. 695 et seq. |
| Oklahoma | 510 | $306.3 million | $600,512 | BancFirst ($32.8 million, 88 loans) | BancFirst (88 loans) | 35 | $37.4 million | Rural Enterprises of Oklahoma, Inc. (16 loans) | 7(a): Small Business Act §7(a), 15 U.S.C. 636(a); 504: Small Business Investment Act of 1958 Title V, 15 U.S.C. 695 et seq. |
| Oregon | 1,230 | $514.9 million | $418,604 | U.S. Bank, National Association ($41.4 million, 173 loans) | Columbia Bank (242 loans) | 73 | $96.1 million | Mortgage Capital Development Corporation (28 loans) | 7(a): Small Business Act §7(a), 15 U.S.C. 636(a); 504: Small Business Investment Act of 1958 Title V, 15 U.S.C. 695 et seq. |
| Pennsylvania | 2,699 | $1.19 billion | $439,338 | Live Oak Banking Company ($94.1 million, 80 loans) | Manufacturers and Traders Trust Company (324 loans) | 130 | $161.7 million | Empire State Certified Development Corporation (37 loans) | 7(a): Small Business Act §7(a), 15 U.S.C. 636(a); 504: Small Business Investment Act of 1958 Title V, 15 U.S.C. 695 et seq. |
| Rhode Island | 331 | $105.0 million | $317,318 | Live Oak Banking Company ($11.2 million, 9 loans) | BankNewport (72 loans) | 45 | $33.8 million | Ocean State Business Development Authority (20 loans) | 7(a): Small Business Act §7(a), 15 U.S.C. 636(a); 504: Small Business Investment Act of 1958 Title V, 15 U.S.C. 695 et seq. |
| South Carolina | 927 | $505.7 million | $545,487 | GBank ($48.6 million, 14 loans) | TD Bank, National Association (133 loans) | 43 | $74.5 million | Appalachian Development Corporation (17 loans) | 7(a): Small Business Act §7(a), 15 U.S.C. 636(a); 504: Small Business Investment Act of 1958 Title V, 15 U.S.C. 695 et seq. |
| South Dakota | 175 | $84.0 million | $480,141 | First Bank & Trust ($14.0 million, 23 loans) | First Bank & Trust (23 loans) | 95 | $77.6 million | Dakota Business Finance (52 loans) | 7(a): Small Business Act §7(a), 15 U.S.C. 636(a); 504: Small Business Investment Act of 1958 Title V, 15 U.S.C. 695 et seq. |
| Tennessee | 1,020 | $546.9 million | $536,149 | Pinnacle Bank ($44.2 million, 35 loans) | Northeast Bank (124 loans) | 26 | $46.6 million | Brightbridge, Inc. (19 loans) | 7(a): Small Business Act §7(a), 15 U.S.C. 636(a); 504: Small Business Investment Act of 1958 Title V, 15 U.S.C. 695 et seq. |
| Texas | 6,294 | $4.07 billion | $646,032 | Live Oak Banking Company ($313.8 million, 230 loans) | Northeast Bank (682 loans) | 342 | $559.6 million | Capital Certified Development Corporation (137 loans) | 7(a): Small Business Act §7(a), 15 U.S.C. 636(a); 504: Small Business Investment Act of 1958 Title V, 15 U.S.C. 695 et seq. |
| Utah | 1,346 | $611.6 million | $454,406 | Mountain America FCU ($44.7 million, 164 loans) | Zions Bank, A Division of (264 loans) | 250 | $309.8 million | Mountain West Small Business Finance (182 loans) | 7(a): Small Business Act §7(a), 15 U.S.C. 636(a); 504: Small Business Investment Act of 1958 Title V, 15 U.S.C. 695 et seq. |
| Vermont | 209 | $60.1 million | $287,736 | Community National Bank ($9.6 million, 26 loans) | TD Bank, National Association (45 loans) | 19 | $22.4 million | Granite State Economic Development Corporation (17 loans) | 7(a): Small Business Act §7(a), 15 U.S.C. 636(a); 504: Small Business Investment Act of 1958 Title V, 15 U.S.C. 695 et seq. |
| Virginia | 1,499 | $757.4 million | $505,259 | Live Oak Banking Company ($61.2 million, 54 loans) | Northeast Bank (188 loans) | 126 | $113.8 million | Business Finance Group, Inc. (66 loans) | 7(a): Small Business Act §7(a), 15 U.S.C. 636(a); 504: Small Business Investment Act of 1958 Title V, 15 U.S.C. 695 et seq. |
| Washington | 2,218 | $1.13 billion | $507,566 | Readycap Lending, LLC ($109.6 million, 103 loans) | Columbia Bank (252 loans) | 116 | $127.3 million | Evergreen Business Capital (46 loans) | 7(a): Small Business Act §7(a), 15 U.S.C. 636(a); 504: Small Business Investment Act of 1958 Title V, 15 U.S.C. 695 et seq. |
| West Virginia | 211 | $69.7 million | $330,294 | The Huntington National Bank ($13.6 million, 80 loans) | The Huntington National Bank (80 loans) | 3 | $4.2 million | Business Finance Group, Inc. (1 loans) | 7(a): Small Business Act §7(a), 15 U.S.C. 636(a); 504: Small Business Investment Act of 1958 Title V, 15 U.S.C. 695 et seq. |
| Wisconsin | 1,126 | $550.0 million | $488,488 | Old National Bank ($59.6 million, 54 loans) | U.S. Bank, National Association (116 loans) | 200 | $205.4 million | WBD, Inc. (166 loans) | 7(a): Small Business Act §7(a), 15 U.S.C. 636(a); 504: Small Business Investment Act of 1958 Title V, 15 U.S.C. 695 et seq. |
| Wyoming | 149 | $70.8 million | $474,878 | First Internet Bank of Indiana ($7.7 million, 5 loans) | Northeast Bank (29 loans) | 22 | $13.9 million | Mountain West Small Business Finance (14 loans) | 7(a): Small Business Act §7(a), 15 U.S.C. 636(a); 504: Small Business Investment Act of 1958 Title V, 15 U.S.C. 695 et seq. |
Which states get the most SBA loans?
California, Texas and Florida, by a wide margin. California borrowers got $4.81 billion in 7(a) loans in FY2025, Texas $4.07 billion and Florida $3.23 billion. New York came fourth at $1.83 billion.
Size explains most of it. More businesses means more borrowers. But the gaps between states are not just population. Texas approved slightly fewer loans than Florida, 6,294 against 6,303, yet lent far more because the average Texas loan was $646,032.
New York shows the opposite pattern. It had 5,300 loans, the fourth most, but an average of only $345,066. That points to a mix weighted toward smaller loans, the kind a restaurant or a shop might take to cover inventory and payroll.
So if you live in a smaller state, do not read a low total as a sign that SBA money is hard to get there. It mostly reflects fewer applicants. Several of the biggest SBA lenders work nationally and approve loans all over the country.
What is the average SBA loan size in my state?
The national average 7(a) loan in FY2025 was $477,571. Your state's figure is in the table above, and the spread is wide: North Dakota averaged $765,947, while Hawaii averaged $231,252.
Treat these as rough signals, not targets. An average blends a small line of credit for a coffee shop with a building purchase for a manufacturer. What it does tell you is the mix of deals in your state. High averages usually mean lots of business acquisitions, real estate and equipment. Low averages point to smaller working capital loans.
The useful question is not what the average is but what your loan is for. A modest loan to buy a delivery van and a large loan to buy an existing business go through very different underwriting, collateral and paperwork. Ask the lender which product fits before you fill in an application.
Who are the top SBA lenders, and does it matter which one you pick?
Two names stand out. Live Oak Banking Company approved $2.85 billion across 2,280 loans in FY2025, the most dollars of any lender, and led in dollars in 19 of the 50 states plus DC. Northeast Bank approved 7,800 loans, the most by count, and led by number of loans in 15 of the 50 states plus DC.
Those two lenders run very different businesses. Live Oak writes fewer, larger loans and works across the country with specific industries. Northeast Bank writes many smaller loans. The Huntington National Bank is the regional giant: in Ohio alone it approved 1,691 loans, and in Michigan 1,060.
It matters which one you pick. Big SBA lenders have done thousands of deals, so they often move faster and know the rules well. A local bank or credit union may know your market and be easier to reach when something goes wrong. Talk to at least two or three. Compare the rate, the fees, the collateral they want and how quickly they say they can close.
How do you find an SBA lender in your state?
Start with the state table above. For every state it lists the top lender by dollars and the top lender by number of loans. Those are often different, and the gap tells you something.
In many states the dollar leader is a national lender like Live Oak, while the count leader is a bank that writes lots of smaller loans. In Oklahoma, BancFirst led on both, with 88 loans. In Arkansas it was Southern Bancorp Bank with 41 loans. In Utah, Mountain America FCU led by dollars with 164 loans, and in Idaho, Idaho Central CU led by dollars with 86 loans. Credit unions and state banks show up more often than people expect.
That matters if you run a small business outside a big city. A lender that already does SBA deals in your state knows local property values, local industries and the SBA district office. Ask any lender you talk to how many SBA loans it closed last year and whether it has preferred lender status, which lets it approve loans without sending each file to SBA for a decision.
For 504 loans, look at the top CDC column. In Wisconsin, WBD, Inc. handled 166 loans. In Utah, Mountain West Small Business Finance handled 182. Calling the busiest CDC in your state is a quick way to learn whether your building purchase fits the program.
7(a) or 504: which SBA loan fits?
The 7(a) program is the general purpose loan. People use it for working capital, equipment, inventory, refinancing debt and buying a business. The 504 program is narrower. It funds buildings, land and large equipment through a Certified Development Company, which partners with a bank.
In FY2025 SBA approved $7.80 billion in 504 loans across 6,762 deals. That figure is only the CDC's share, so the total projects were larger. California led 504 lending at $1.79 billion, and Florida followed at $773.9 million.
If you are buying the building you operate from, ask about 504. The down payment can be lower, and the rate on the CDC portion is usually fixed for the long term. If you need money for anything else, or a mix of things, 7(a) is usually the starting point. Some borrowers use both: a 504 loan for the building and a smaller 7(a) loan for equipment and working capital.
What to do before you apply and before you sign
- Get quotes from at least two lenders, one national SBA lender and one local bank or credit union.
- Ask for the full list of fees in writing: SBA guarantee fee, packaging fee, closing costs and any prepayment penalty.
- Find out whether the rate is fixed or variable, and what index a variable rate follows.
- Ask what collateral they will take, including whether they want a lien on your home.
- Expect a personal guarantee if you are a major owner, and read exactly what it covers.
- Read the default and covenant sections before closing, not after. Those are the clauses that decide what happens in a bad year.
- Ask for the closing documents several days early, so you are not reading a stack of paper at the closing table.
- Check whether the lender will sell or transfer the loan servicing, and who you call if you need a payment change later.
How ClauseAudit helps
Getting approved is the easy part to celebrate. The loan agreement, note and guarantee are where the real terms live, and most borrowers sign them at closing with little time to read.
ClauseAudit's automated review reads your business financing documents and flags the clauses that cost money or create personal risk, with plain English explanations and suggested changes you can raise with the lender.
- Personal guarantee scope: unlimited, capped, and whether it covers your spouse or home
- Variable rate terms, the index used and how often the rate resets
- Prepayment penalties and fees charged if you refinance or sell early
- Default triggers, including cross-default and material adverse change clauses
- Financial covenants and reporting deadlines that can put you in default on paper
- Collateral and blanket lien language that reaches more assets than the loan needs
Frequently asked questions
Which state gets the most SBA loans?
California. In FY2025 its businesses received $4.81 billion in SBA 7(a) loans across 9,690 approvals, more than any other state by both dollars and loan count. Texas was second by dollars at $4.07 billion, and Florida was second by count with 6,303 loans.
How many SBA loans were approved in FY2025?
SBA approved 78,078 7(a) loans worth $37.29 billion in FY2025, which ran from October 2024 to September 2025. That is the most loans since FY2007 and the highest 7(a) dollar total in SBA's records back to FY1991. It also approved 6,762 504 loans worth $7.80 billion.
What is the average SBA loan amount?
The average 7(a) loan in FY2025 was $477,571 nationwide. It varies a lot by state. North Dakota averaged $765,947 and Hawaii $231,252. Your own loan size depends on what you are financing, your cash flow and collateral, not on your state's average.
Who is the biggest SBA lender?
By dollars, Live Oak Banking Company, which approved $2.85 billion in 7(a) loans across 2,280 deals in FY2025. By number of loans, Northeast Bank led with 7,800 approvals. Both lend across the country, not just in their home states.
Is it easier to get an SBA loan in some states?
Not really. SBA rules are the same in every state, and the big SBA lenders work nationally. What differs is local competition. In states with many active SBA lenders you may get more offers and better terms, so it pays to shop around wherever you are.
Should I use a national SBA lender or a local bank?
Ask both. National lenders that close thousands of SBA loans a year often know the paperwork well and move quickly. A local bank or credit union may be more flexible on your situation and easier to reach later. Compare rate, fees, collateral and closing time side by side.
What is the difference between SBA 7(a) and 504 loans?
A 7(a) loan is general purpose: working capital, equipment, inventory, refinancing or buying a business. A 504 loan pays for owner-occupied real estate and large equipment, with a Certified Development Company funding part of the deal alongside a bank. The 504 figures here count only the CDC portion.
Do SBA loans require a personal guarantee?
Yes, in most cases. SBA generally requires anyone who owns 20% or more of the business to personally guarantee the loan. That means your personal assets can be on the line if the business cannot pay. Read the guarantee carefully, including what collateral it reaches and whether it survives a sale of the business.
Where does this SBA data come from?
Every figure comes from the U.S. Small Business Administration's FY2025 year-end reports, with data as of September 30, 2025. State totals are sums of congressional district figures. Lender rankings come from SBA's 7(a) lender activity report, and 504 figures from its CDC activity report.
Use this data
Every chart and card below is free to reuse under CC BY 4.0. Download what you need and link back to this page.
 Stat cards
 Key findings card
 Infographic
 SBA 7(a) loan dollars approved by state, FY2025 (top 15) (USD millions)
 Number of SBA 7(a) loans approved by state, FY2025 (top 15)
 Highest average SBA 7(a) loan size by state, FY2025 (USD)
 Lowest average SBA 7(a) loan size by state, FY2025 (USD)
 SBA 7(a) loan dollars approved per fiscal year, FY2016 to FY2025 (USD billions)
 SBA 504 loan dollars approved by state, FY2025 (top 10) (USD millions)
 Largest SBA 7(a) lenders by dollars approved, FY2025
 SBA 7(a) and 504 approvals by fiscal year, FY2021 to FY2025
 Largest SBA 504 Certified Development Companies by dollars approved, FY2025
Embed the infographic
Free to share on your site, blog or slides under CC BY 4.0. Please keep the credit link.
Sources and method
Every number on this page comes from the sources below, each opened and read on or before October 18, 2026. A second, independent review checked every figure against its source and corrected anything that did not match. 51 of 51 state entries were confirmed; any that could not be are marked "Not yet confirmed" and left out of every count and chart.
- U.S. Small Business Administration, Office of Capital Access, FYE25 Monthly & Yearly Activity Report (7(a) and 504, FY1991 to FY2025), Yearly tab (Issued November 13, 2025; data as of 9/30/2025)
- U.S. Small Business Administration, Office of Capital Access, FYE25 Congressional District Approvals Report (7(a) and 504 tabs) (Issued November 13, 2025; data as of 9/30/2025)
- U.S. Small Business Administration, Office of Capital Access, FYE25 7(a) Lender Activity Report (Lender and Lender_ProjSt tabs) (Issued November 13, 2025; data as of 9/30/2025)
- U.S. Small Business Administration, Office of Capital Access, FYE25 504 CDC Activity Report (CDC and CDC_ProjSt tabs) (Issued November 13, 2025; data as of 9/30/2025)
- U.S. Small Business Administration (SBA open data), 7(a) & 504 Activity Reports: FY2025 Year End (Issue date November 13, 2025)
Cite this page
ClauseAudit, “SBA Loans by State: Volume, Average Size and Top Lenders in Each State”, updated October 18, 2026, https://clauseaudit.com/data/sba-loans-by-state. Free to reuse with a link back (CC BY 4.0).
This page summarises published data and law as checked on October 18, 2026. Figures are updated as new editions are released, and your own situation may differ. It is general information, not legal, tax or financial advice.