Franchise Failure Rate: What SBA Loan Data, FDD Item 20 and BLS Survival Data Actually Show
By ClauseAudit Research · 9 sources ·
What is the franchise failure rate?
Franchises fail at about the same rate as independent businesses. Across SBA 7(a) loans approved FY1992-2026 that were paid off or charged off, 16.0% of franchise loans were charged off versus 15.8% for independents. The real risk sits in the brand you pick: some brands ran SBA default rates of at least 46% on loans disbursed 2002-2009.
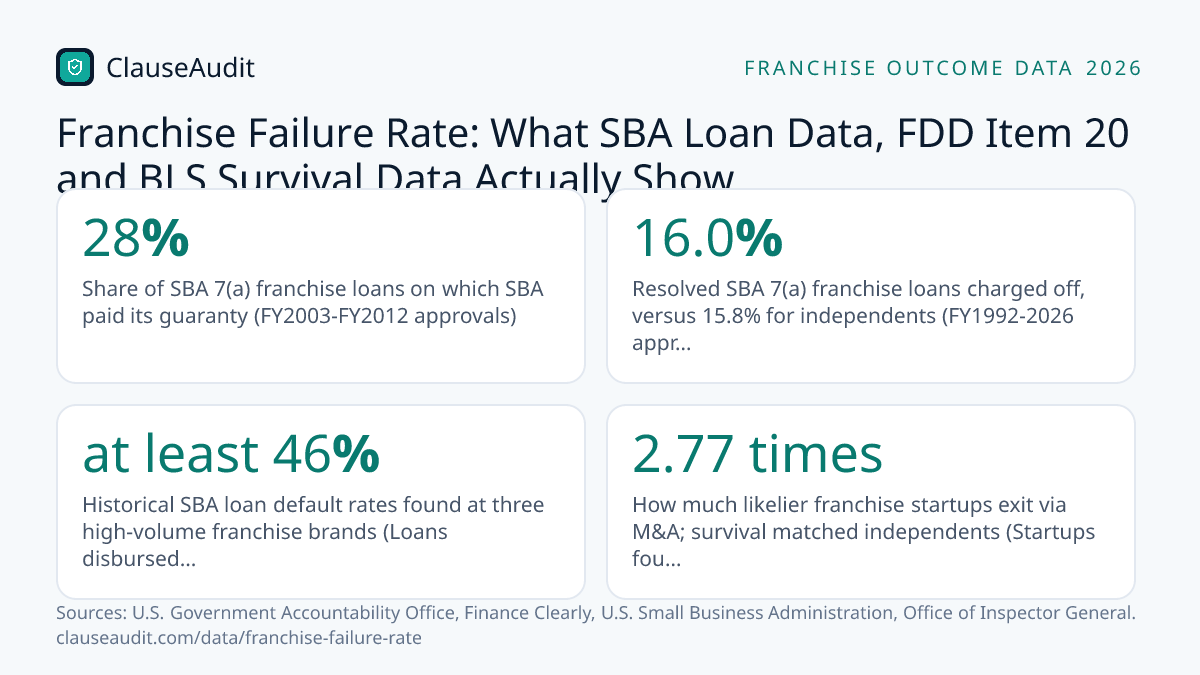
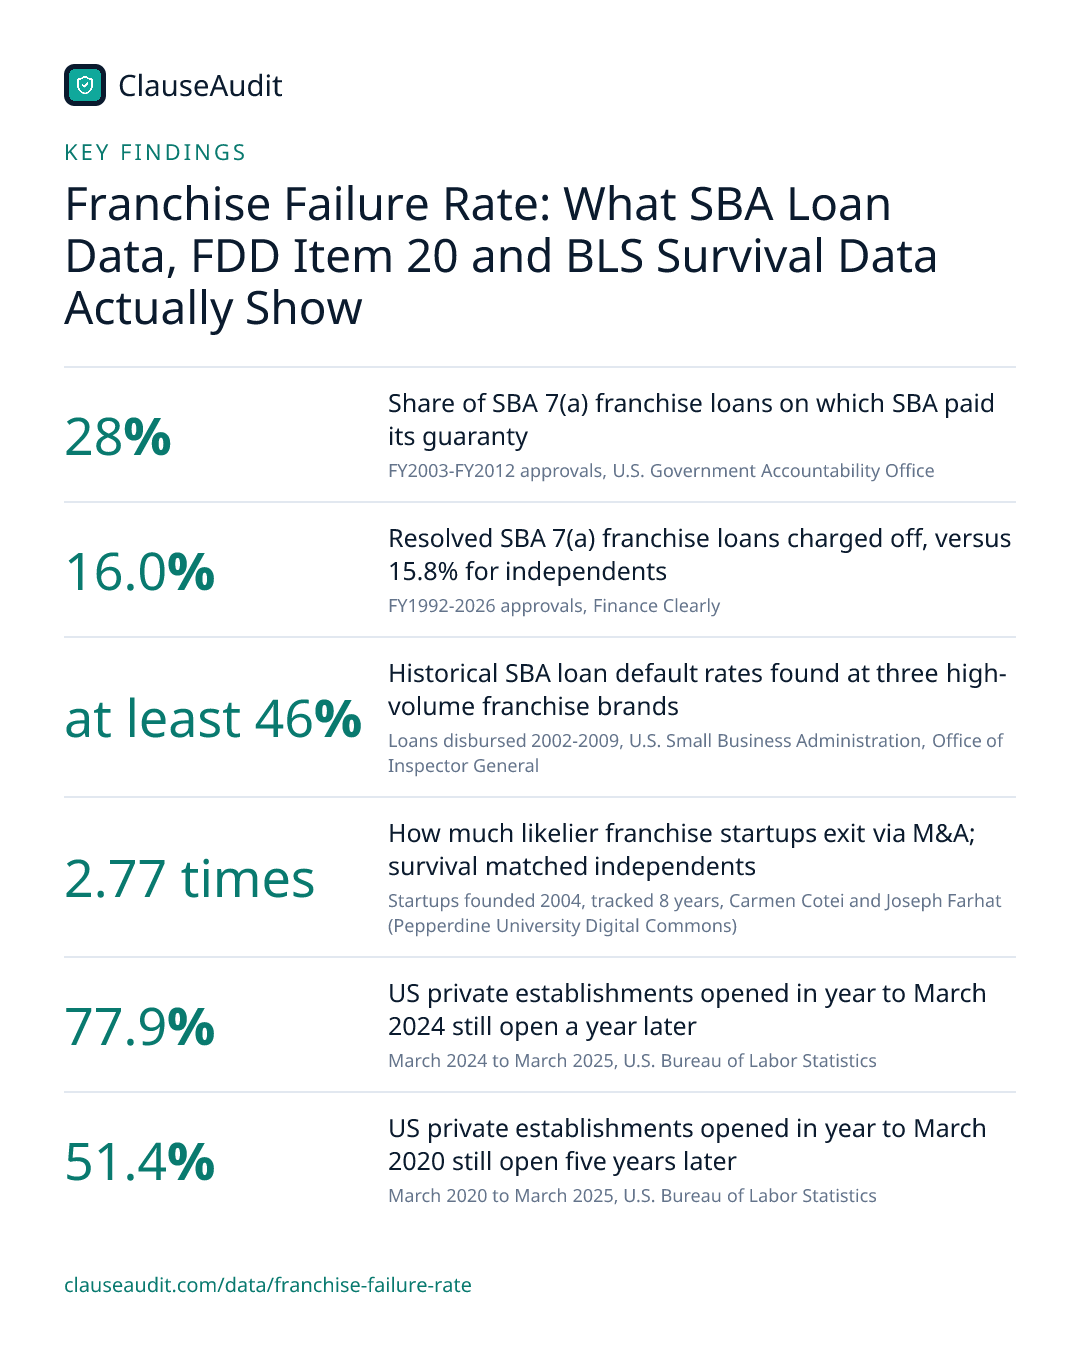
- Share of SBA 7(a) franchise loans on which SBA paid its guaranty (FY2003-FY2012 approvals, U.S. Government Accountability Office)
- 28%
- Resolved SBA 7(a) franchise loans charged off, versus 15.8% for independents (FY1992-2026 approvals, Finance Clearly)
- 16.0%
- Historical SBA loan default rates found at three high-volume franchise brands (Loans disbursed 2002-2009, U.S. Small Business Administration, Office of Inspector General)
- at least 46%
- How much likelier franchise startups exit via M&A; survival matched independents (Startups founded 2004, tracked 8 years, Carmen Cotei and Joseph Farhat (Pepperdine University Digital Commons))
- 2.77 times
- US private establishments opened in year to March 2024 still open a year later (March 2024 to March 2025, U.S. Bureau of Labor Statistics)
- 77.9%
- US private establishments opened in year to March 2020 still open five years later (March 2020 to March 2025, U.S. Bureau of Labor Statistics)
- 51.4%
- US private establishments opened in year to March 2015 still open ten years later (March 2015 to March 2025, U.S. Bureau of Labor Statistics)
- 34.7%
- FRANdata's expected 2025 historical unit success rate for US franchise units (2025 (expected), International Franchise Association and FRANdata)
- ~94.2%
You have probably heard that franchises almost never fail, or that most of them do. Neither claim holds up. The best public evidence, more than a million SBA loans tracked to the end, shows franchise borrowers default at almost the same rate as everyone else.
What changes the odds is the brand, the year you buy in and the contract you sign. This page pulls together SBA loan outcomes, BLS survival tables, FDD Item 20 rules and industry figures, and explains why they give such different answers.
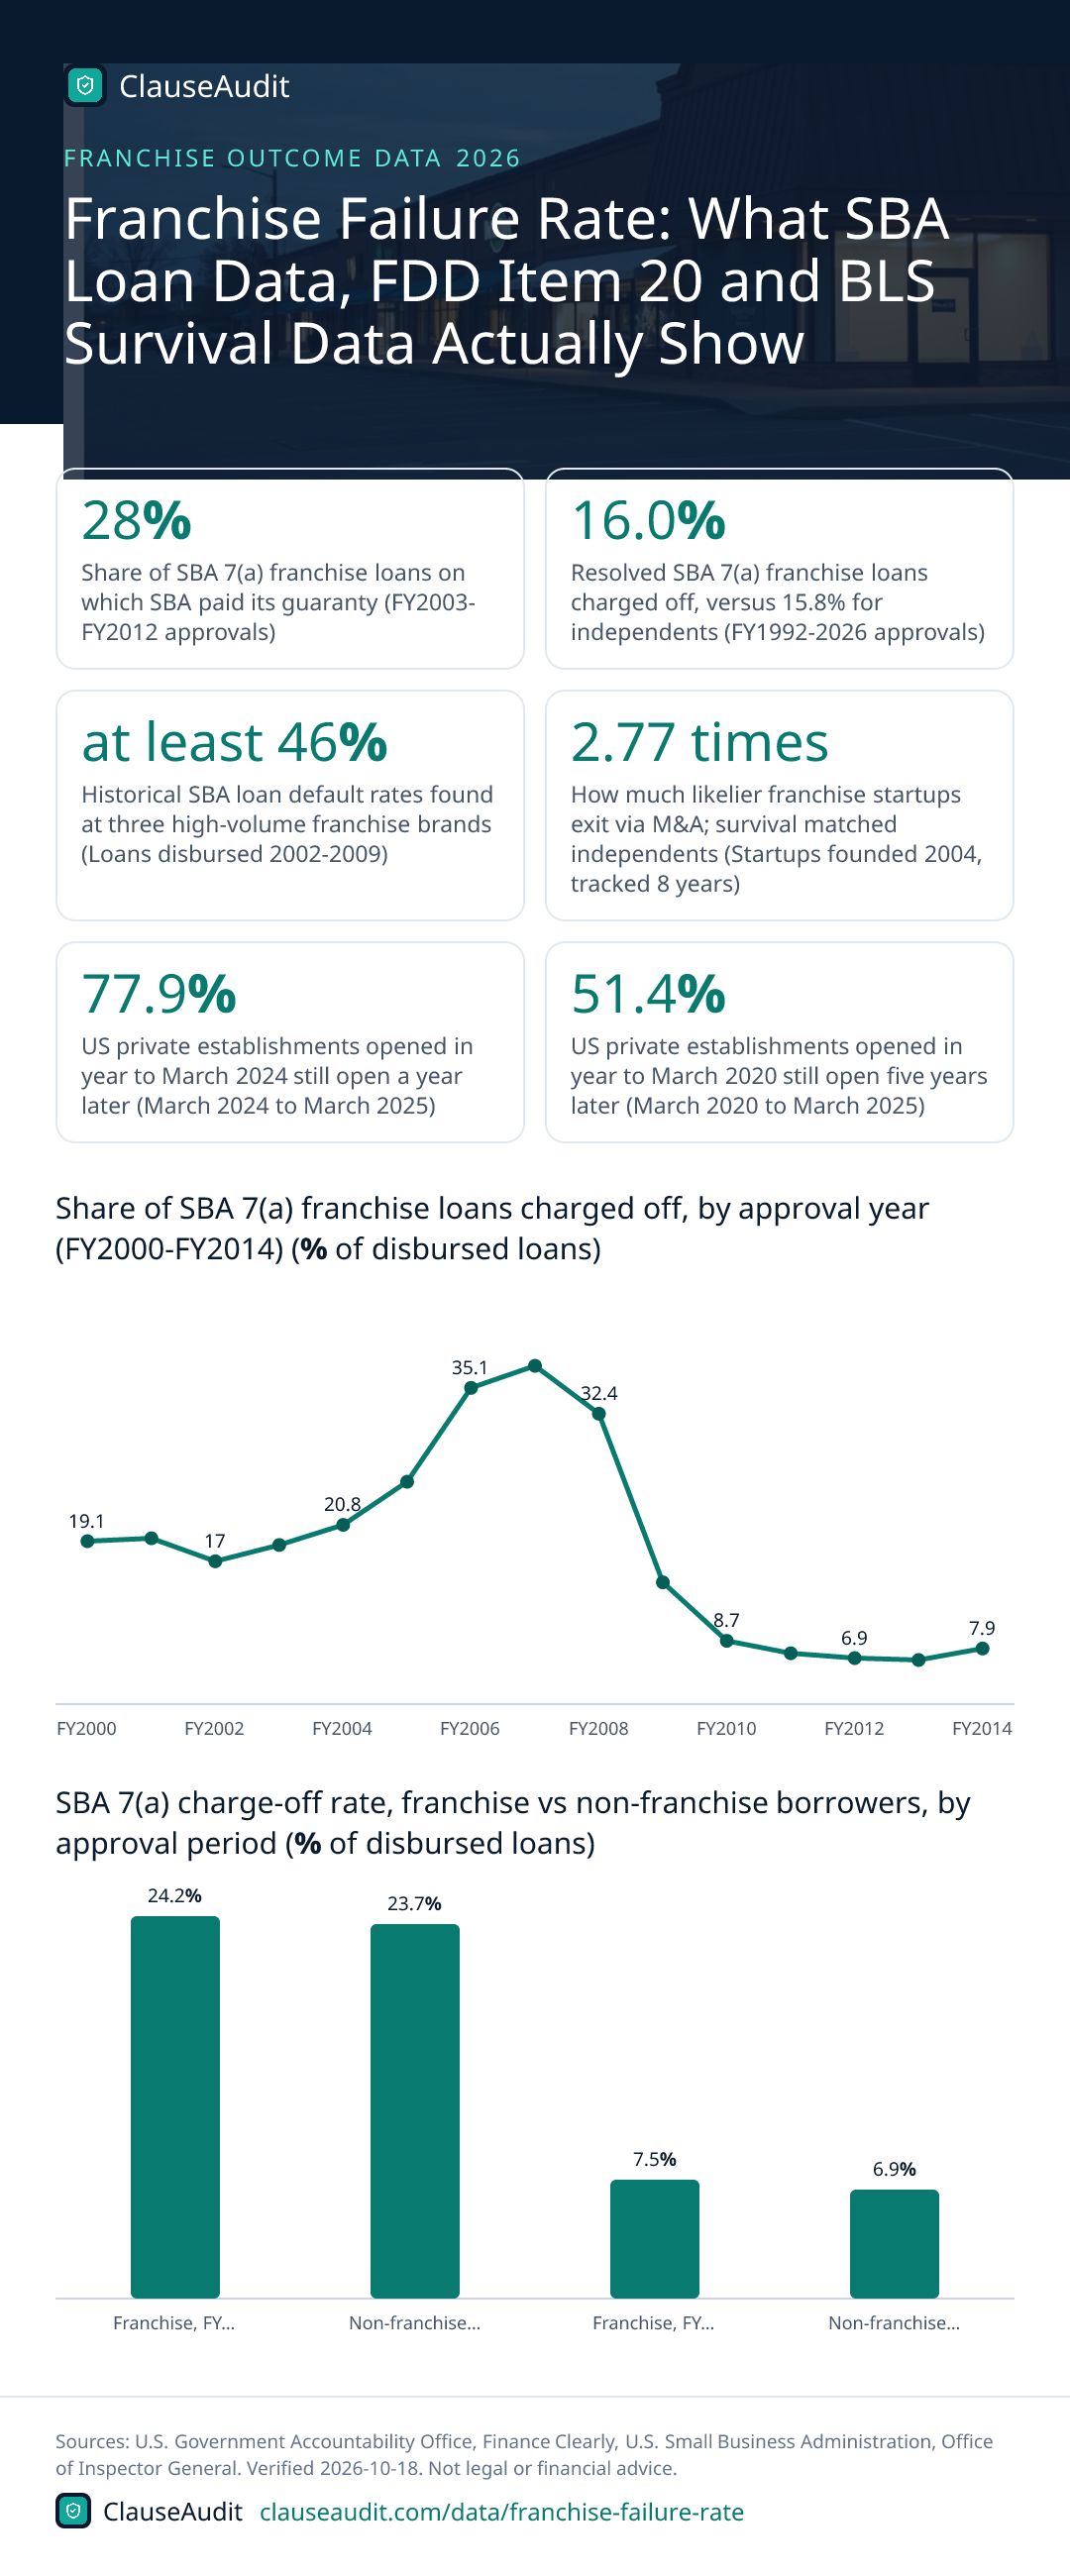
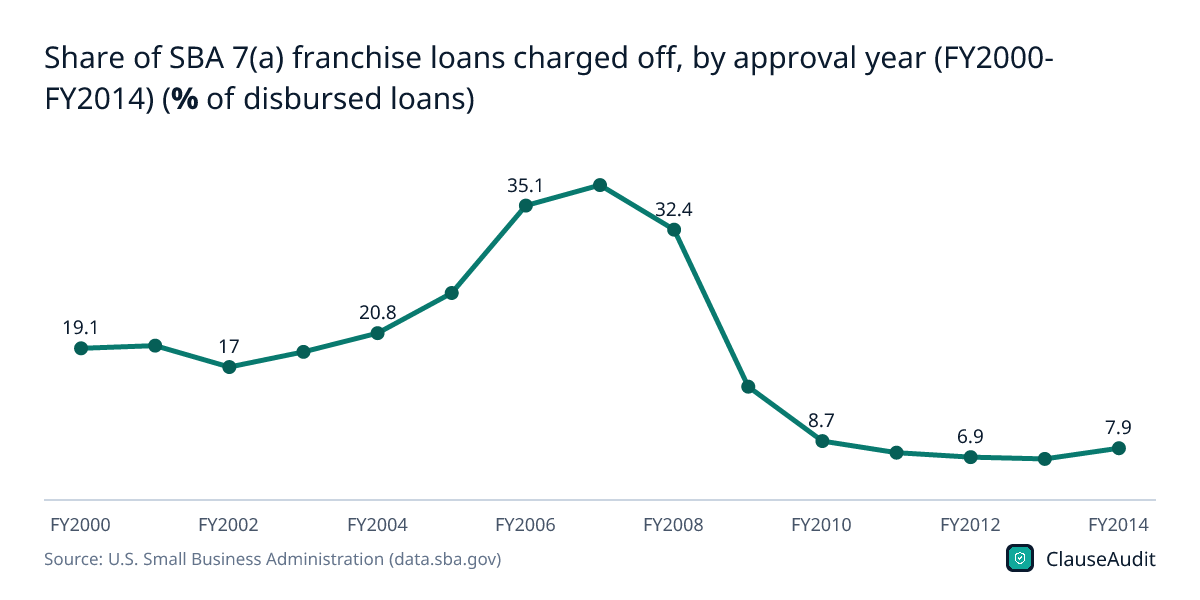
Share of SBA 7(a) franchise loans charged off, by approval year (FY2000-FY2014) (% of disbursed loans)
Chart data
| Label | Value (% of disbursed loans) |
|---|---|
| FY2000 | 19.1 |
| FY2001 | 19.4 |
| FY2002 | 17 |
| FY2003 | 18.7 |
| FY2004 | 20.8 |
| FY2005 | 25.3 |
| FY2006 | 35.1 |
| FY2007 | 37.4 |
| FY2008 | 32.4 |
| FY2009 | 14.8 |
| FY2010 | 8.7 |
| FY2011 | 7.4 |
| FY2012 | 6.9 |
| FY2013 | 6.7 |
| FY2014 | 7.9 |
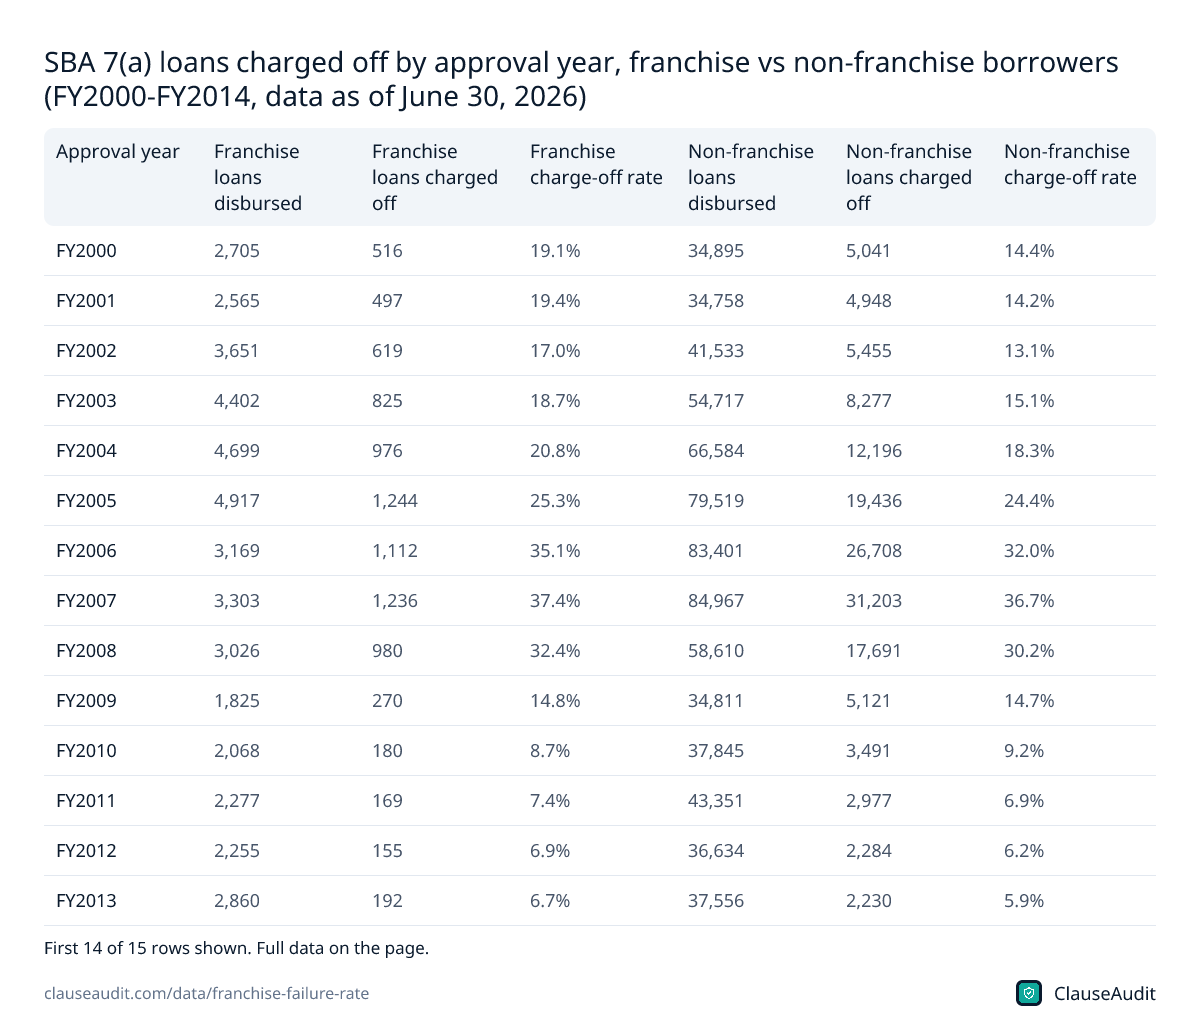
The year you borrowed mattered more than almost anything else. Franchise loans approved in FY2007 were charged off at 37.4%, while FY2013 loans came in at 6.7%, because the earlier group opened right into a recession.
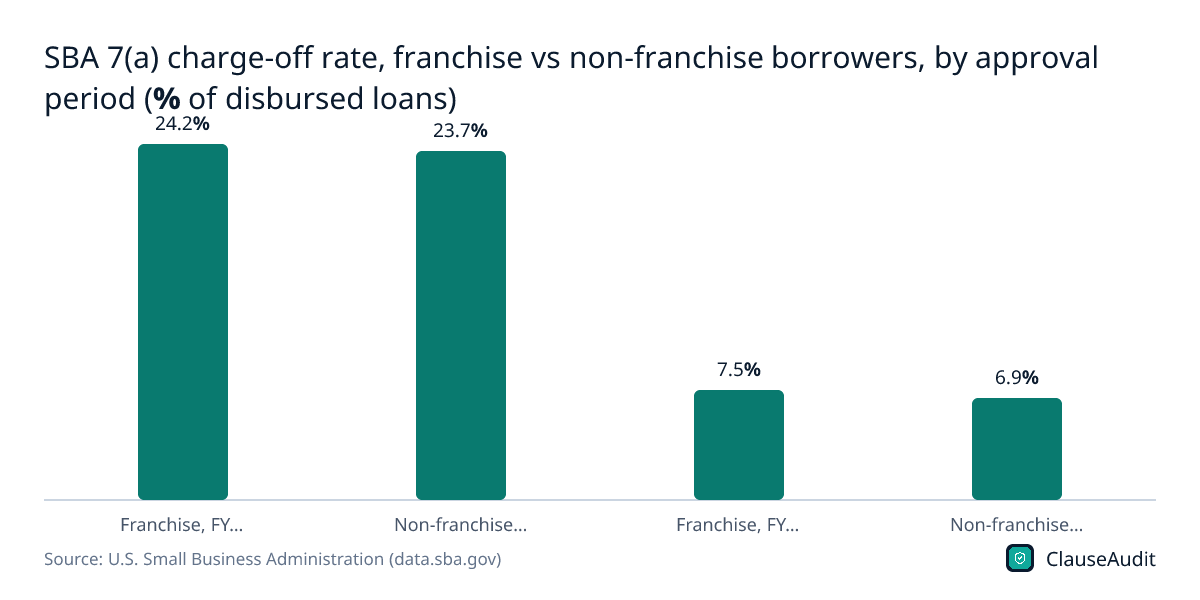
Download this chart (PNG)SBA 7(a) charge-off rate, franchise vs non-franchise borrowers, by approval period (% of disbursed loans)
Chart data
| Label | Value (% of disbursed loans) |
|---|---|
| Franchise, FY2000-FY2009 | 24.2% |
| Non-franchise, FY2000-FY2009 | 23.7% |
| Franchise, FY2010-FY2014 | 7.5% |
| Non-franchise, FY2010-FY2014 | 6.9% |
In both periods the franchise and non-franchise bars sit within a point of each other. Pooled across FY2000-FY2014 the rates are 19.40% and 19.41%, so the brand name did not buy lower risk on average.
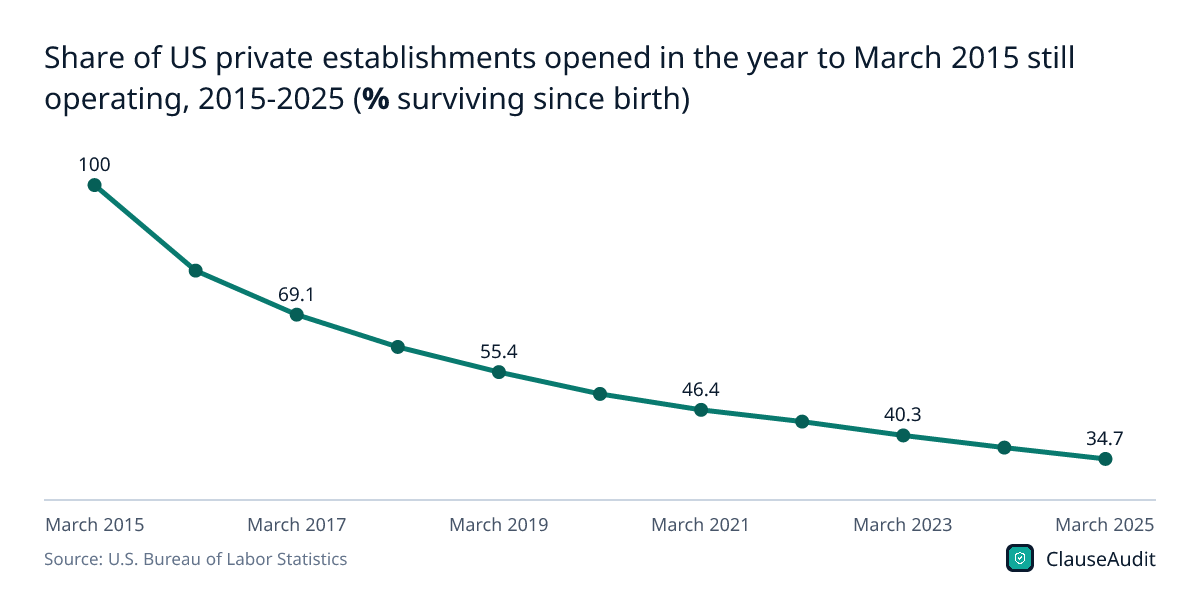
Download this chart (PNG)Share of US private establishments opened in the year to March 2015 still operating, 2015-2025 (% surviving since birth)
Chart data
| Label | Value (% surviving since birth) |
|---|---|
| March 2015 | 100 |
| March 2016 | 79.6 |
| March 2017 | 69.1 |
| March 2018 | 61.4 |
| March 2019 | 55.4 |
| March 2020 | 50.2 |
| March 2021 | 46.4 |
| March 2022 | 43.6 |
| March 2023 | 40.3 |
| March 2024 | 37.4 |
| March 2025 | 34.7 |
The steepest drop comes in the first year, when the share still open falls to 79.6%. After that the decline slows, but it never stops: by March 2025 only 34.7% of the 2015 class remained.
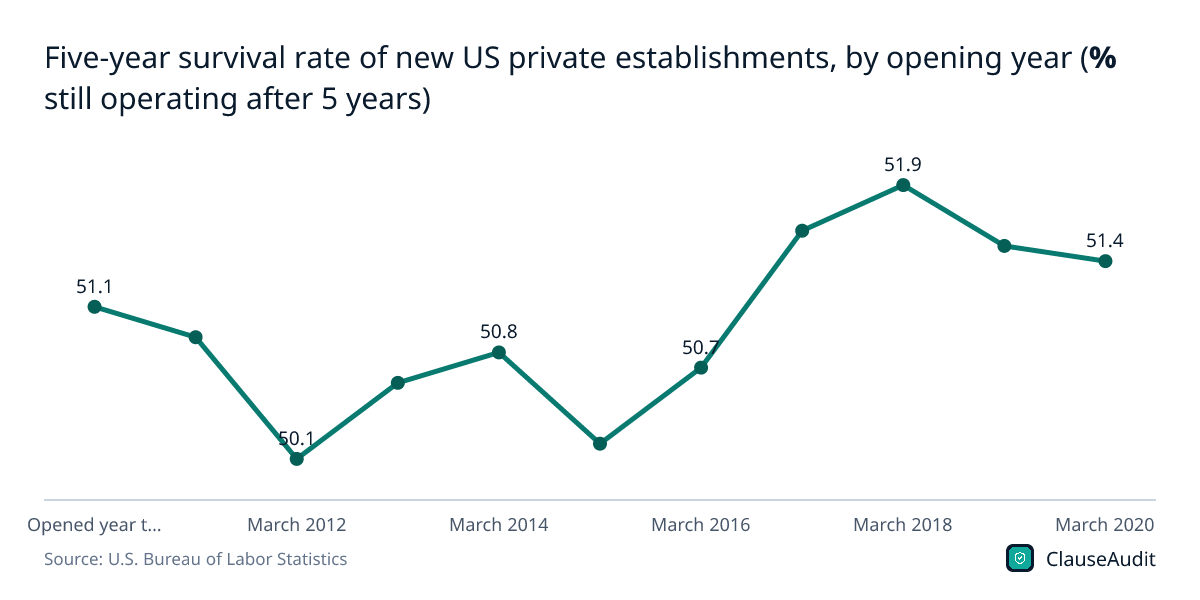
Download this chart (PNG)Five-year survival rate of new US private establishments, by opening year (% still operating after 5 years)
Chart data
| Label | Value (% still operating after 5 years) |
|---|---|
| Opened year to March 2010 | 51.1 |
| March 2011 | 50.9 |
| March 2012 | 50.1 |
| March 2013 | 50.6 |
| March 2014 | 50.8 |
| March 2015 | 50.2 |
| March 2016 | 50.7 |
| March 2017 | 51.6 |
| March 2018 | 51.9 |
| March 2019 | 51.5 |
| March 2020 | 51.4 |
Five-year survival has barely moved in a decade, staying between 50.1% and 51.9% for every opening year shown. Any franchise pitch should be measured against that flat baseline.
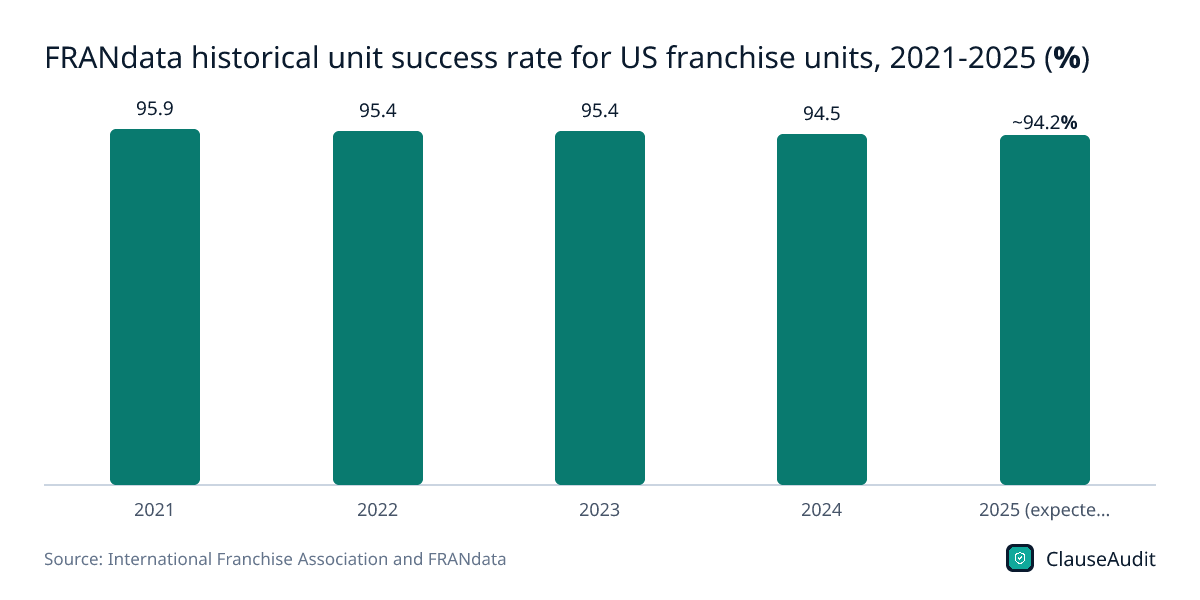
Download this chart (PNG)FRANdata historical unit success rate for US franchise units, 2021-2025 (%)
Chart data
| Label | Value (%) |
|---|---|
| 2021 | 95.9 |
| 2022 | 95.4 |
| 2023 | 95.4 |
| 2024 | 94.5 |
| 2025 (expected) | ~94.2% |
This is an industry-sponsored success measure that treats some closed units as successes. It slipped from 95.9% in 2021 to about 94.2% expected for 2025, but it is not a failure rate and should not be compared with SBA or BLS figures.
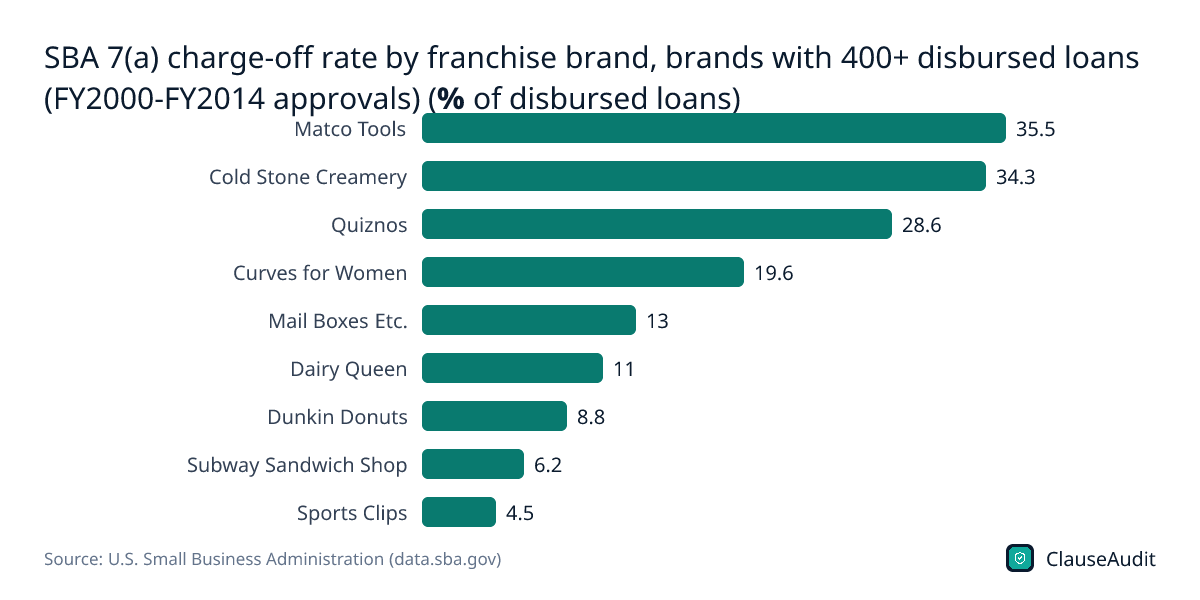
Download this chart (PNG)SBA 7(a) charge-off rate by franchise brand, brands with 400+ disbursed loans (FY2000-FY2014 approvals) (% of disbursed loans)
Chart data
| Label | Value |
|---|---|
| Matco Tools | 35.5 |
| Cold Stone Creamery | 34.3 |
| Quiznos | 28.6 |
| Curves for Women | 19.6 |
| Mail Boxes Etc. | 13 |
| Dairy Queen | 11 |
| Dunkin Donuts | 8.8 |
| Subway Sandwich Shop | 6.2 |
| Sports Clips | 4.5 |
Same lender program, same years, very different results. Matco Tools loans were charged off at 35.5% and Sports Clips at 4.5%, which is why a single industry-wide failure rate tells you little about the brand in front of you.
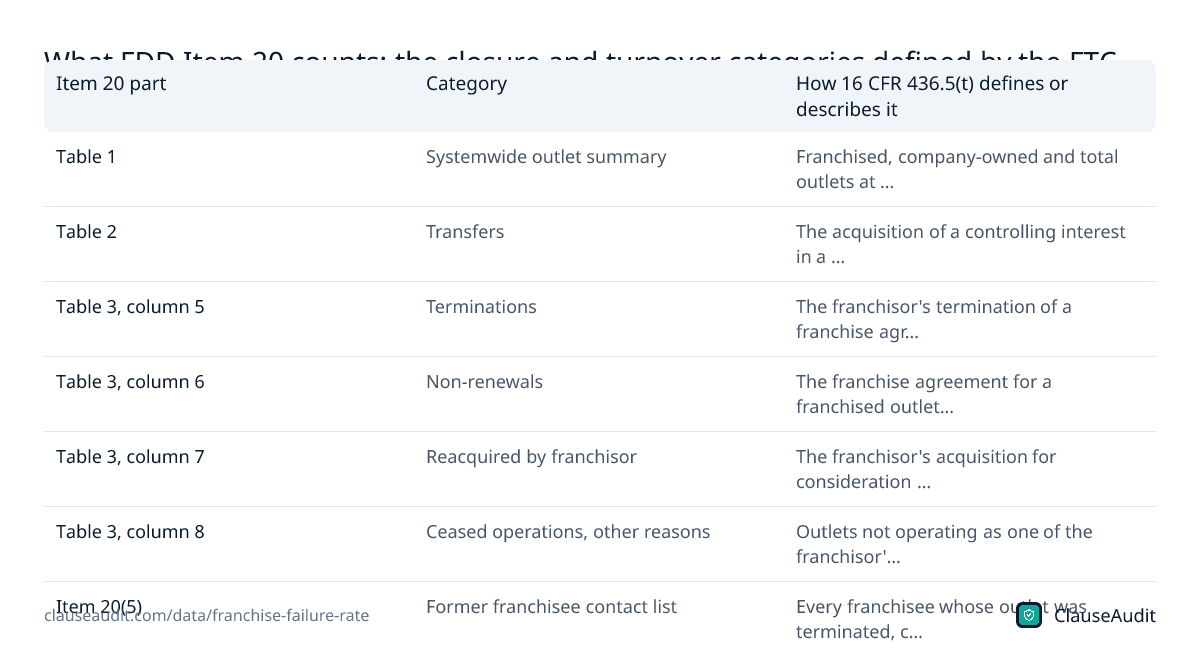
Download this chart (PNG)What FDD Item 20 counts: the closure and turnover categories defined by the FTC Franchise Rule
| Item 20 part | Category | How 16 CFR 436.5(t) defines or describes it |
|---|---|---|
| Table 1 | Systemwide outlet summary | Franchised, company-owned and total outlets at the start and end of each of the last three fiscal years, with the net change |
| Table 2 | Transfers | The acquisition of a controlling interest in a franchised outlet, during its term, by a person other than the franchisor or an affiliate |
| Table 3, column 5 | Terminations | The franchisor's termination of a franchise agreement prior to the end of its term and without providing any consideration to the franchisee |
| Table 3, column 6 | Non-renewals | The franchise agreement for a franchised outlet is not renewed at the end of its term |
| Table 3, column 7 | Reacquired by franchisor | The franchisor's acquisition for consideration of a franchised outlet during its term |
| Table 3, column 8 | Ceased operations, other reasons | Outlets not operating as one of the franchisor's outlets at year end for reasons other than termination, non-renewal or reacquisition |
| Item 20(5) | Former franchisee contact list | Every franchisee whose outlet was terminated, cancelled, not renewed or otherwise ceased to do business in the most recently completed fiscal year, or who has not communicated with the franchisor within 10 weeks of the issuance date |
| Item 20(7) | Confidentiality clauses | Whether franchisees signed confidentiality clauses during the last three fiscal years, with a required warning that some former franchisees may not be able to speak |
Source: Electronic Code of Federal Regulations (National Archives and GPO), 16 CFR 436.5 Disclosure items, paragraph (t) Item 20: Outlets and Franchisee Information (FTC Franchise Rule). Download as image
SBA 7(a) loans charged off by approval year, franchise vs non-franchise borrowers (FY2000-FY2014, data as of June 30, 2026)
| Approval year | Franchise loans disbursed | Franchise loans charged off | Franchise charge-off rate | Non-franchise loans disbursed | Non-franchise loans charged off | Non-franchise charge-off rate |
|---|---|---|---|---|---|---|
| FY2000 | 2,705 | 516 | 19.1% | 34,895 | 5,041 | 14.4% |
| FY2001 | 2,565 | 497 | 19.4% | 34,758 | 4,948 | 14.2% |
| FY2002 | 3,651 | 619 | 17.0% | 41,533 | 5,455 | 13.1% |
| FY2003 | 4,402 | 825 | 18.7% | 54,717 | 8,277 | 15.1% |
| FY2004 | 4,699 | 976 | 20.8% | 66,584 | 12,196 | 18.3% |
| FY2005 | 4,917 | 1,244 | 25.3% | 79,519 | 19,436 | 24.4% |
| FY2006 | 3,169 | 1,112 | 35.1% | 83,401 | 26,708 | 32.0% |
| FY2007 | 3,303 | 1,236 | 37.4% | 84,967 | 31,203 | 36.7% |
| FY2008 | 3,026 | 980 | 32.4% | 58,610 | 17,691 | 30.2% |
| FY2009 | 1,825 | 270 | 14.8% | 34,811 | 5,121 | 14.7% |
| FY2010 | 2,068 | 180 | 8.7% | 37,845 | 3,491 | 9.2% |
| FY2011 | 2,277 | 169 | 7.4% | 43,351 | 2,977 | 6.9% |
| FY2012 | 2,255 | 155 | 6.9% | 36,634 | 2,284 | 6.2% |
| FY2013 | 2,860 | 192 | 6.7% | 37,556 | 2,230 | 5.9% |
| FY2014 | 4,250 | 336 | 7.9% | 41,712 | 2,606 | 6.2% |
Source: U.S. Small Business Administration (data.sba.gov), 7(a) & 504 FOIA loan-level data: 7(a) files FY1991-FY1999, FY2000-FY2009, FY2010-FY2019 and FY2020-Present. Download as image
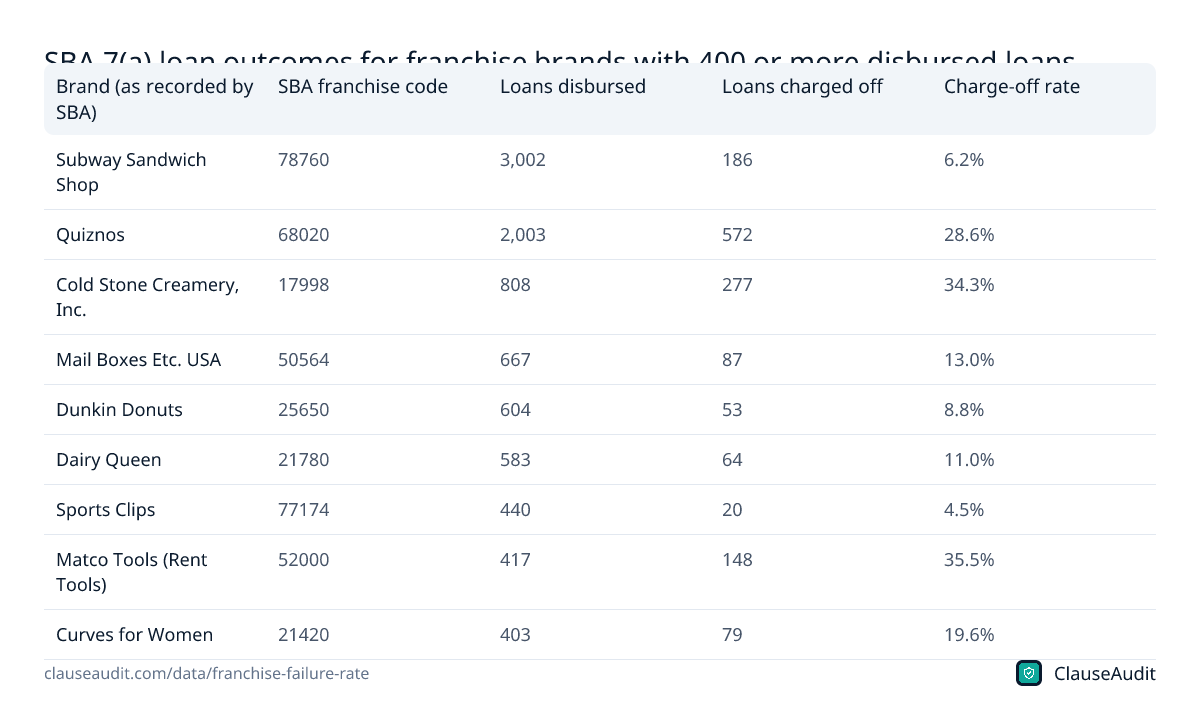
SBA 7(a) loan outcomes for franchise brands with 400 or more disbursed loans, FY2000-FY2014 approvals (data as of June 30, 2026)
| Brand (as recorded by SBA) | SBA franchise code | Loans disbursed | Loans charged off | Charge-off rate |
|---|---|---|---|---|
| Subway Sandwich Shop | 78760 | 3,002 | 186 | 6.2% |
| Quiznos | 68020 | 2,003 | 572 | 28.6% |
| Cold Stone Creamery, Inc. | 17998 | 808 | 277 | 34.3% |
| Mail Boxes Etc. USA | 50564 | 667 | 87 | 13.0% |
| Dunkin Donuts | 25650 | 604 | 53 | 8.8% |
| Dairy Queen | 21780 | 583 | 64 | 11.0% |
| Sports Clips | 77174 | 440 | 20 | 4.5% |
| Matco Tools (Rent Tools) | 52000 | 417 | 148 | 35.5% |
| Curves for Women | 21420 | 403 | 79 | 19.6% |
Source: U.S. Small Business Administration (data.sba.gov), 7(a) & 504 FOIA loan-level data: 7(a) files FY1991-FY1999, FY2000-FY2009, FY2010-FY2019 and FY2020-Present. Download as image
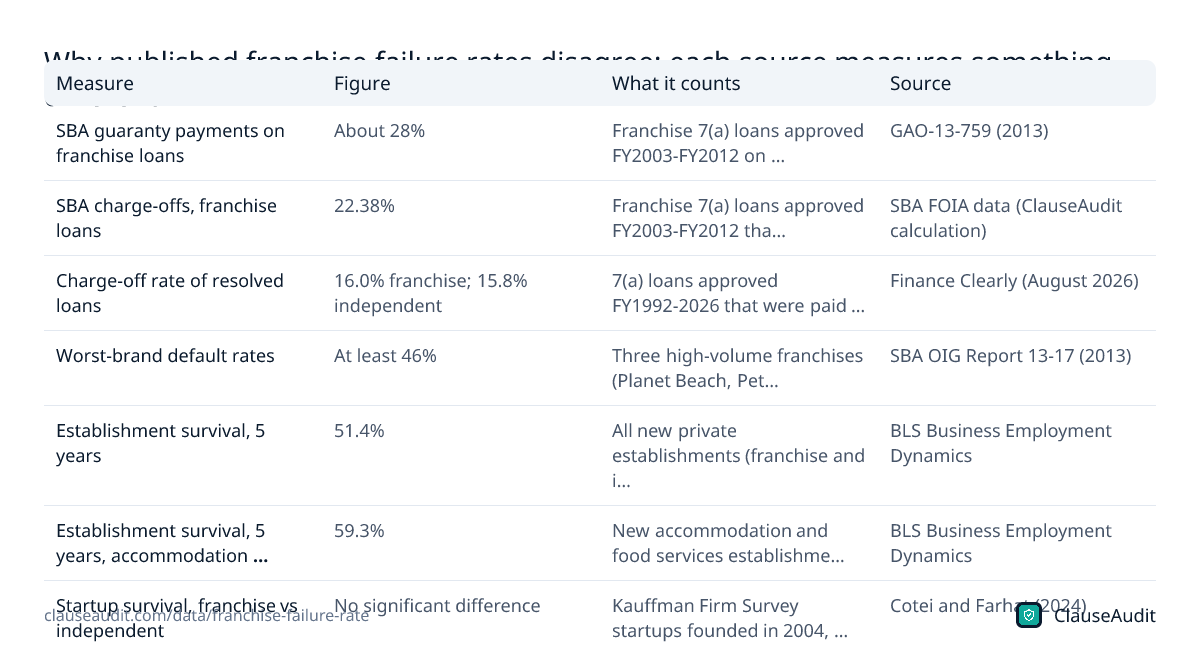
Why published franchise failure rates disagree: each source measures something different
| Measure | Figure | What it counts | Source |
|---|---|---|---|
| SBA guaranty payments on franchise loans | About 28% | Franchise 7(a) loans approved FY2003-FY2012 on which SBA paid lenders its guaranty (before recoveries) | GAO-13-759 (2013) |
| SBA charge-offs, franchise loans | 22.38% | Franchise 7(a) loans approved FY2003-FY2012 that were charged off, as of June 30, 2026 | SBA FOIA data (ClauseAudit calculation) |
| Charge-off rate of resolved loans | 16.0% franchise; 15.8% independent | 7(a) loans approved FY1992-2026 that were paid in full or charged off | Finance Clearly (August 2026) |
| Worst-brand default rates | At least 46% | Three high-volume franchises (Planet Beach, Petland, Cold Stone Creamery), loans issued Oct 1, 2002 to May 25, 2009 | SBA OIG Report 13-17 (2013) |
| Establishment survival, 5 years | 51.4% | All new private establishments (franchise and independent) opened in the year to March 2020 | BLS Business Employment Dynamics |
| Establishment survival, 5 years, accommodation and food services | 59.3% | New accommodation and food services establishments opened in the year to March 2020 | BLS Business Employment Dynamics |
| Startup survival, franchise vs independent | No significant difference | Kauffman Firm Survey startups founded in 2004, tracked eight years | Cotei and Farhat (2024) |
| Historical unit success rate | ~94.2% (2025 expected) | Franchise units, adjusted for non-operational factors; lender-repaid closures counted as successes | IFA and FRANdata 2026 Franchising Economic Outlook |
Source: U.S. Government Accountability Office, Small Business Administration: Review of 7(a) Guaranteed Loans to Select Franchisees (GAO-13-759); U.S. Small Business Administration (data.sba.gov), 7(a) & 504 FOIA loan-level data: 7(a) files FY1991-FY1999, FY2000-FY2009, FY2010-FY2019 and FY2020-Present; Finance Clearly, SBA 7(a) Charge-Off Rates by Franchise Brand, Industry and State (computed from SBA 7(a) loan-level data, FY1992-2026); U.S. Small Business Administration, Office of Inspector General, Evaluation Report 13-17: The SBA's Portfolio Risk Management Program Can Be Strengthened; U.S. Bureau of Labor Statistics, Business Employment Dynamics, Table 7: Survival of private sector establishments by opening year (Total Private); Carmen Cotei and Joseph Farhat (Pepperdine University Digital Commons), Thinking about starting a franchise business? Think again, The Journal of Entrepreneurial Finance, Vol. 26, Iss. 1; International Franchise Association and FRANdata, 2026 Franchising Economic Outlook; U.S. Bureau of Labor Statistics, Business Employment Dynamics, Table 7: Survival of private sector establishments by opening year (Accommodation and Food Services). Download as image
What percentage of franchises fail?
There is no single official number, and anyone quoting one is choosing a measure. The figure you see depends on what counts as failure: a defaulted loan, a closed location, a unit sold at a loss, or a franchisee who walked away.
The cleanest yardstick is SBA 7(a) loan data, because every loan has an outcome. Of franchise loans approved FY1992-2026 that were either paid in full or charged off, 16.0% were charged off. For independent businesses it was 15.8%. ClauseAudit's own recount of the same SBA files, as of June 30, 2026, puts franchises at 15.9% across 97,084 resolved loans.
Earlier government work found worse numbers for a narrower slice. The GAO reported that SBA paid its guaranty on about 28% of the 32,323 franchise loans approved FY2003-FY2012, roughly $1.5 billion in payments. That cohort ran straight into the Great Recession, and the figure is before any recoveries.
Keep in mind that a charged-off loan is a failed loan, not always a closed shop. Some owners sell, some keep operating under new debt, and some close without ever borrowing from SBA.
Do franchises fail less often than independent businesses?
Not by any measure that tracks real outcomes. The SBA data shows franchise and non-franchise borrowers moving in lockstep. Loans approved FY2000-FY2009 were charged off at 24.2% for franchises and 23.7% for everyone else. For FY2010-FY2014 it was 7.5% versus 6.9%.
Academic work agrees. A study of startups founded in 2004 and tracked for eight years found survival rates for franchises matched those of independents. The difference showed up in how they ended: franchise startups were 2.77 times more likely to exit through a merger or acquisition.
So the system, the training and the brand recognition do not lower the average risk. What they may change is the shape of it. Higher upfront fees and ongoing royalties can mean a franchise needs more revenue to break even than a similar independent shop.
Why do some franchise brands fail so much more than others?
The averages hide huge gaps between brands. Among brands with 400 or more SBA loans approved FY2000-FY2014, Cold Stone Creamery loans were charged off at 34.3% and Quiznos at 28.6%. Subway, with 3,002 loans, came in at 6.2%.
The SBA's Inspector General flagged this years ago. It found three high-volume franchises with historical default rates of at least 46% on loans disbursed 2002-2009: Planet Beach at 61%, Petland at 60% and Cold Stone Creamery at 46%. Of nearly 1,000 loans to those three, 501 defaulted.
Brand results come from a mix of causes. Some concepts grow too fast. Some carry build-out costs that the unit revenue never pays back. Others push supply markups or fee increases onto owners who have no room to absorb them. You cannot see most of this in a sales brochure, but you can see traces of it in the FDD and the franchise agreement.
How do you check a franchise's failure rate before you buy?
Start with Item 20 of the Franchise Disclosure Document. The FTC Franchise Rule requires three years of outlet counts, plus separate columns for terminations, non-renewals, outlets the franchisor bought back and units that ceased operations for other reasons. Add those columns up for each year and compare them with the total number of open franchised units.
Then work the phone. Item 20 must list every franchisee who left the system in the last fiscal year, or who has not communicated with the franchisor within 10 weeks of the document's issuance date. Call several of them. Ask why they left, what they lost and whether they would buy again.
Watch for these warning signs:
- Transfers that run high year after year, which can mean owners are selling out quietly instead of closing
- A rising count of units reacquired by the franchisor, which can make closures look smaller than they are
- An Item 20 note that franchisees signed confidentiality clauses, meaning former owners may not be free to talk
- Net unit growth that comes only from new sales while existing units keep dropping out
- Item 19 earnings claims that leave out closed or underperforming locations
Why do published franchise failure rates disagree so much?
Because each source counts a different event. SBA data counts loans that went bad. BLS counts locations that stopped reporting employees. FDD Item 20 counts outlets that changed hands, closed or were terminated inside one brand. FRANdata counts units it judges successful after adjustments.
Time frames differ too. The GAO's 28% covers a recession-heavy group of loans and is measured before recoveries. Our own count of franchise charge-offs for that same FY2003-FY2012 group, as of June 30, 2026, is 22.38%. Both are honest numbers. They just answer different questions.
When a broker, a franchisor or a blog quotes a failure rate, ask three things: who was counted, over what years, and what counted as failure. If they cannot answer, the number is not worth much to you.
What the survival numbers mean if you are about to sign
BLS figures cover every new private establishment, franchised or not, and they set a sober baseline. Of businesses opened in the year to March 2024, 77.9% were still open a year later. Five-year survival for the class of 2020 was 51.4%. For accommodation and food services, where many franchises operate, that same cohort's five-year rate was 59.3%.
Industry groups publish friendlier numbers. FRANdata's historical unit success rate is expected at about 94.2% for 2025, but it counts some closed units as successes when the lender was likely repaid. Treat it as a marketing-grade measure, not a failure rate.
For you, the practical takeaway is simple. Plan for the chance that the location does not make it, and read the contract with that outcome in mind. Ask what happens if you close in year three: do you still owe royalties for the remaining term, does your personal guarantee cover the lease, and can you sell the unit to someone else without the franchisor blocking it? Those answers decide whether a bad outcome is a setback or a financial disaster.
How ClauseAudit helps
Failure rates tell you the odds. Your franchise agreement decides what a failure costs you. An automated review of the agreement flags the clauses that turn a closed unit into years of debt, so you can push back or walk away before you sign.
- Termination and default terms, including how short the cure periods are and what triggers them
- Liquidated damages or future royalties owed if the unit closes early
- Personal guarantees that make you liable for the franchise, the lease or the loan
- Transfer and resale rights, including franchisor approval and right of first refusal
- Post-term non-compete and non-solicit clauses that limit what you can do next
- Renewal conditions, remodel requirements and fee increases during the term
Frequently asked questions
Is it true that almost all franchises succeed?
That kind of claim usually comes from industry success measures, not failure data. FRANdata's historical unit success rate is expected at about 94.2% for 2025, but it adjusts for factors outside the franchisee's control and counts closed units as successes when the lender was likely repaid. SBA loan records, which track every loan to an outcome, show franchise charge-off rates close to those of independent businesses.
Are franchises safer than starting your own business?
On average, no. Across resolved SBA 7(a) loans approved FY1992-2026, 16.0% of franchise loans were charged off versus 15.8% for independents. A study of startups founded in 2004 found franchise survival matched independents over eight years. A strong brand can lower your risk, but buying a franchise does not lower it on its own.
Which franchises have the highest failure rates?
SBA loan data points to big gaps between brands. Among brands with 400 or more loans approved FY2000-FY2014, Matco Tools had a 35.5% charge-off rate, Cold Stone Creamery 34.3% and Quiznos 28.6%. The SBA Inspector General found Planet Beach and Petland loans defaulted at 61% and 60% for loans disbursed 2002-2009. These are historical outcomes, not forecasts for today's offerings.
How many new businesses close in the first year?
BLS data shows 77.9% of private establishments opened in the year to March 2024 were still open a year later. That figure covers franchised and independent businesses together, because BLS does not separate them. The first year is the steepest drop: in the 2015 class, the share still operating fell to 79.6% after one year.
What does FDD Item 20 tell me about failures?
Item 20 gives three years of outlet counts and breaks out terminations, non-renewals, units reacquired by the franchisor and units that ceased operations for other reasons. It also lists former franchisees from the last fiscal year with contact details. Together they let you estimate turnover and talk to people who left.
Why do former franchisees sometimes refuse to talk?
Some franchise systems have owners sign confidentiality clauses when they leave or settle a dispute. If franchisees signed such clauses in the last three fiscal years, the FTC rule requires Item 20 to say so, with a warning that some former owners may not be able to speak. If you see that disclosure, ask the franchisor why it was needed.
Does the year I buy in affect my risk?
A lot. Franchise SBA loans approved in FY2007 were charged off at 37.4%, compared with 6.7% for FY2013 loans. Owners who opened just before the Great Recession faced falling sales while still paying build-out debt. You cannot time the economy, but you can keep extra cash and avoid agreements that leave no way out in a downturn.
If my franchise closes, do I still owe money?
Often, yes. Many franchise agreements let the franchisor collect liquidated damages or a share of future royalties after an early closure. A personal guarantee can also leave you liable for the lease and any SBA loan balance. Read the termination, damages and guarantee sections closely before you sign, and get them reviewed.
Use this data
Every chart and card below is free to reuse under CC BY 4.0. Download what you need and link back to this page.
 Stat cards
 Key findings card
 Infographic
 Share of SBA 7(a) franchise loans charged off, by approval year (FY2000-FY2014) (% of disbursed loans)
 SBA 7(a) charge-off rate, franchise vs non-franchise borrowers, by approval period (% of disbursed loans)
 Share of US private establishments opened in the year to March 2015 still operating, 2015-2025 (% surviving since birth)
 Five-year survival rate of new US private establishments, by opening year (% still operating after 5 years)
 FRANdata historical unit success rate for US franchise units, 2021-2025 (%)
 SBA 7(a) charge-off rate by franchise brand, brands with 400+ disbursed loans (FY2000-FY2014 approvals) (% of disbursed loans)
 What FDD Item 20 counts: the closure and turnover categories defined by the FTC Franchise Rule
 SBA 7(a) loans charged off by approval year, franchise vs non-franchise borrowers (FY2000-FY2014, data as of June 30, 2026)
 SBA 7(a) loan outcomes for franchise brands with 400 or more disbursed loans, FY2000-FY2014 approvals (data as of June 30, 2026)
 Why published franchise failure rates disagree: each source measures something different
Embed the infographic
Free to share on your site, blog or slides under CC BY 4.0. Please keep the credit link.
Sources and method
Every number on this page comes from the sources below, each opened and read on or before October 18, 2026. A second, independent review checked every figure against its source and corrected anything that did not match. Figures that could not be confirmed were left out.
- U.S. Government Accountability Office, Small Business Administration: Review of 7(a) Guaranteed Loans to Select Franchisees (GAO-13-759) (Published September 10, 2013; publicly released November 13, 2013)
- U.S. Small Business Administration, Office of Inspector General, Evaluation Report 13-17: The SBA's Portfolio Risk Management Program Can Be Strengthened (July 2, 2013)
- U.S. Small Business Administration (data.sba.gov), 7(a) & 504 FOIA loan-level data: 7(a) files FY1991-FY1999, FY2000-FY2009, FY2010-FY2019 and FY2020-Present (Data as of June 30, 2026 (files posted July 21, 2026))
- Finance Clearly, SBA 7(a) Charge-Off Rates by Franchise Brand, Industry and State (computed from SBA 7(a) loan-level data, FY1992-2026) (August 24, 2026 (initial publication))
- U.S. Bureau of Labor Statistics, Business Employment Dynamics, Table 7: Survival of private sector establishments by opening year (Total Private) (Latest edition, data through March 2025)
- U.S. Bureau of Labor Statistics, Business Employment Dynamics, Table 7: Survival of private sector establishments by opening year (Accommodation and Food Services) (Latest edition, data through March 2025)
- International Franchise Association and FRANdata, 2026 Franchising Economic Outlook (2026 edition (February 2026))
- Carmen Cotei and Joseph Farhat (Pepperdine University Digital Commons), Thinking about starting a franchise business? Think again, The Journal of Entrepreneurial Finance, Vol. 26, Iss. 1 (2024)
- Electronic Code of Federal Regulations (National Archives and GPO), 16 CFR 436.5 Disclosure items, paragraph (t) Item 20: Outlets and Franchisee Information (FTC Franchise Rule) (eCFR text as of October 15, 2026)
Cite this page
ClauseAudit, “Franchise Failure Rate: What SBA Loan Data, FDD Item 20 and BLS Survival Data Actually Show”, updated October 18, 2026, https://clauseaudit.com/data/franchise-failure-rate. Free to reuse with a link back (CC BY 4.0).
This page summarises published data and law as checked on October 18, 2026. Figures are updated as new editions are released, and your own situation may differ. It is general information, not legal, tax or financial advice.