How Much Do Franchise Owners Make? Income Data From Item 19 and Owner Surveys
By ClauseAudit Research · 4 sources ·
How much do franchise owners make?
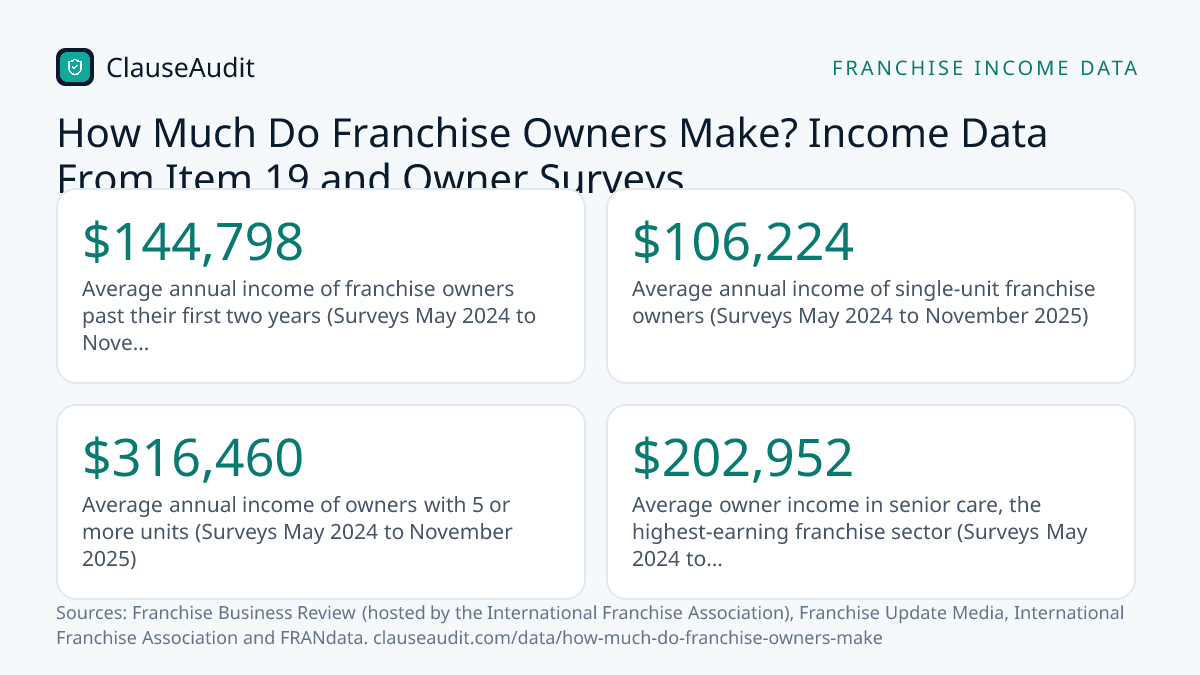
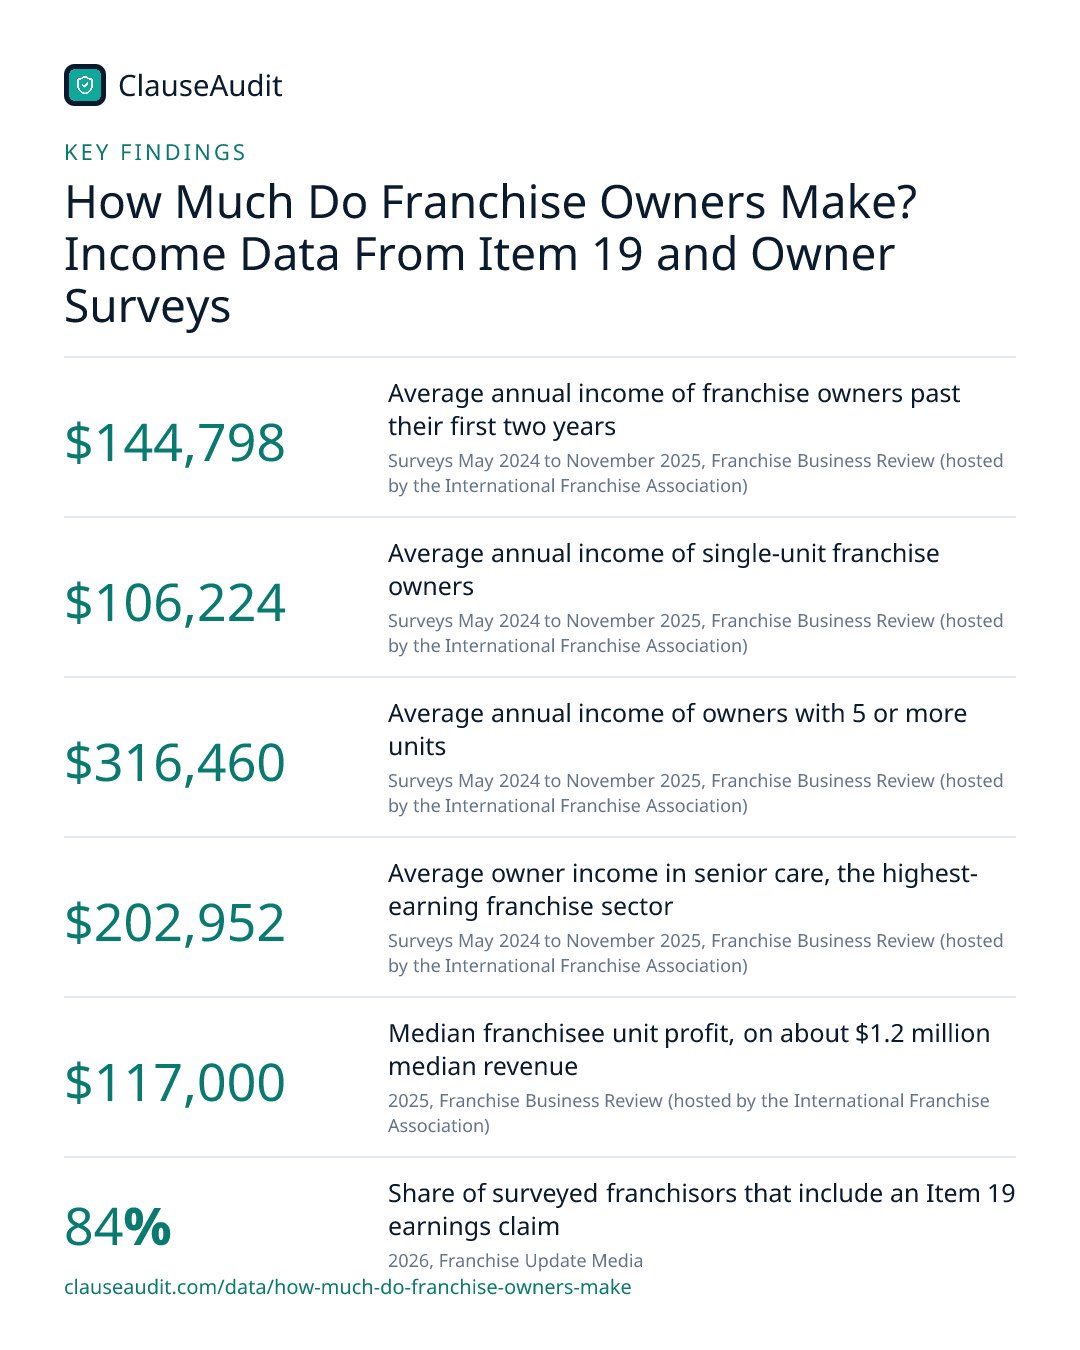
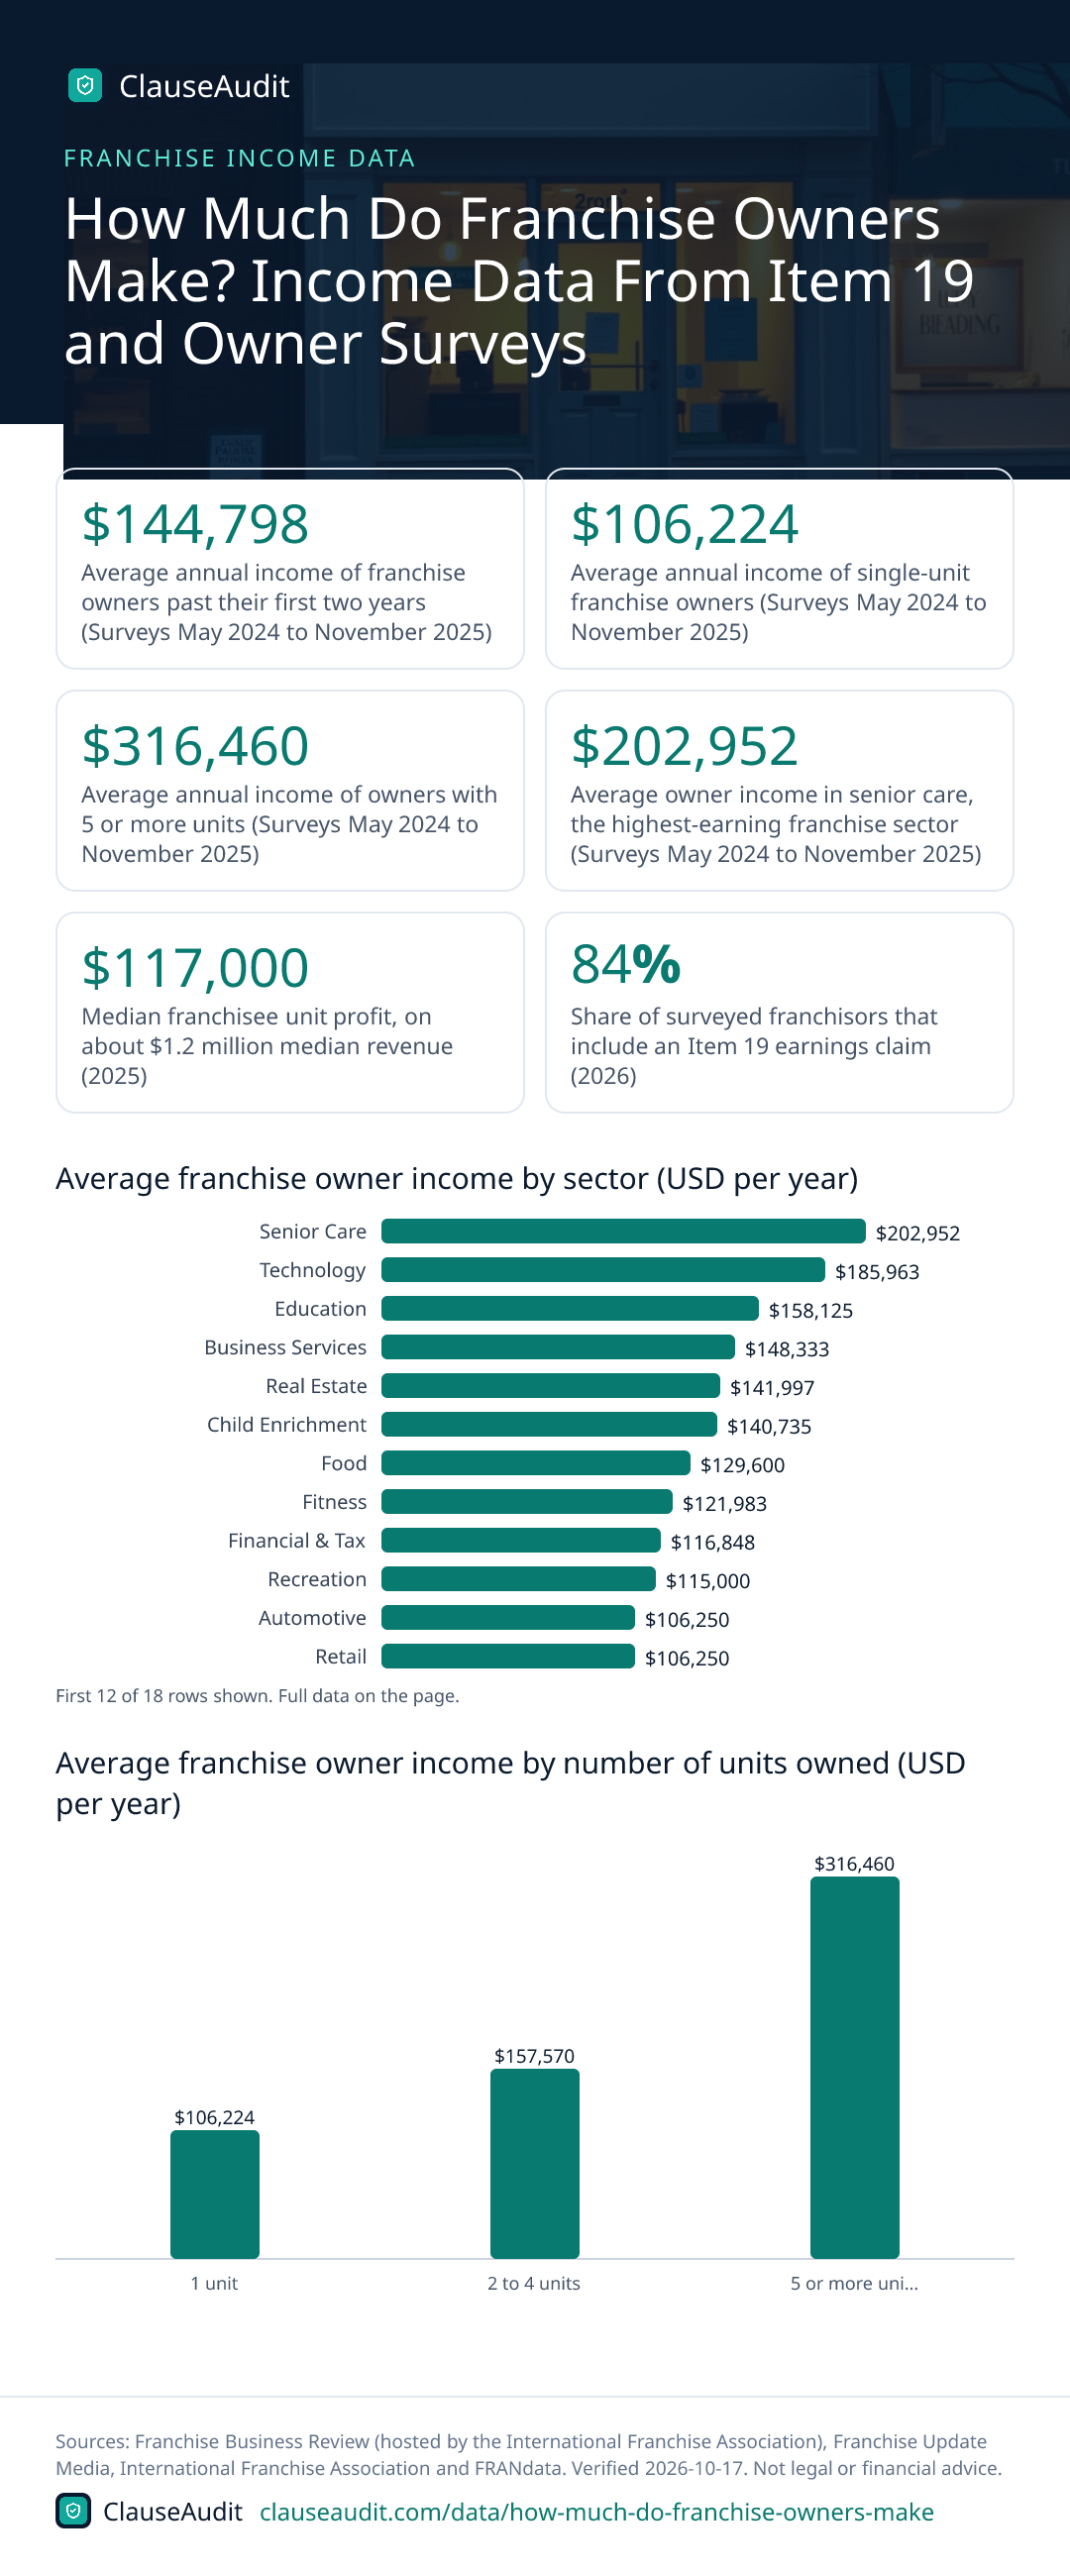
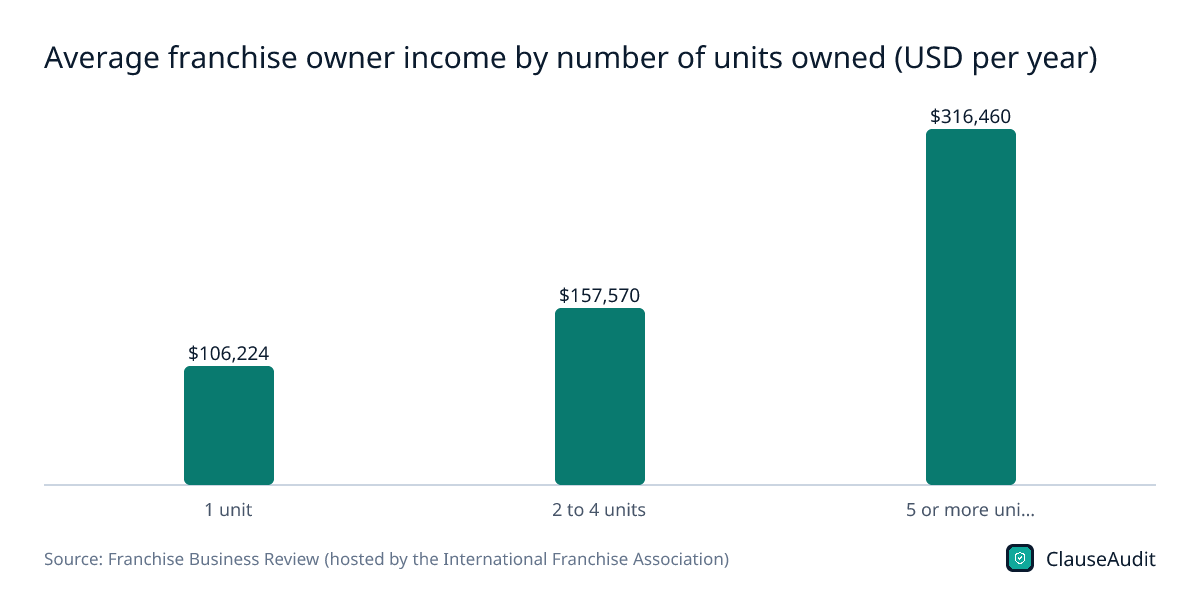
Franchise owners past their first two years report average income of $144,798 a year, based on Franchise Business Review surveys run from May 2024 to November 2025. Single-unit owners averaged $106,224 and owners of 5 or more units averaged $316,460. Sector matters a lot, from $88,265 in personal services to $202,952 in senior care.

- Average annual income of franchise owners past their first two years (Surveys May 2024 to November 2025, Franchise Business Review (hosted by the International Franchise Association))
- $144,798
- Average annual income of single-unit franchise owners (Surveys May 2024 to November 2025, Franchise Business Review (hosted by the International Franchise Association))
- $106,224
- Average annual income of owners with 5 or more units (Surveys May 2024 to November 2025, Franchise Business Review (hosted by the International Franchise Association))
- $316,460
- Average owner income in senior care, the highest-earning franchise sector (Surveys May 2024 to November 2025, Franchise Business Review (hosted by the International Franchise Association))
- $202,952
- Median franchisee unit profit, on about $1.2 million median revenue (2025, Franchise Business Review (hosted by the International Franchise Association))
- $117,000
- Share of surveyed franchisors that include an Item 19 earnings claim (2026, Franchise Update Media)
- 84%
- U.S. franchise establishments (2025 (estimate), International Franchise Association and FRANdata)
- 832,521
The honest answer is that most franchise owners earn a solid living, not a fortune, and the spread between brands is huge. Owners who made it past the startup years told Franchise Business Review they average $144,798 a year. Owners of a single location averaged $106,224. The big numbers belong to people who run five or more units.
These are averages from owner surveys, so a few high earners can pull them up. The figure that matters for you is the one in the specific brand's Franchise Disclosure Document, read against the fees and terms in the franchise agreement. This page shows what the survey data says, what Item 19 can and can't tell you, and how to turn both into a realistic estimate.
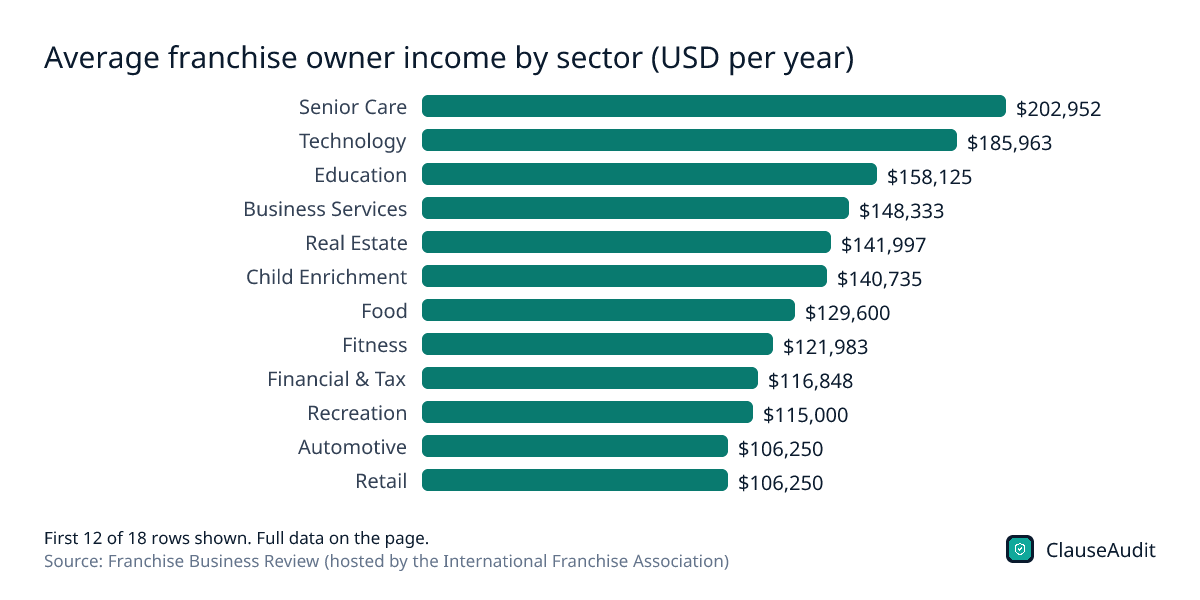
Average franchise owner income by sector (USD per year)
Chart data
| Label | Value |
|---|---|
| Senior Care | $202,952 |
| Technology | $185,963 |
| Education | $158,125 |
| Business Services | $148,333 |
| Real Estate | $141,997 |
| Child Enrichment | $140,735 |
| Food | $129,600 |
| Fitness | $121,983 |
| Financial & Tax | $116,848 |
| Recreation | $115,000 |
| Automotive | $106,250 |
| Retail | $106,250 |
| Travel | $101,066 |
| Pet Services | $93,750 |
| Cleaning & Maintenance | $93,221 |
| Home Services | $89,638 |
| Services | $89,042 |
| Personal Services | $88,265 |
Senior care tops the list at $202,952 while personal services sits at $88,265, so your choice of sector can more than double your expected income. Treat each bar as a starting point, then check the brand's own Item 19.
Download this chart (PNG)Average franchise owner income by number of units owned (USD per year)
Chart data
| Label | Value (USD per year) |
|---|---|
| 1 unit | $106,224 |
| 2 to 4 units | $157,570 |
| 5 or more units | $316,460 |
Income jumps sharply with scale: $106,224 for one unit versus $316,460 for five or more. Remember that more units also mean more debt, more leases and more people to manage.
Download this chart (PNG)Total U.S. franchise output, 2022 to 2026 (USD billions)
Chart data
| Label | Value (USD billions) |
|---|---|
| 2022 | $839.8B |
| 2023 | $877.4B |
| 2024 | $897.1B |
| 2025 (est.) | $907.3B |
| 2026 (proj.) | $921.4B |
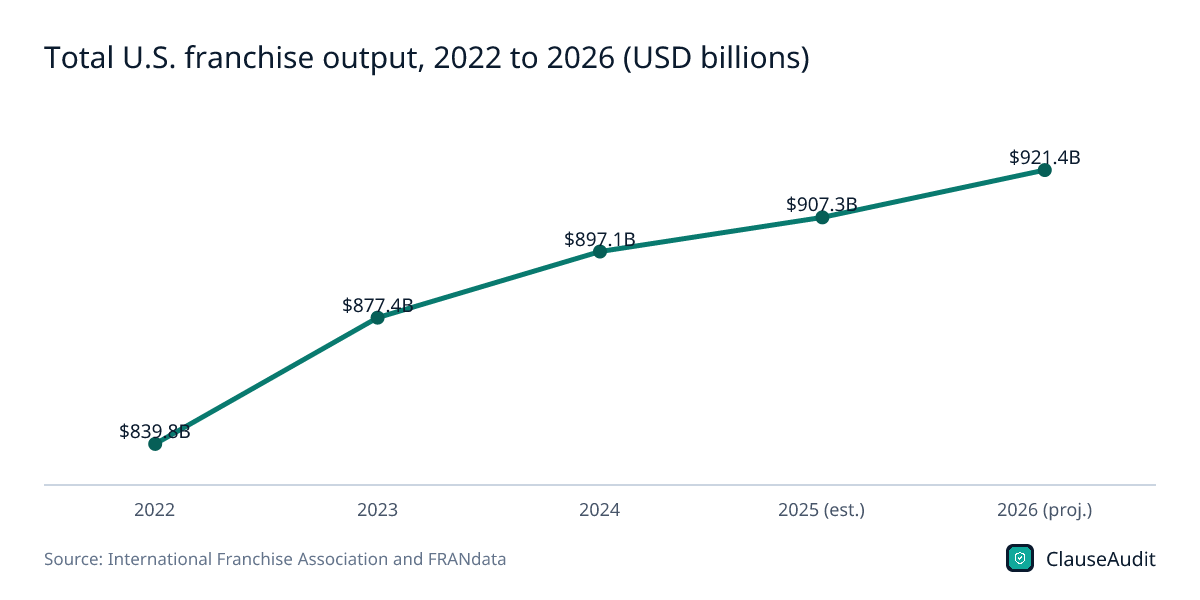
Total franchise sales kept growing, from $839.8B in 2022 to an estimated $907.3B in 2025. That is system revenue, not what owners take home.
Download this chart (PNG)U.S. franchise output by business line, 2025 estimate (USD billions)
Chart data
| Label | Value |
|---|---|
| Quick Service Restaurants | $317.1B |
| Commercial & Residential Services | $138.8B |
| Lodging | $95.0B |
| Business Services | $78.6B |
| Retail | $70.3B |
| Health & Wellness | $65.0B |
| Full-Service Restaurants | $46.7B |
| Automotive | $41.1B |
| Child Services | $22.0B |
| Personal Services | $21.0B |
| Real Estate | $11.7B |
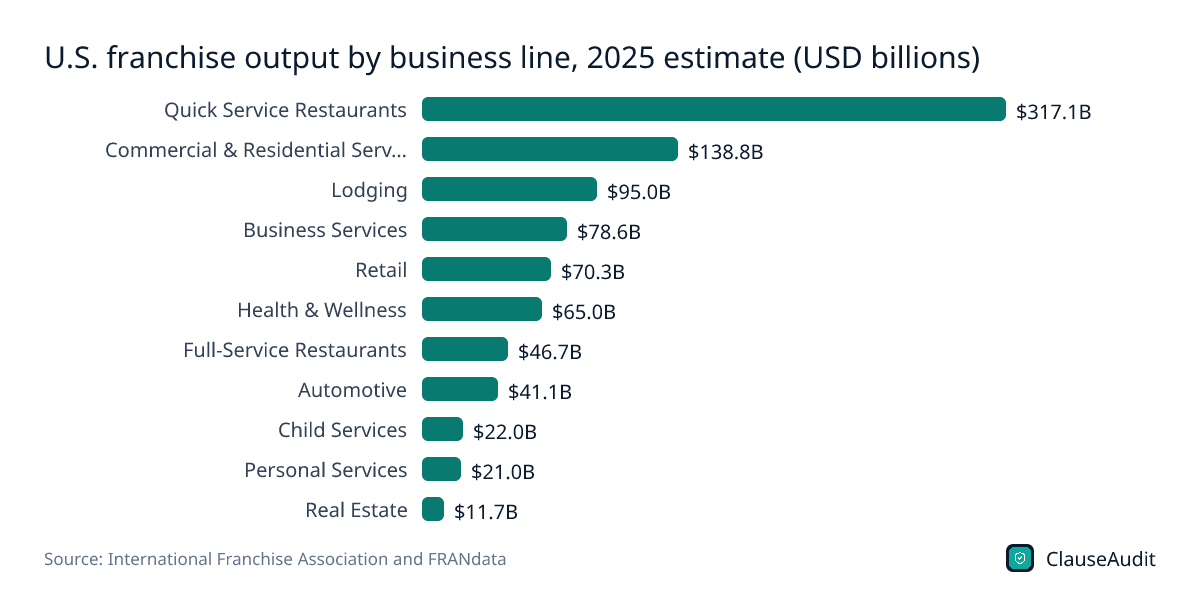
Quick service restaurants brought in the most sales by far, an estimated $317.1B in 2025. High sales in a sector do not mean high owner income, as the sector income chart shows.
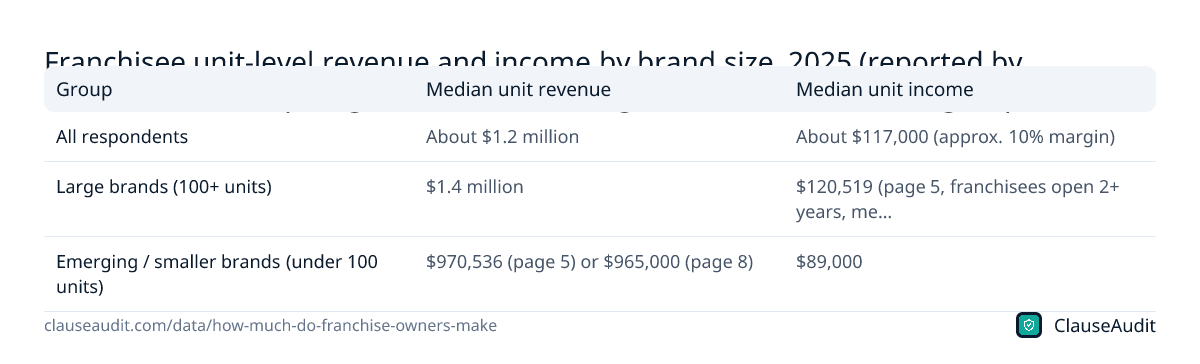
Download this chart (PNG)Franchisee unit-level revenue and income by brand size, 2025 (reported by franchisors; the report gives two different figures for the brand-size groups)
| Group | Median unit revenue | Median unit income |
|---|---|---|
| All respondents | About $1.2 million | About $117,000 (approx. 10% margin) |
| Large brands (100+ units) | $1.4 million | $120,519 (page 5, franchisees open 2+ years, median) or $131,000 (page 8) |
| Emerging / smaller brands (under 100 units) | $970,536 (page 5) or $965,000 (page 8) | $89,000 |
Source: Franchise Business Review (hosted by the International Franchise Association), Franchising Outlook 2026: FBR Industry Report. Download as image
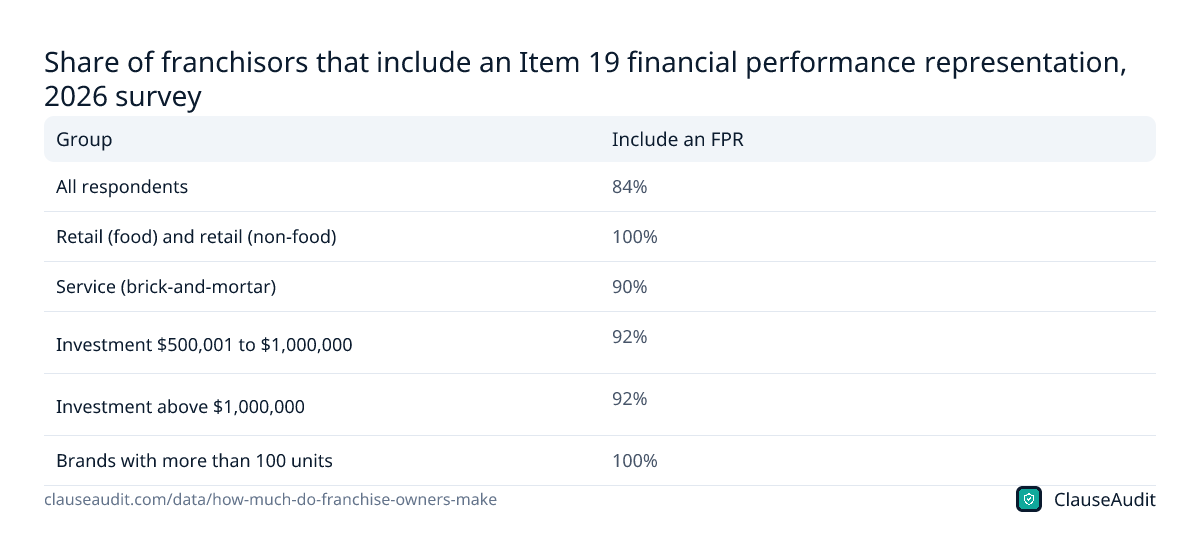
Share of franchisors that include an Item 19 financial performance representation, 2026 survey
| Group | Include an FPR |
|---|---|
| All respondents | 84% |
| Retail (food) and retail (non-food) | 100% |
| Service (brick-and-mortar) | 90% |
| Investment $500,001 to $1,000,000 | 92% |
| Investment above $1,000,000 | 92% |
| Brands with more than 100 units | 100% |
Source: Franchise Update Media, Looking at what is in a franchise's FDD (2026 Annual Franchise Development Report findings). Download as image
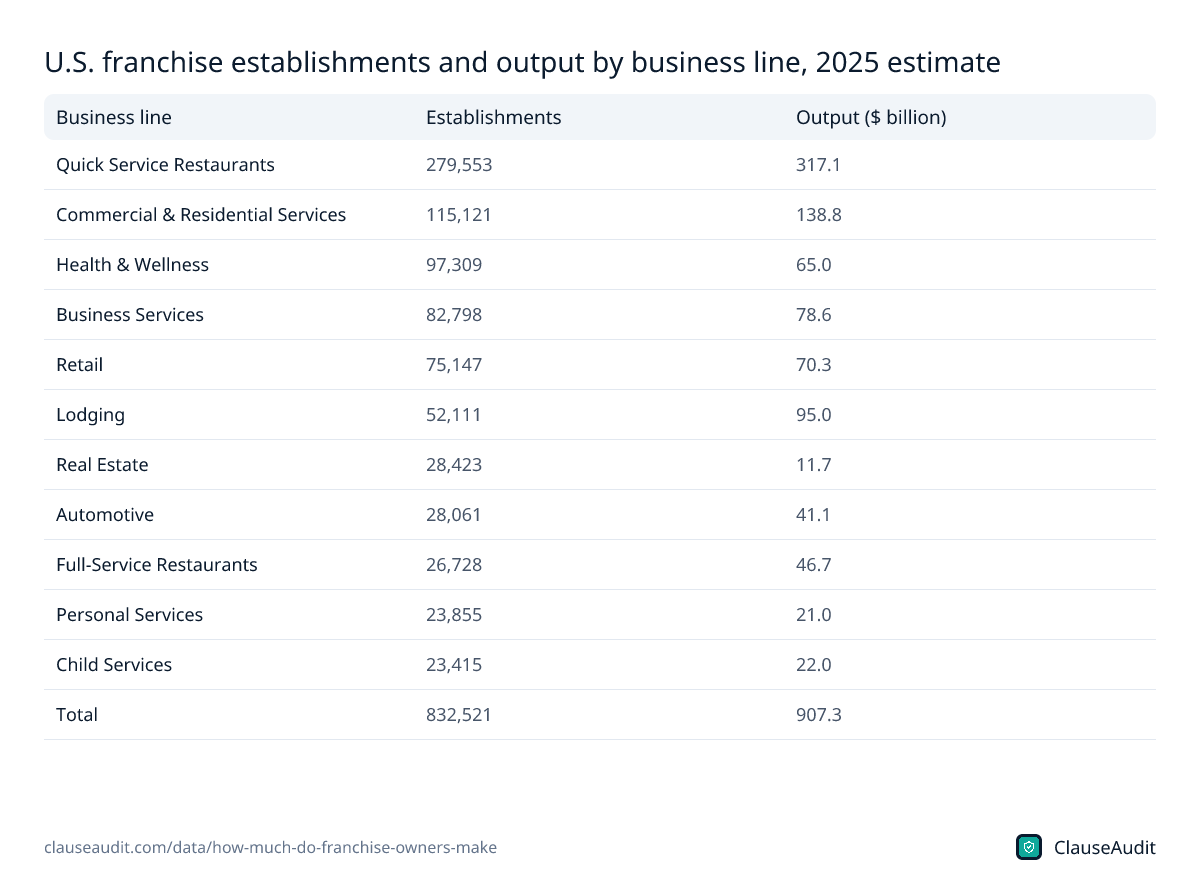
U.S. franchise establishments and output by business line, 2025 estimate
| Business line | Establishments | Output ($ billion) |
|---|---|---|
| Quick Service Restaurants | 279,553 | 317.1 |
| Commercial & Residential Services | 115,121 | 138.8 |
| Health & Wellness | 97,309 | 65.0 |
| Business Services | 82,798 | 78.6 |
| Retail | 75,147 | 70.3 |
| Lodging | 52,111 | 95.0 |
| Real Estate | 28,423 | 11.7 |
| Automotive | 28,061 | 41.1 |
| Full-Service Restaurants | 26,728 | 46.7 |
| Personal Services | 23,855 | 21.0 |
| Child Services | 23,415 | 22.0 |
| Total | 832,521 | 907.3 |
Source: International Franchise Association and FRANdata, 2026 Franchising Economic Outlook. Download as image
How much do franchise owners make a year?
Across more than 26,000 franchisees in 330 brands, owners past their first two years reported average income of $144,798. Franchise Business Review treats the first two years as a startup period and leaves them out. Those are the years when owners are usually still paying off buildout costs and building a customer base. If you are planning your first year, plan for less.
The figures are what owners report as their own income, and owners don't all count it the same way. Some include only salary, others add profit they take out of the business. A restaurant owner who works the counter six days a week and an owner who hires a general manager land in the same average, even though their hourly pay is nothing alike.
So use $144,798 as a reality check, not a promise. If a salesperson tells you owners in their system clear far more than that in year one, ask to see it in writing in Item 19.
Do multi-unit franchise owners really make more?
Yes, by a wide margin. Single-unit owners averaged $106,224. Owners with 2 to 4 units averaged $157,570, and owners of 5 or more averaged $316,460.
The catch is that each extra unit means another lease, another loan and another set of fees. Multi-unit deals often come with a development schedule, where you commit to opening a set number of locations by fixed dates. Miss a date and you can lose your territory rights or pay a penalty. Before you sign one, model what happens if the second store opens a year late.
What does Item 19 tell you about franchise owner income?
Item 19 is the section of the Franchise Disclosure Document where a franchisor can share financial performance numbers. Under the FTC Franchise Rule it is optional. Even so, 84% of franchisors surveyed in 2026 included one, and every surveyed brand with more than 100 units did.
The weak spot is what they choose to show. Revenue is the most common metric, and very few brands publish a full profit and loss statement. Gross sales tell you almost nothing about what lands in your pocket after rent, payroll, royalties and marketing fees.
Franchisor executives reported a median unit revenue of about $1.2 million and median unit profit of about $117,000, a margin of roughly 10%. A 10% margin means a small change in costs can wipe out a large share of profit.
- Check whether the Item 19 numbers cover all units or only the top performers.
- Look for the number of units that hit or beat the average. If it is a small share, the average is misleading.
- See whether company-owned stores are mixed in with franchised ones.
- Note what costs are left out, especially royalties, ad fund fees and your own salary.
Which franchises make the most money for owners?
By sector, senior care led owner income at $202,952, followed by technology at $185,963 and education at $158,125. At the bottom were home services at $89,638, the broad services category at $89,042 and personal services at $88,265.
Notice that food, the sector most people picture, came in at $129,600. Quick service restaurants generate the most total sales of any franchise line, but high sales come with high food, labor and rent costs. That helps explain why senior care, technology and education owners all reported higher average income than food owners.
Sector averages hide a lot. Two senior care brands can have very different royalty rates, territory sizes and startup costs. Compare brands inside a sector, not just sectors against each other.
Why does franchise owner income vary so much?
Picture two owners in the same brand. One bought into a busy suburban corridor with a cheap lease signed years ago. The other opened in a newer area with high rent and a five-year ramp to steady traffic. Same logo, same royalty rate, very different paychecks.
Brand size plays a part too. Bigger systems tend to have tested operations, better supplier pricing and stronger name recognition. Smaller brands can cost less to join and may give you a bigger territory, but you carry more of the risk that the concept never catches on.
Then there is how hard you work the business. An owner-operator saves a manager's salary and often keeps more profit. An absentee owner pays for that freedom. Neither is wrong, but you should know which one the brand's numbers assume.
The contract shapes income as well. Royalties charged on gross sales come off the top even in a month when you lose money. A clause that lets the franchisor add new technology fees or raise the ad fund rate can trim your margin year after year. When margins sit near 10%, a few extra points of fees can be the difference between a good living and a stressful one.
How to estimate your own franchise income
Start with the brand's Item 19 revenue figure, then build your own expense list from the rest of the FDD. Item 6 lists ongoing charges like royalties and marketing contributions, and the Item 7 table shows your estimated startup costs. Your loan payment comes from your lender, and rent comes from the lease you will actually sign.
Then call current and former franchisees. Item 20 of the FDD lists current franchisees and those who left in the last fiscal year, with contact details. Ask what they paid themselves in year one, year two and year three, and how long it took to break even. Five honest calls are worth more than any survey average.
Finally, test the bad case. Cut revenue by a fifth and see if you can still cover your loan and living costs. If the answer is no, the brand may still be fine, but the deal is too tight for you.
How ClauseAudit helps
Owner income is what is left after the franchise agreement takes its share. Royalties, ad fund fees, technology fees and renewal costs all come off the top, and the agreement decides how much they can rise.
Upload your FDD or franchise agreement and the automated review flags the terms that most often shrink take-home income, with plain-English notes you can bring to a franchise lawyer.
- Royalty and marketing fee rates, and whether they are charged on gross sales
- Rights to add new fees or raise existing ones during the term
- Development schedule deadlines and penalties for missing them
- Territory protection and whether the franchisor can open nearby
- Renewal terms, transfer fees and conditions to sell your unit
- Post-term non-compete and personal guarantee scope
Frequently asked questions
What is the average franchise owner salary?
Franchise owners past their first two years reported average annual income of $144,798 in Franchise Business Review surveys from May 2024 to November 2025. Single-unit owners averaged $106,224. These are averages, not medians, and they are self-reported, so treat them as a rough benchmark rather than a salary you can count on.
How much do franchise owners make in their first year?
The main survey leaves out the first two years because they are treated as a startup period. Most owners earn less then, since they are still paying off buildout and building sales. Ask current franchisees listed in the FDD what they took home in year one, and plan your living costs around that answer.
What percentage of revenue do franchise owners keep?
Franchisor executives reported a median unit profit of about $117,000 on about $1.2 million in median revenue, a margin of roughly 10%. Your margin depends on rent, labor, royalties and marketing fees, so build your own estimate from the FDD instead of assuming the median applies to you.
Are franchisors required to tell you how much owners make?
No. Item 19 earnings claims are optional under the FTC Franchise Rule. Still, 84% of franchisors surveyed in 2026 included one, and all surveyed brands with more than 100 units did. If a brand gives no Item 19, its salespeople should not be making earnings claims to you either.
Which franchise sector pays owners the most?
Senior care led at $202,952 in average owner income, followed by technology at $185,963 and education at $158,125. Personal services was lowest of 18 sectors at $88,265. Brands within each sector vary widely, so compare fees and Item 19 data brand by brand.
Is it better to own one franchise or several?
Owners of 5 or more units averaged $316,460, compared with $106,224 for single-unit owners. More units also mean more debt, leases and management work. If the agreement includes a development schedule, check the penalties for missing opening dates before you commit to growth.
Is Item 19 revenue the same as owner income?
No. Revenue is the most common Item 19 metric, and very few franchisors show a full profit and loss. To get from revenue to income, subtract rent, payroll, cost of goods, royalties, ad fund fees, insurance and loan payments. The fee and initial investment sections of the FDD help you fill in those costs.
How big is the franchise industry in the US?
There were an estimated 832,521 franchise establishments in 2025, with output estimated at $907.3 billion. That output is total sales across all locations, not what owners earn. It shows the market is large and growing, but says little about how any single unit performs.
Use this data
Every chart and card below is free to reuse under CC BY 4.0. Download what you need and link back to this page.
 Stat cards
 Key findings card
 Infographic
 Average franchise owner income by sector (USD per year)
 Average franchise owner income by number of units owned (USD per year)
 Total U.S. franchise output, 2022 to 2026 (USD billions)
 U.S. franchise output by business line, 2025 estimate (USD billions)
 Franchisee unit-level revenue and income by brand size, 2025 (reported by franchisors; the report gives two different figures for the brand-size groups)
 Share of franchisors that include an Item 19 financial performance representation, 2026 survey
 U.S. franchise establishments and output by business line, 2025 estimate
Embed the infographic
Free to share on your site, blog or slides under CC BY 4.0. Please keep the credit link.
Sources and method
Every number on this page comes from the sources below, each opened and read on or before October 17, 2026. A second, independent review checked every figure against its source and corrected anything that did not match. Figures that could not be confirmed were left out.
- Franchise Business Review (hosted by the International Franchise Association), Franchising Outlook 2026: FBR Industry Report (2026 edition (PDF dated April 2026); owner data from surveys May 2024 to November 2025; executive survey late 2025)
- Franchise Update Media, Looking at what is in a franchise's FDD (2026 Annual Franchise Development Report findings) (July 14, 2026)
- International Franchise Association and FRANdata, 2026 Franchising Economic Outlook (February 2026)
- Federal Trade Commission (Code of Federal Regulations, via Cornell LII), 16 CFR 436.5(s), Item 19: Financial performance representations (Current text as of October 2026)
Cite this page
ClauseAudit, “How Much Do Franchise Owners Make? Income Data From Item 19 and Owner Surveys”, updated October 17, 2026, https://clauseaudit.com/data/how-much-do-franchise-owners-make. Free to reuse with a link back (CC BY 4.0).
This page summarises published data and law as checked on October 17, 2026. Figures are updated as new editions are released, and your own situation may differ. It is general information, not legal, tax or financial advice.