FDD Item 19 Statistics: How Many Franchisors Disclose Earnings, and What They Include
By ClauseAudit Research · 3 sources ·
What is FDD Item 19 and how often is it included?
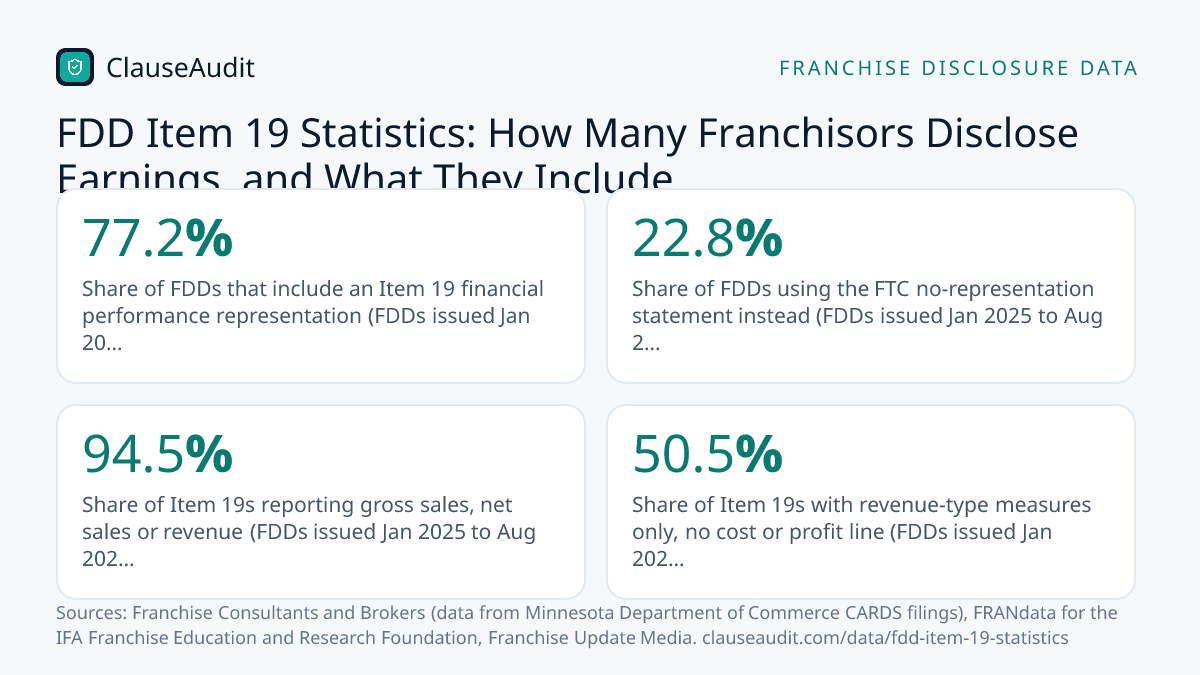
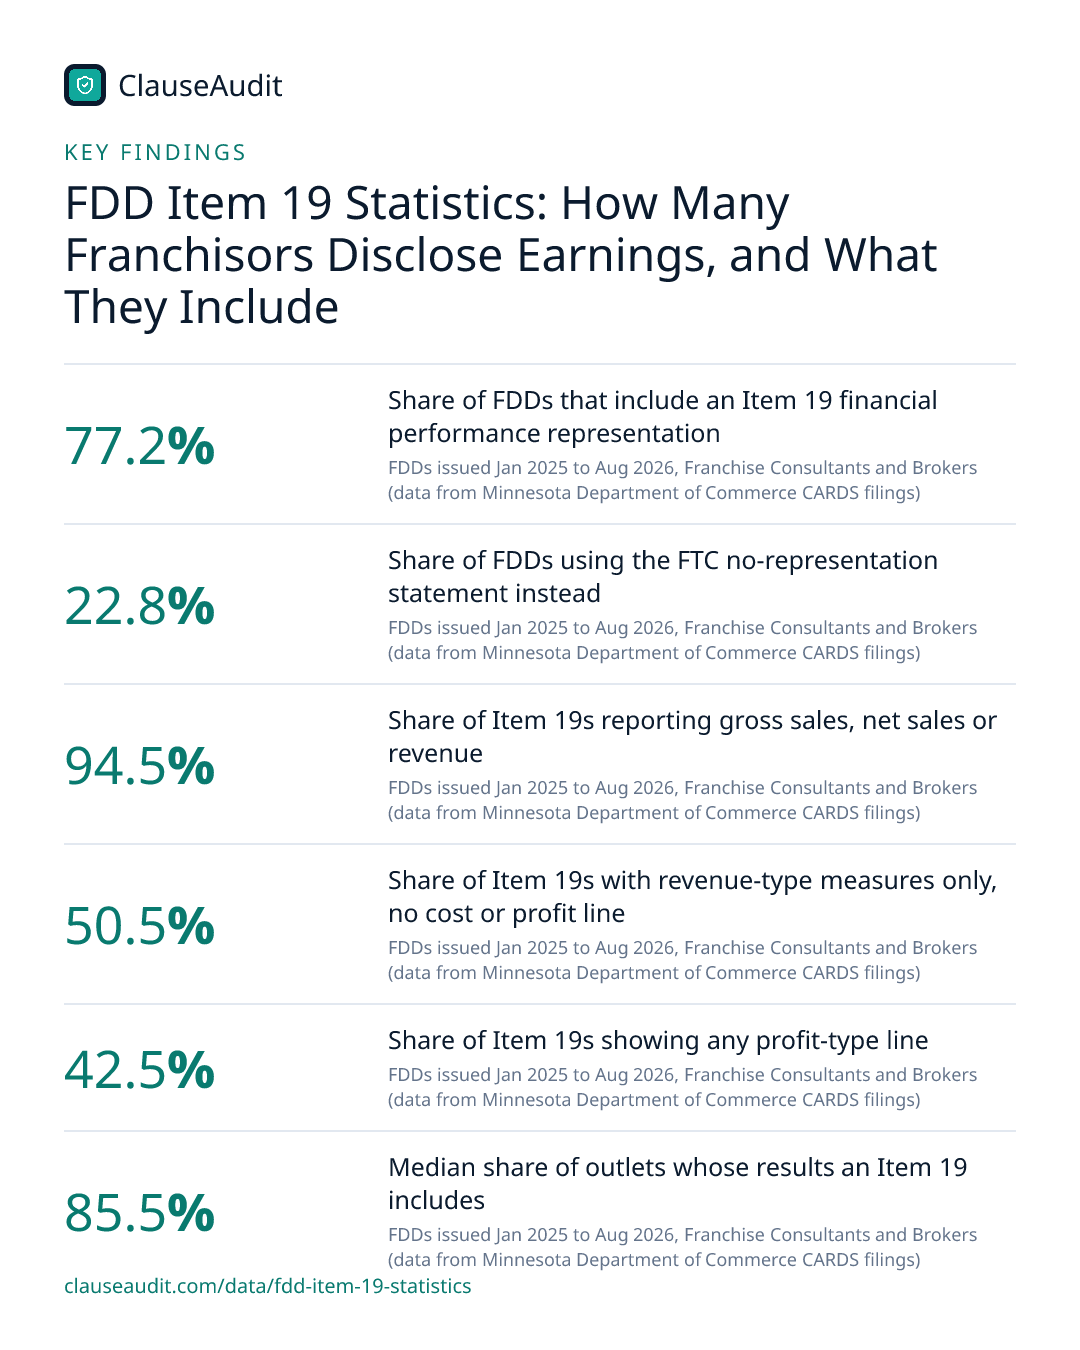
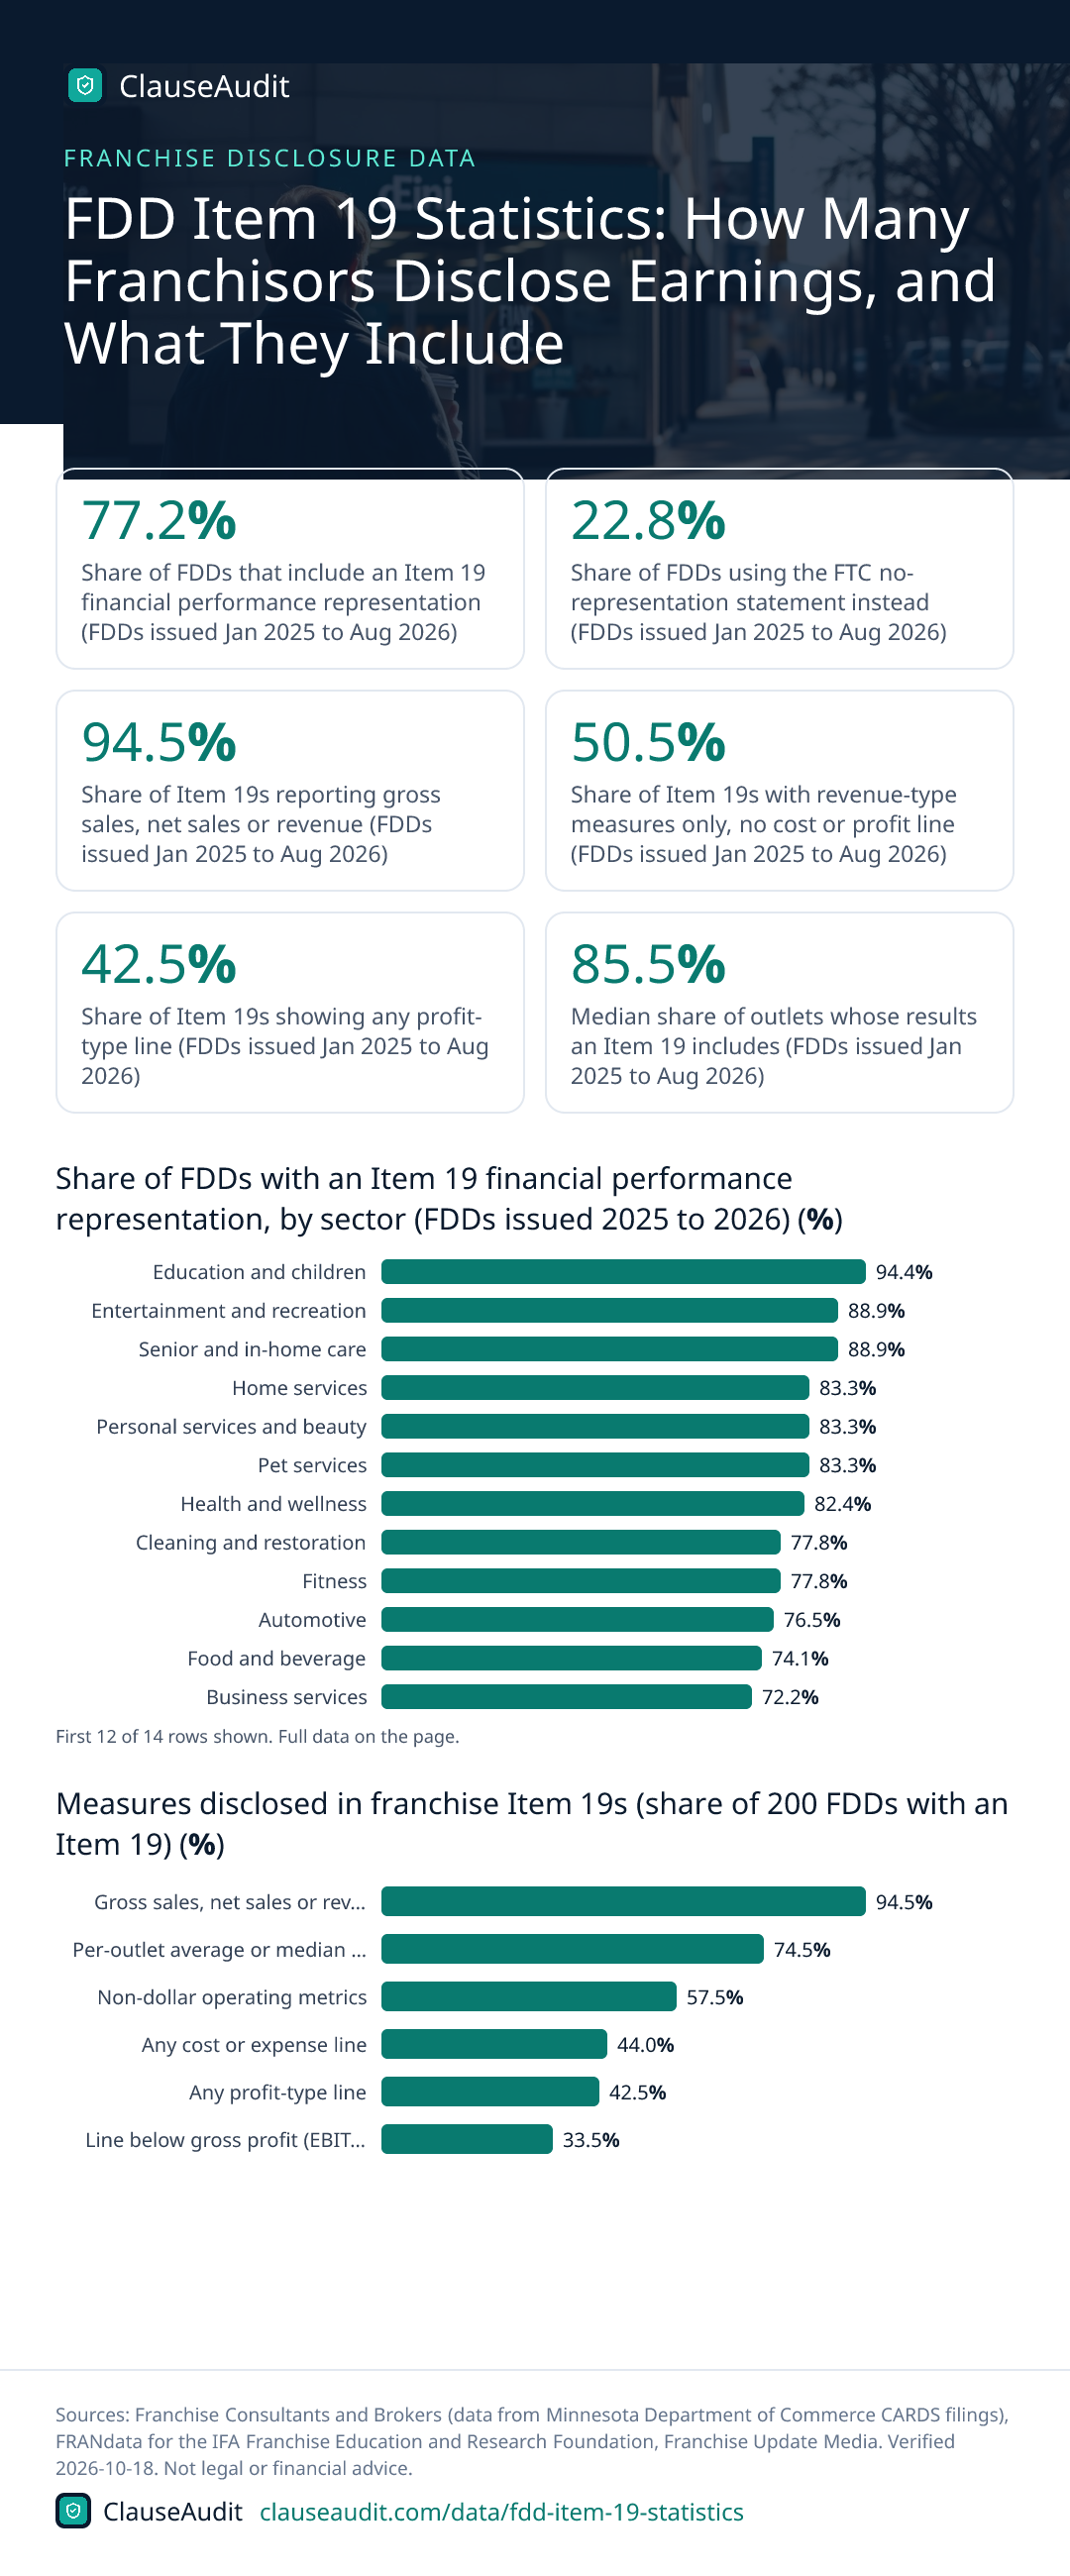
Most FDDs now include an Item 19. In a hand reading of FDDs issued from January 2025 to August 2026, 77.2% gave a financial performance representation. But 50.5% of those Item 19s showed revenue-type figures only, with no cost or profit line, so a sales number rarely tells you what an owner keeps.

- Share of FDDs that include an Item 19 financial performance representation (FDDs issued Jan 2025 to Aug 2026, Franchise Consultants and Brokers (data from Minnesota Department of Commerce CARDS filings))
- 77.2%
- Share of FDDs using the FTC no-representation statement instead (FDDs issued Jan 2025 to Aug 2026, Franchise Consultants and Brokers (data from Minnesota Department of Commerce CARDS filings))
- 22.8%
- Share of Item 19s reporting gross sales, net sales or revenue (FDDs issued Jan 2025 to Aug 2026, Franchise Consultants and Brokers (data from Minnesota Department of Commerce CARDS filings))
- 94.5%
- Share of Item 19s with revenue-type measures only, no cost or profit line (FDDs issued Jan 2025 to Aug 2026, Franchise Consultants and Brokers (data from Minnesota Department of Commerce CARDS filings))
- 50.5%
- Share of Item 19s showing any profit-type line (FDDs issued Jan 2025 to Aug 2026, Franchise Consultants and Brokers (data from Minnesota Department of Commerce CARDS filings))
- 42.5%
- Median share of outlets whose results an Item 19 includes (FDDs issued Jan 2025 to Aug 2026, Franchise Consultants and Brokers (data from Minnesota Department of Commerce CARDS filings))
- 85.5%
- Share of 3,000+ franchise brands providing FPRs in FDDs, 2014 to 2016 (FDDs 2014 to 2016 (published April 2017), FRANdata for the IFA Franchise Education and Research Foundation)
- Two-thirds
- Share of surveyed franchisors saying they provide an FPR in their FDD (2026 survey (published July 14, 2026), Franchise Update Media)
- 84%
Item 19 is the one place in a Franchise Disclosure Document where a franchisor may tell you what its outlets earn. It is optional. A brand can fill it with sales, costs and profit, or it can print the FTC's standard statement saying it makes no financial performance representation at all.
A study of 259 FDDs registered in Minnesota and issued from January 2025 to August 2026 found 200 of them, or 77.2%, included an Item 19. That sounds like good news for buyers, and partly it is. The catch is in what those Item 19s contain and which outlets they leave out. This page walks through both, with a checklist you can use on any FDD you are reading.
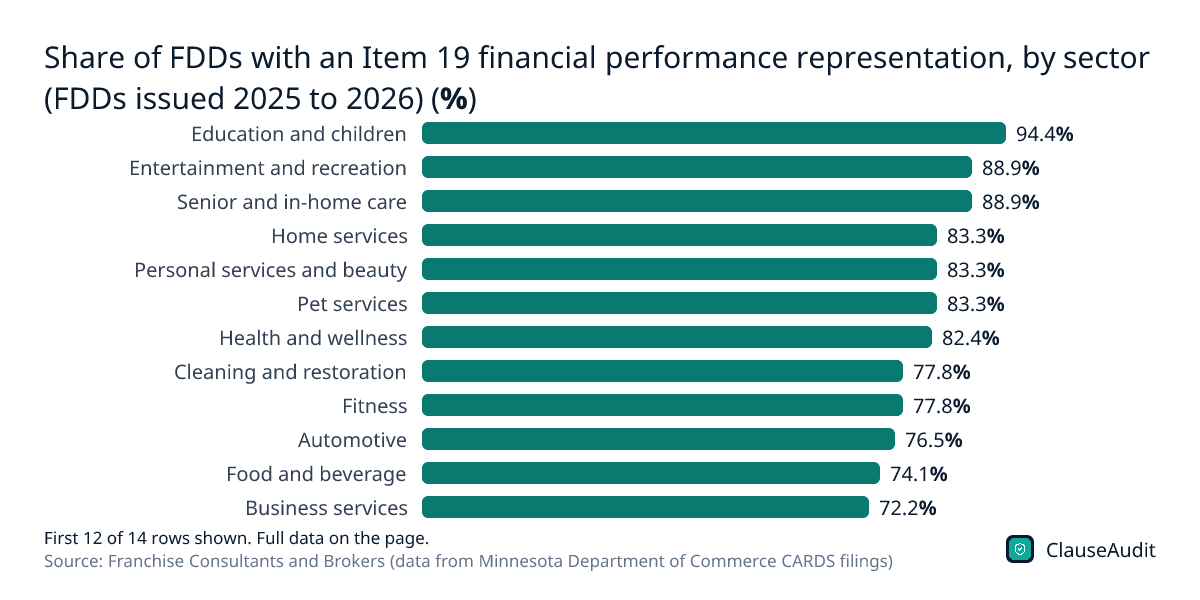
Share of FDDs with an Item 19 financial performance representation, by sector (FDDs issued 2025 to 2026) (%)
Chart data
| Label | Value |
|---|---|
| Education and children | 94.4% |
| Entertainment and recreation | 88.9% |
| Senior and in-home care | 88.9% |
| Home services | 83.3% |
| Personal services and beauty | 83.3% |
| Pet services | 83.3% |
| Health and wellness | 82.4% |
| Cleaning and restoration | 77.8% |
| Fitness | 77.8% |
| Automotive | 76.5% |
| Food and beverage | 74.1% |
| Business services | 72.2% |
| Retail | 55.6% |
| Lodging | 44.4% |
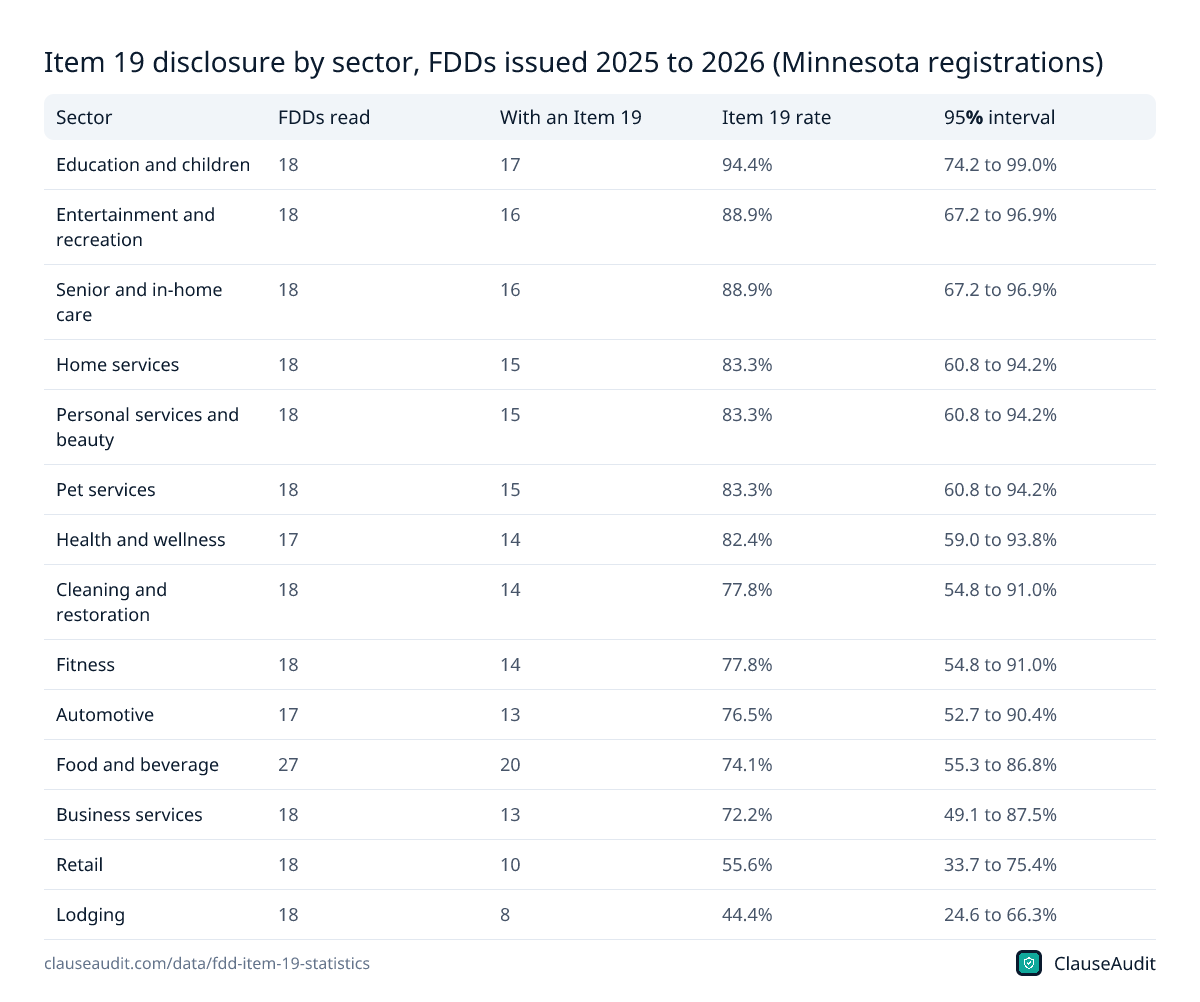
Education and children's brands disclosed most often at 94.4%, while lodging sat at 44.4%. Each sector rests on a small number of FDDs, so one brand can move a rate by several points. Read the gaps as directional.
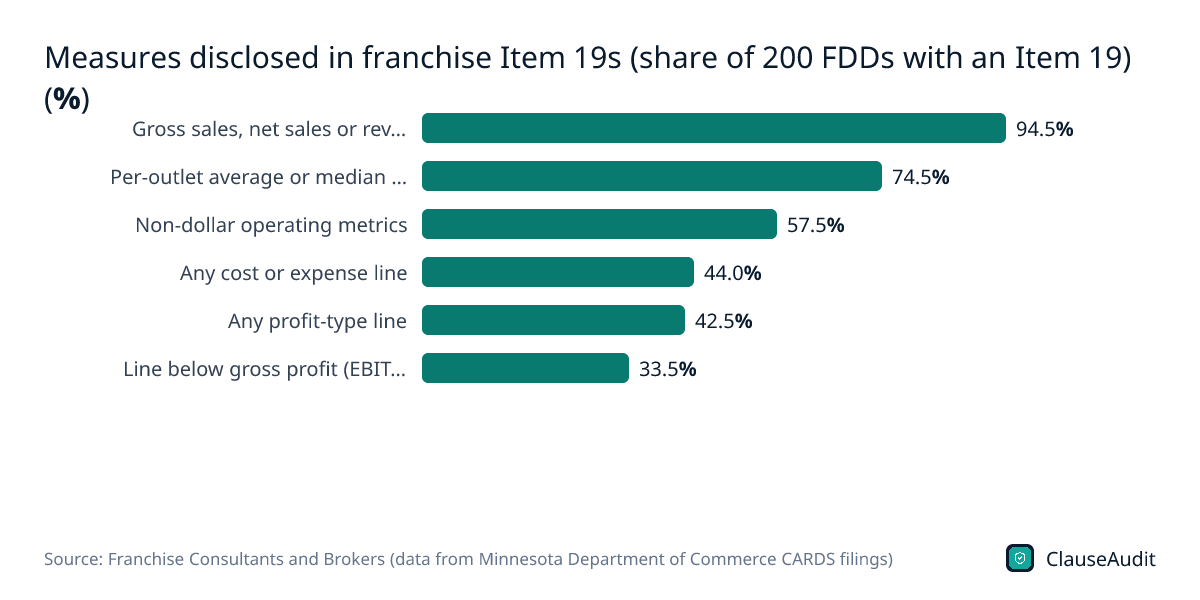
Download this chart (PNG)Measures disclosed in franchise Item 19s (share of 200 FDDs with an Item 19) (%)
Chart data
| Label | Value |
|---|---|
| Gross sales, net sales or revenue | 94.5% |
| Per-outlet average or median sales (AUV) | 74.5% |
| Non-dollar operating metrics | 57.5% |
| Any cost or expense line | 44.0% |
| Any profit-type line | 42.5% |
| Line below gross profit (EBITDA, operating or net income) | 33.5% |
Revenue shows up almost everywhere at 94.5%. Only 33.5% of Item 19s go below gross profit to something like EBITDA or net income, which is closer to what you would take home.
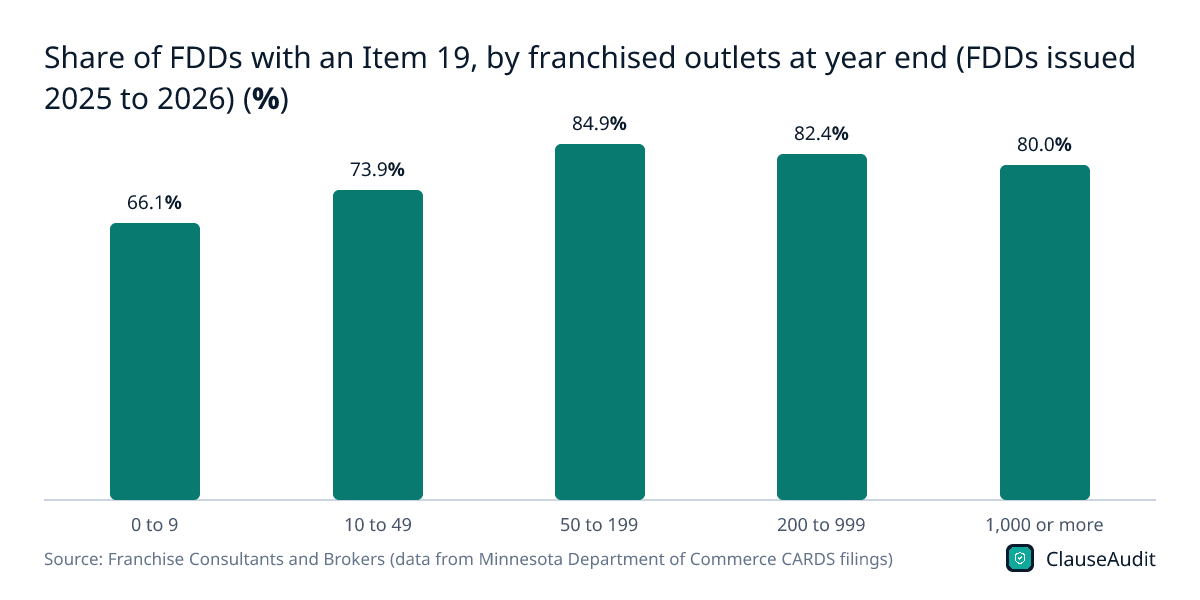
Download this chart (PNG)Share of FDDs with an Item 19, by franchised outlets at year end (FDDs issued 2025 to 2026) (%)
Chart data
| Label | Value (%) |
|---|---|
| 0 to 9 | 66.1% |
| 10 to 49 | 73.9% |
| 50 to 199 | 84.9% |
| 200 to 999 | 82.4% |
| 1,000 or more | 80.0% |
The smallest systems, with 0 to 9 franchised outlets, disclosed least at 66.1%. A young brand may simply have too little history, which is worth asking about directly.
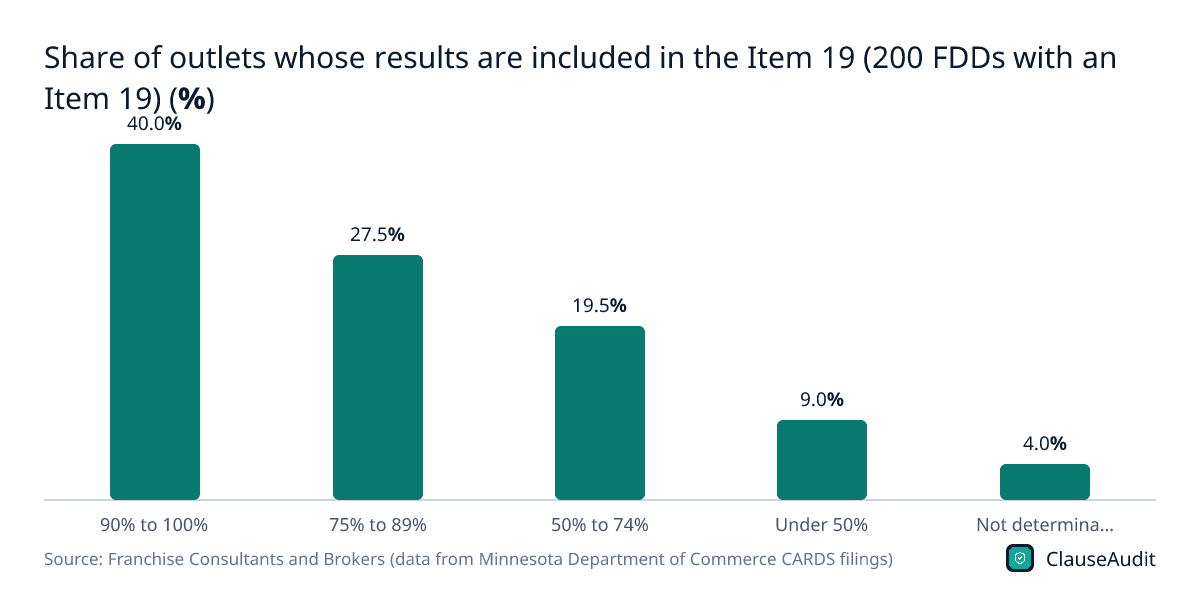
Download this chart (PNG)Share of outlets whose results are included in the Item 19 (200 FDDs with an Item 19) (%)
Chart data
| Label | Value (%) |
|---|---|
| 90% to 100% | 40.0% |
| 75% to 89% | 27.5% |
| 50% to 74% | 19.5% |
| Under 50% | 9.0% |
| Not determinable | 4.0% |
In 40.0% of Item 19s, the figures cover 90% to 100% of outlets. In 9.0%, fewer than half the outlets are counted, so the average can describe a select group.
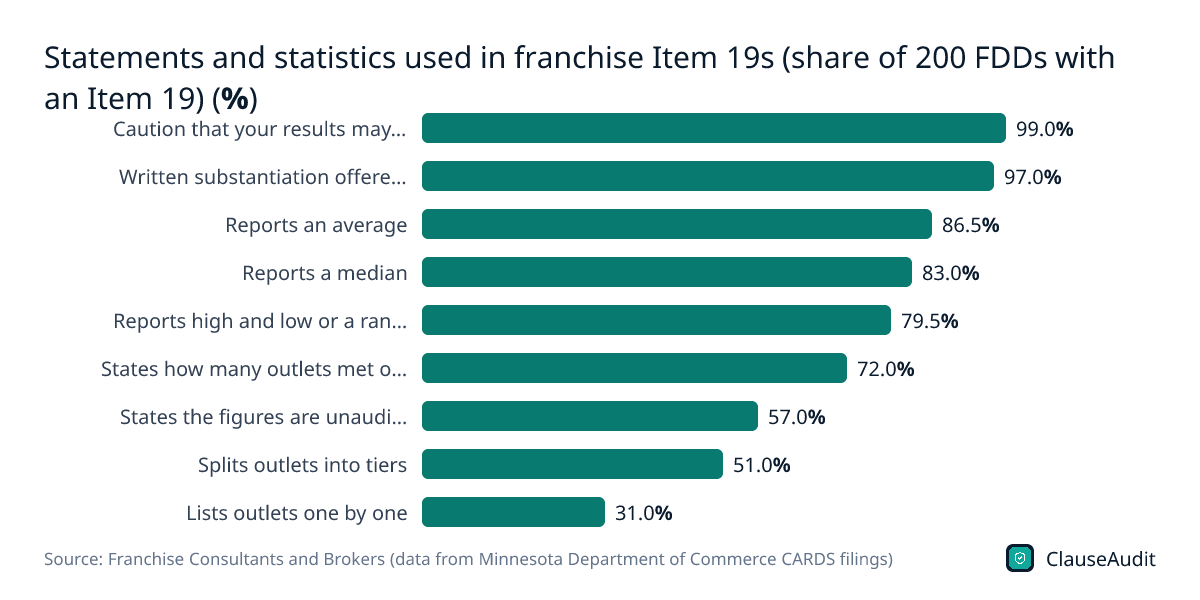
Download this chart (PNG)Statements and statistics used in franchise Item 19s (share of 200 FDDs with an Item 19) (%)
Chart data
| Label | Value |
|---|---|
| Caution that your results may differ | 99.0% |
| Written substantiation offered on request | 97.0% |
| Reports an average | 86.5% |
| Reports a median | 83.0% |
| Reports high and low or a range | 79.5% |
| States how many outlets met or beat the average or median | 72.0% |
| States the figures are unaudited | 57.0% |
| Splits outlets into tiers | 51.0% |
| Lists outlets one by one | 31.0% |
Nearly every Item 19 warns that your results may differ (99.0%). Fewer state whether the numbers were audited, and only 31.0% list outlets one by one.
Download this chart (PNG)Item 19 disclosure by sector, FDDs issued 2025 to 2026 (Minnesota registrations)
| Sector | FDDs read | With an Item 19 | Item 19 rate | 95% interval |
|---|---|---|---|---|
| Education and children | 18 | 17 | 94.4% | 74.2 to 99.0% |
| Entertainment and recreation | 18 | 16 | 88.9% | 67.2 to 96.9% |
| Senior and in-home care | 18 | 16 | 88.9% | 67.2 to 96.9% |
| Home services | 18 | 15 | 83.3% | 60.8 to 94.2% |
| Personal services and beauty | 18 | 15 | 83.3% | 60.8 to 94.2% |
| Pet services | 18 | 15 | 83.3% | 60.8 to 94.2% |
| Health and wellness | 17 | 14 | 82.4% | 59.0 to 93.8% |
| Cleaning and restoration | 18 | 14 | 77.8% | 54.8 to 91.0% |
| Fitness | 18 | 14 | 77.8% | 54.8 to 91.0% |
| Automotive | 17 | 13 | 76.5% | 52.7 to 90.4% |
| Food and beverage | 27 | 20 | 74.1% | 55.3 to 86.8% |
| Business services | 18 | 13 | 72.2% | 49.1 to 87.5% |
| Retail | 18 | 10 | 55.6% | 33.7 to 75.4% |
| Lodging | 18 | 8 | 44.4% | 24.6 to 66.3% |
Source: Franchise Consultants and Brokers (data from Minnesota Department of Commerce CARDS filings), Franchise Item 19 Disclosure: What 259 FDDs Report and Leave Out (2025 to 2026). Download as image
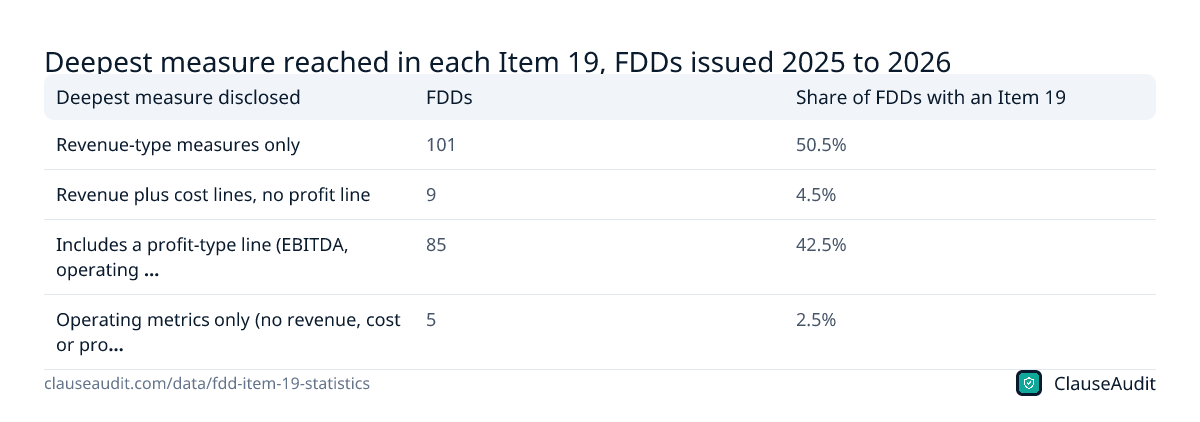
Deepest measure reached in each Item 19, FDDs issued 2025 to 2026
| Deepest measure disclosed | FDDs | Share of FDDs with an Item 19 |
|---|---|---|
| Revenue-type measures only | 101 | 50.5% |
| Revenue plus cost lines, no profit line | 9 | 4.5% |
| Includes a profit-type line (EBITDA, operating or net income, gross profit) | 85 | 42.5% |
| Operating metrics only (no revenue, cost or profit figure) | 5 | 2.5% |
Source: Franchise Consultants and Brokers (data from Minnesota Department of Commerce CARDS filings), Franchise Item 19 Disclosure: What 259 FDDs Report and Leave Out (2025 to 2026). Download as image
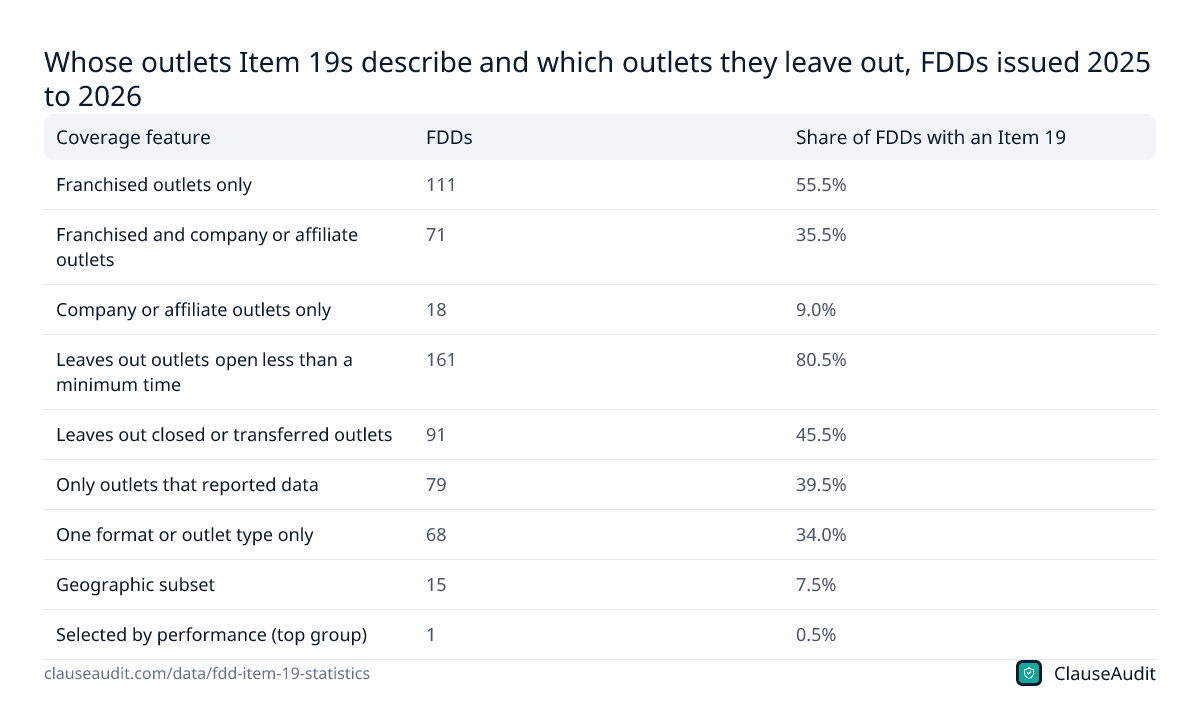
Whose outlets Item 19s describe and which outlets they leave out, FDDs issued 2025 to 2026
| Coverage feature | FDDs | Share of FDDs with an Item 19 |
|---|---|---|
| Franchised outlets only | 111 | 55.5% |
| Franchised and company or affiliate outlets | 71 | 35.5% |
| Company or affiliate outlets only | 18 | 9.0% |
| Leaves out outlets open less than a minimum time | 161 | 80.5% |
| Leaves out closed or transferred outlets | 91 | 45.5% |
| Only outlets that reported data | 79 | 39.5% |
| One format or outlet type only | 68 | 34.0% |
| Geographic subset | 15 | 7.5% |
| Selected by performance (top group) | 1 | 0.5% |
Source: Franchise Consultants and Brokers (data from Minnesota Department of Commerce CARDS filings), Franchise Item 19 Disclosure: What 259 FDDs Report and Leave Out (2025 to 2026). Download as image
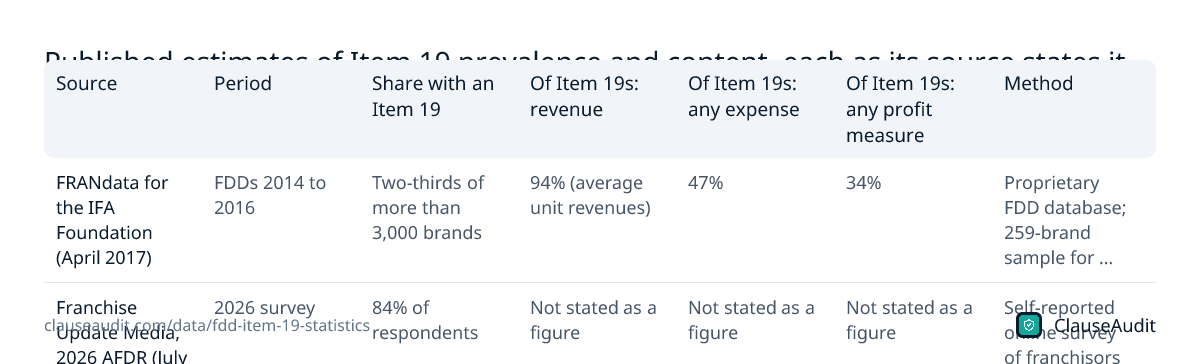
Published estimates of Item 19 prevalence and content, each as its source states it
| Source | Period | Share with an Item 19 | Of Item 19s: revenue | Of Item 19s: any expense | Of Item 19s: any profit measure | Method |
|---|---|---|---|---|---|---|
| FRANdata for the IFA Foundation (April 2017) | FDDs 2014 to 2016 | Two-thirds of more than 3,000 brands | 94% (average unit revenues) | 47% | 34% | Proprietary FDD database; 259-brand sample for content |
| Franchise Update Media, 2026 AFDR (July 14, 2026) | 2026 survey | 84% of respondents | Not stated as a figure | Not stated as a figure | Not stated as a figure | Self-reported online survey of franchisors |
| Franchise Consultants and Brokers (October 6, 2026) | FDDs issued Jan 2025 to Aug 2026 | 77.2% (200 of 259) | 94.5% | 44.0% | 42.5% | Hand reading of 259 Minnesota-registered FDDs |
Source: FRANdata for the IFA Franchise Education and Research Foundation, Financial Performance Representation: Market Demand Pushing Higher Levels of Transparency; Franchise Update Media, Looking at What is in a Franchise's FDD (2026 Annual Franchise Development Report summary); Franchise Consultants and Brokers (data from Minnesota Department of Commerce CARDS filings), Franchise Item 19 Disclosure: What 259 FDDs Report and Leave Out (2025 to 2026). Download as image
What is Item 19 in an FDD?
The FTC Franchise Rule requires a franchisor to hand you its FDD before you sign or pay. Item 19 covers financial performance representations: any statement about the sales, income or profit of existing or likely outlets.
Two things make Item 19 unusual. First, it is voluntary. A franchisor that does not want to give figures prints a prescribed no-representation statement instead, and 22.8% of the FDDs in the study did exactly that. Second, if a franchisor does make earnings claims, they are supposed to live in Item 19 and nowhere else. A salesperson who shows you a spreadsheet of owner profits that does not appear in Item 19 is a warning sign.
Whatever the franchisor puts in Item 19 must have a reasonable basis, and 97.0% of the Item 19s studied offered written substantiation on request. You are allowed to ask for it. Do.
How many franchisors disclose Item 19?
In the 2025 to 2026 sample, 77.2% of FDDs included an Item 19, with a 95% interval of 71.7% to 81.9%. That is a large share, though the sample drew a set quota of FDDs per sector, so it is not weighted to all franchisors.
Older data points the same way. FRANdata, working for the IFA Foundation, found that two-thirds of more than 3,000 brands gave a financial performance representation in FDDs from 2014 to 2016. A 2026 Franchise Update Media survey had 84% of franchisors saying they provide one, but that is a self-reported answer from franchise development staff, not a count of filed documents.
Sector matters more than the overall rate suggests. Retail disclosed at 55.6% and lodging at 44.4%, well under the 94.4% for education and children's brands. If you are shopping in a sector where silence is common, a missing Item 19 is less unusual. It still means you have to build the numbers yourself.
Does Item 19 show franchise profit?
Usually not. Of the 200 Item 19s, 94.5% reported gross sales, net sales or revenue, and 74.5% gave a per-outlet average or median sales figure. Only 42.5% showed any profit-type line, and that includes gross profit. Just 33.5% went further down to EBITDA, operating income or net income.
Put another way, 101 of the 200 Item 19s, or 50.5%, stopped at revenue. A unit that does high sales can still lose money once rent, payroll, royalties and marketing fees come out. A strong average sales figure, on its own, tells you nothing about whether a typical owner clears enough to repay a loan.
This is not new. In the 2014 to 2016 FRANdata work, 94% of brands with an Item 19 gave average unit revenues, 47% showed any operating expenses and 34% showed profitability. The broad pattern looks much the same today.
Which outlets are left out of the numbers?
An average is only as honest as the group it averages. The median Item 19 covered 85.5% of outlets, measured across the 192 where coverage could be worked out. That leaves a slice of the system outside the figures in most documents.
The common exclusions are easy to miss. 80.5% of Item 19s left out outlets open less than a minimum time. 45.5% dropped closed or transferred outlets, which are often the weakest performers. 39.5% counted only outlets that reported data, and 34.0% looked at a single format or outlet type. Each of these can be reasonable on its own. Stacked together, they can make the average describe the survivors rather than the system.
Also check whose outlets you are looking at. In 9.0% of Item 19s, the figures came from company or affiliate outlets only. Those locations may have better sites, bigger budgets and no royalty to pay, so they are a weak stand-in for a franchisee's results.
What the numbers mean if you are buying a franchise
Start by sorting the brands on your list into three groups: no Item 19, revenue only, and revenue with costs or profit. That simple sort tells you how much homework each one leaves you. A brand in the third group has done part of the work. A brand in the first has left all of it to you.
For a revenue-only Item 19, your job is to build the missing half. Ask the franchisor for typical occupancy and labor costs, then test those against what owners tell you. Lenders will do the same math, so you may as well do it first and walk in with a budget you believe.
Size matters too. Smaller systems disclose less often, and when they do, the figures may rest on a handful of outlets, sometimes company-run ones. Ask how many units sit behind each number and how long they have been open. A median drawn from mature outlets in strong markets is a ceiling for a new owner, not a forecast.
Finally, remember the agreement does not care what Item 19 said. Your royalty, ad fund contribution and lease payment are due in a slow month just as in a strong one.
How to read an Item 19 before you sign
- Find the base. Note how many outlets the figures cover and compare it to the total in Item 20. A big gap needs an explanation.
- Look for the median, not just the average. 83.0% of Item 19s report a median; a few strong units can drag an average up.
- Check how many outlets met or beat the average. 72.0% of Item 19s say so. If yours does not, ask.
- Ask whether the figures are audited. 57.0% state that they are unaudited, which is common but worth knowing.
- Build your own profit picture. Start from the revenue figure and subtract royalties and ad fees from the FDD's fee disclosures, then your rent, payroll and loan payments.
- Call current and former franchisees from the Item 20 list and ask what they actually net. Their answers are the best check on Item 19.
- Request the written substantiation. If the franchisor will not provide it, treat the numbers with care.
How ClauseAudit helps
Item 19 tells you what a franchisor is willing to say about earnings. The franchise agreement tells you what you owe no matter how those earnings turn out. Upload the agreement or the FDD and our automated review flags the clauses that decide whether a revenue figure turns into profit for you.
You get each risk explained in plain English, with a note on what to ask the franchisor or your attorney.
- Royalty and marketing fund fees, including minimums owed even in a slow month
- Any statement that you did not rely on earnings claims outside Item 19
- Required spending on remodels, technology and approved suppliers
- Term, renewal conditions and the fee to renew
- Termination triggers, cure periods and the post-term non-compete
- Personal guarantees that put your own assets behind the lease and the agreement
Frequently asked questions
Is a franchisor required to provide Item 19?
No. Item 19 is optional under the FTC Franchise Rule. A franchisor that does not want to make earnings claims prints the FTC's prescribed no-representation statement instead. In FDDs issued from January 2025 to August 2026, 22.8% took that route. If a brand skips Item 19, its sales staff should not give you earnings figures in other ways.
What percentage of franchises disclose Item 19?
In a reading of 259 Minnesota-registered FDDs issued from January 2025 to August 2026, 200 of them, or 77.2%, included an Item 19. Earlier FRANdata work found two-thirds of more than 3,000 brands did so in FDDs from 2014 to 2016. The share varies by sector, from 94.4% in education and children's brands to 44.4% in lodging.
Is a franchise without an Item 19 a red flag?
Not by itself. Some young systems have too little history, and the smallest systems in the study, with 0 to 9 franchised outlets, disclosed at 66.1%. But without Item 19 you carry the whole job of estimating sales and profit. Lean harder on franchisee calls, Item 20 turnover and your own budget before you commit money.
What is AUV in Item 19?
AUV means average unit volume, the average annual sales per outlet. In the 2025 to 2026 sample, 74.5% of Item 19s gave a per-outlet average or median sales figure. AUV is a sales number, not a profit number. Subtract royalties, marketing fees, rent, labor and debt service to see what an owner might actually keep.
Why do Item 19s leave out some outlets?
Franchisors often drop outlets that opened recently, closed, changed hands or did not report data. In the study, 80.5% of Item 19s excluded outlets open less than a minimum time and 45.5% excluded closed or transferred outlets. These rules should be disclosed. Read them closely, because they can push the average above what a typical outlet earns.
Can I trust the numbers in Item 19?
They must have a reasonable basis, and 97.0% of Item 19s in the study offered written substantiation on request. Still, 57.0% said the figures were unaudited. Ask for the backup, compare the outlet count to Item 20, and check the numbers against what current franchisees tell you on the phone.
Does Item 19 show how much franchise owners make?
Rarely in full. Only 42.5% of Item 19s in the 2025 to 2026 sample showed any profit-type line, and 33.5% reached EBITDA, operating income or net income. Even then, figures may be before owner pay, debt service or taxes. Treat Item 19 as a starting point for your own profit model.
Can a franchise salesperson give me earnings figures not in Item 19?
They should not. Earnings claims are supposed to appear in Item 19, and a franchisor that prints the no-representation statement should not make them at all. If someone shares extra figures, ask that they be put in writing and compare them to Item 19. Many franchise agreements also ask you to confirm you did not rely on such claims.
Use this data
Every chart and card below is free to reuse under CC BY 4.0. Download what you need and link back to this page.
 Stat cards
 Key findings card
 Infographic
 Share of FDDs with an Item 19 financial performance representation, by sector (FDDs issued 2025 to 2026) (%)
 Measures disclosed in franchise Item 19s (share of 200 FDDs with an Item 19) (%)
 Share of FDDs with an Item 19, by franchised outlets at year end (FDDs issued 2025 to 2026) (%)
 Share of outlets whose results are included in the Item 19 (200 FDDs with an Item 19) (%)
 Statements and statistics used in franchise Item 19s (share of 200 FDDs with an Item 19) (%)
 Item 19 disclosure by sector, FDDs issued 2025 to 2026 (Minnesota registrations)
 Deepest measure reached in each Item 19, FDDs issued 2025 to 2026
 Whose outlets Item 19s describe and which outlets they leave out, FDDs issued 2025 to 2026
 Published estimates of Item 19 prevalence and content, each as its source states it
Embed the infographic
Free to share on your site, blog or slides under CC BY 4.0. Please keep the credit link.
Sources and method
Every number on this page comes from the sources below, each opened and read on or before October 18, 2026. A second, independent review checked every figure against its source and corrected anything that did not match. Figures that could not be confirmed were left out.
- Franchise Consultants and Brokers (data from Minnesota Department of Commerce CARDS filings), Franchise Item 19 Disclosure: What 259 FDDs Report and Leave Out (2025 to 2026) (Updated October 6, 2026 (first release))
- FRANdata for the IFA Franchise Education and Research Foundation, Financial Performance Representation: Market Demand Pushing Higher Levels of Transparency (April 2017)
- Franchise Update Media, Looking at What is in a Franchise's FDD (2026 Annual Franchise Development Report summary) (July 14, 2026)
Cite this page
ClauseAudit, “FDD Item 19 Statistics: How Many Franchisors Disclose Earnings, and What They Include”, updated October 18, 2026, https://clauseaudit.com/data/fdd-item-19-statistics. Free to reuse with a link back (CC BY 4.0).
This page summarises published data and law as checked on October 18, 2026. Figures are updated as new editions are released, and your own situation may differ. It is general information, not legal, tax or financial advice.