Renter Statistics 2026: 160+ Numbers on Rent, Affordability, Fees, Screening and Evictions
By ClauseAudit Research · 161 statistics · 82 sources ·
What are the key renter statistics for 2026?
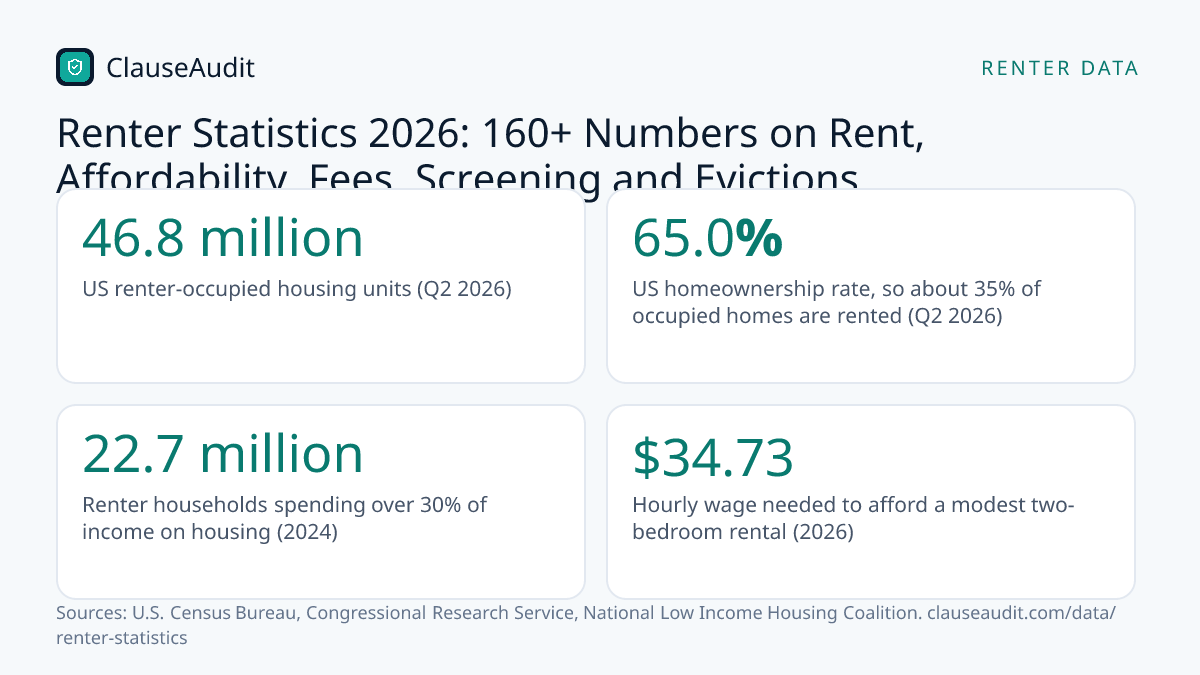
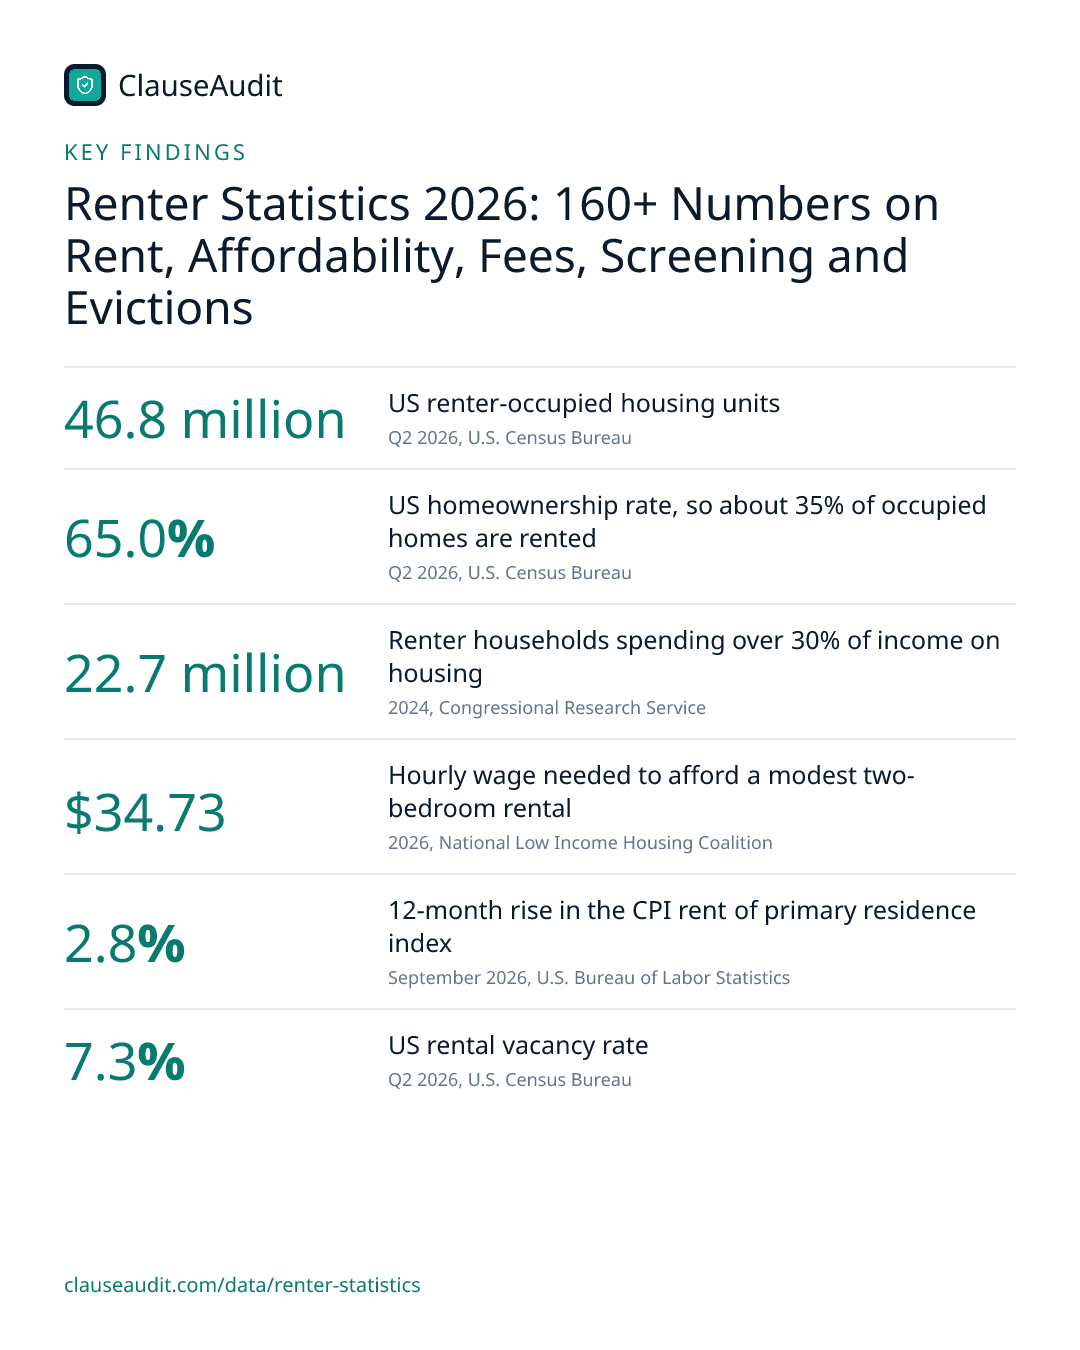
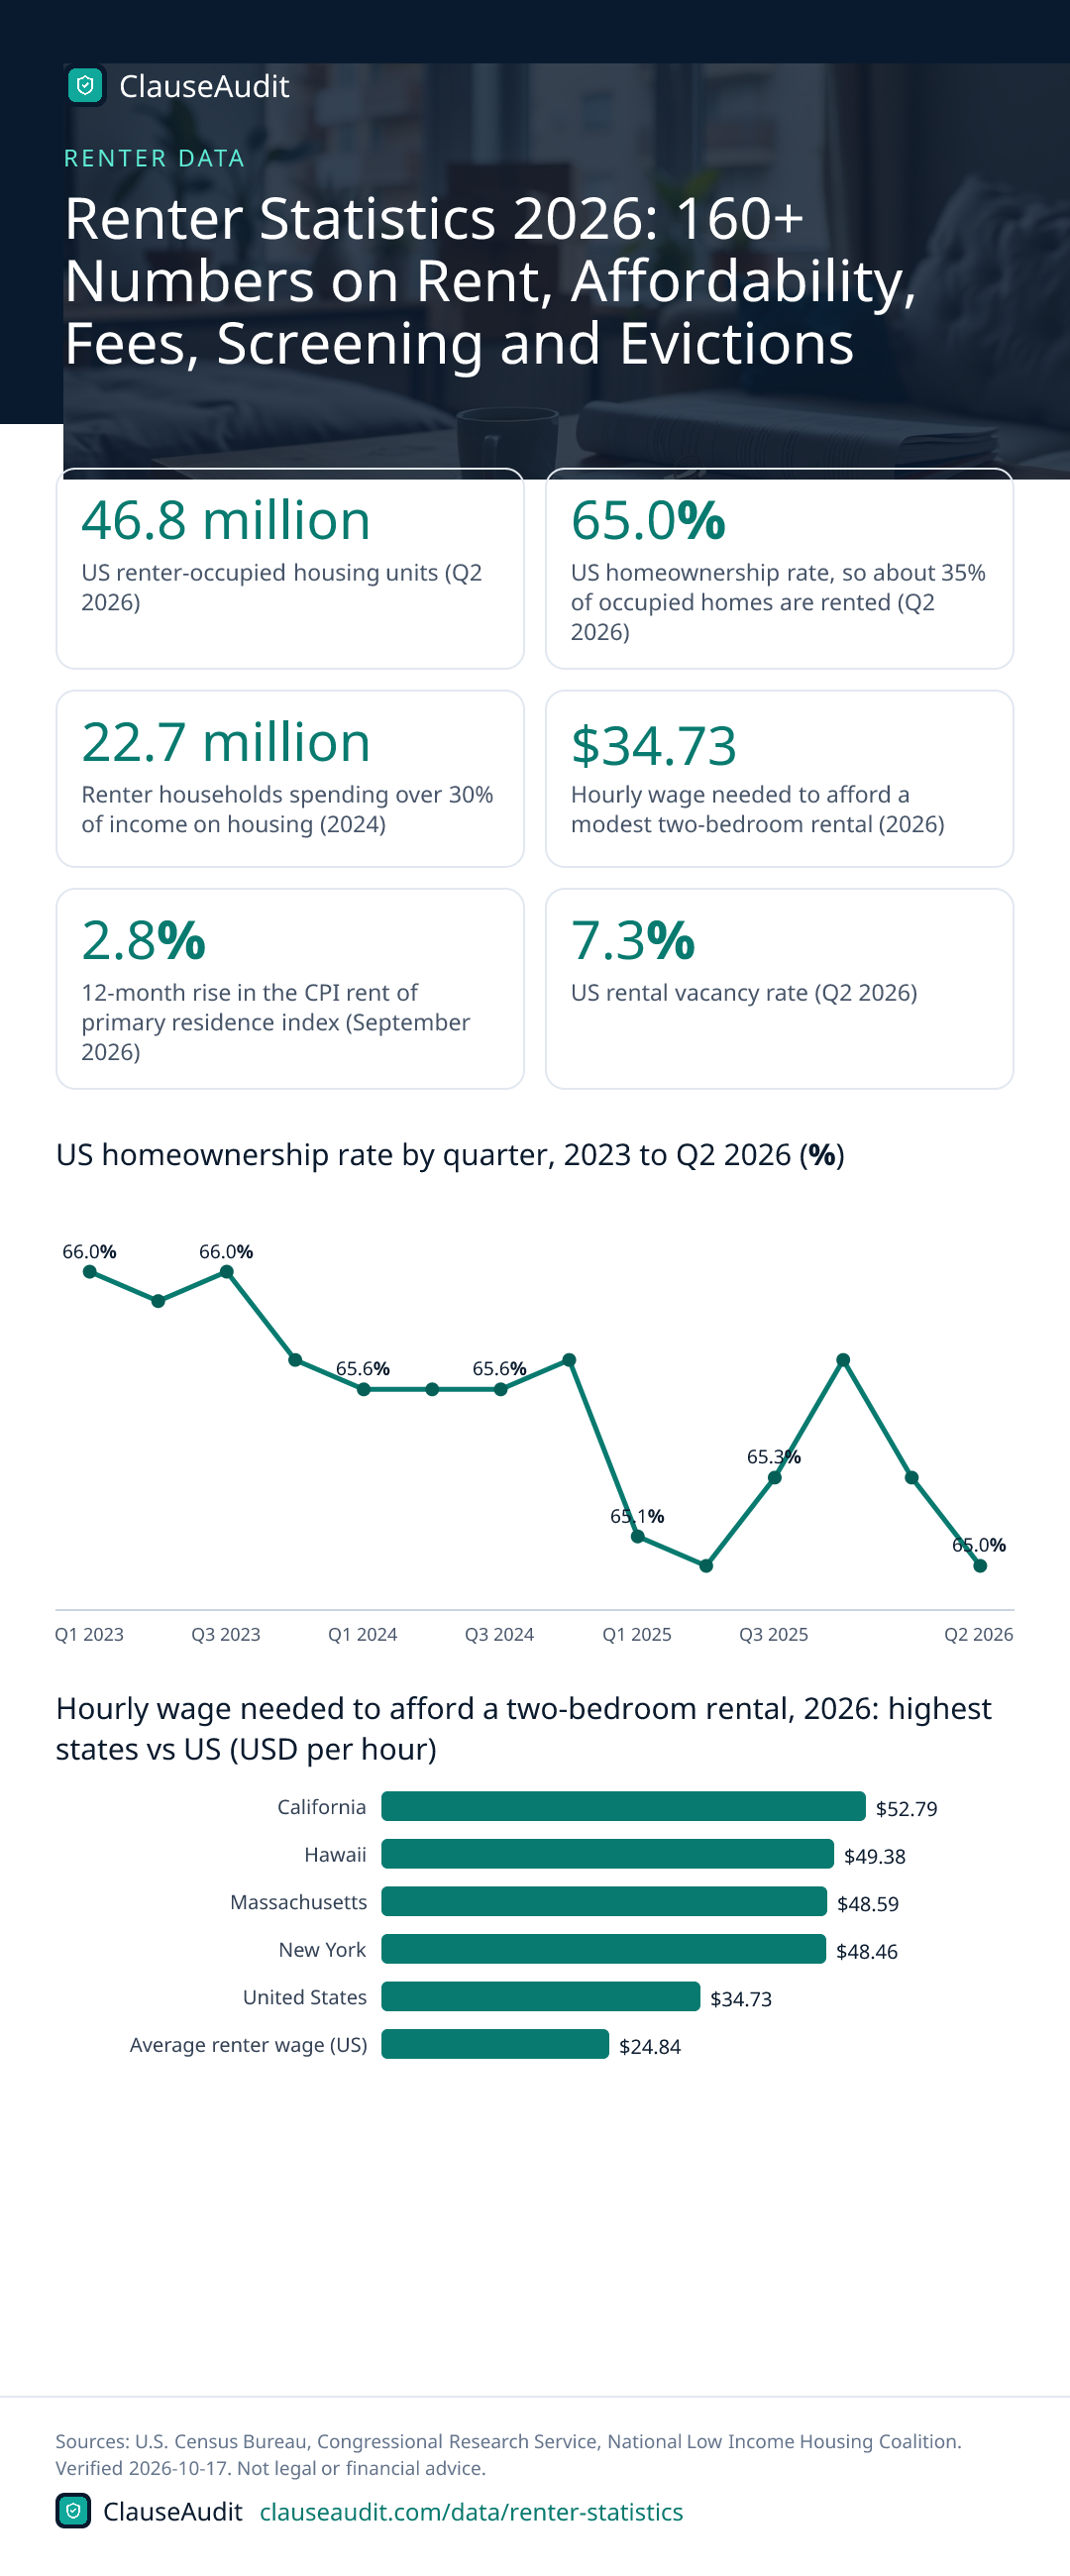
The US had 46.8 million renter-occupied homes in Q2 2026, and the homeownership rate was 65.0%, so about 35% of occupied homes were rented. In 2024, 22.7 million renter households (49.4%) spent over 30% of income on housing. Rent rose 2.8% in the year to September 2026, and the two-bedroom Housing Wage is $34.73 an hour.

- US renter-occupied housing units (Q2 2026, U.S. Census Bureau)
- 46.8 million
- US homeownership rate, so about 35% of occupied homes are rented (Q2 2026, U.S. Census Bureau)
- 65.0%
- Renter households spending over 30% of income on housing (2024, Congressional Research Service)
- 22.7 million
- Hourly wage needed to afford a modest two-bedroom rental (2026, National Low Income Housing Coalition)
- $34.73
- 12-month rise in the CPI rent of primary residence index (September 2026, U.S. Bureau of Labor Statistics)
- 2.8%
- US rental vacancy rate (Q2 2026, U.S. Census Bureau)
- 7.3%
- Eviction cases filed in 2025 across Eviction Lab tracked sites (2025, The Eviction Lab, Princeton University)
- 1.23 million
- Median net worth of renters and other non-homeowners, versus $458,900 for homeowners (2025, Board of Governors of the Federal Reserve System)
- $10,600
This page collects more than 160 renter statistics in twelve groups: how many Americans rent, who rents, rent prices, affordability, vacancy and new supply, lease renewals and moves, deposits and fees, tenant screening, evictions, renter finances and insurance, single-family rental ownership, and renting outside the US, including India.
Most US figures come from the Census Bureau, the Bureau of Labor Statistics, the Federal Reserve, the Congressional Research Service and the National Low Income Housing Coalition, with private rent indexes, landlord earnings reports and advocate surveys labeled as such. Every number links to the page it came from, and the data was checked on October 17, 2026.
How Many Renters Are in the US? Renter Population Statistics
The Census Bureau's quarterly Housing Vacancies and Homeownership survey is the main source for counting US renters here. These figures show how many homes are rented, how the homeownership rate has moved since 2023, and where renting is most common.
- 46.8 million renter-occupied housing units in the US in Q2 2026, up from 46.4 million a year earlier (a change within the margin of error). (U.S. Census Bureau, Quarterly Residential Vacancies and Homeownership, Second Quarter 2026, Q2 2026)
- 31.3% of all US housing units were renter-occupied in Q2 2026, versus 58.2% owner-occupied and 10.5% vacant. (U.S. Census Bureau, Quarterly Residential Vacancies and Homeownership, Second Quarter 2026, Q2 2026)
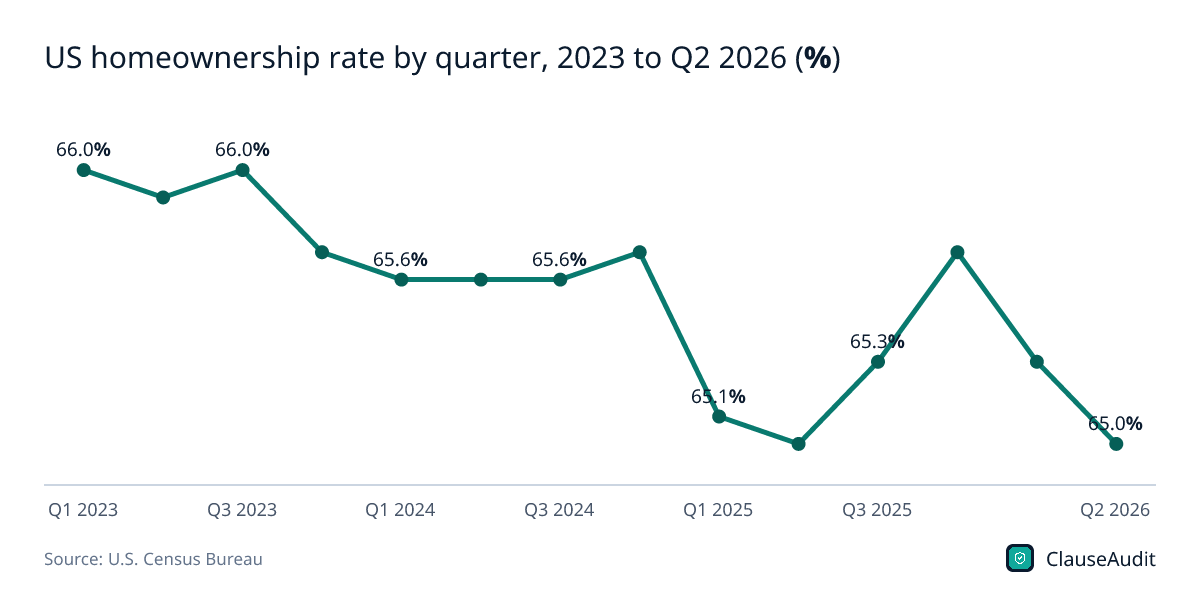
- 65.0% was the US homeownership rate in Q2 2026, unchanged from Q2 2025, so about 35% of occupied homes were rented. (U.S. Census Bureau, Quarterly Residential Vacancies and Homeownership, Second Quarter 2026, Q2 2026)
- 66.0% was the homeownership rate in Q1 and Q3 2023, a full point above the 65.0% recorded in Q2 2026. (U.S. Census Bureau, Quarterly Residential Vacancies and Homeownership, Second Quarter 2026, 2023 to 2026)
- 60.5% homeownership rate in the West made it the region with the largest renter share in Q2 2026. (U.S. Census Bureau, Quarterly Residential Vacancies and Homeownership, Second Quarter 2026, Q2 2026)
- 61.6% was the Northeast homeownership rate in Q2 2026, meaning close to four in ten households there rent. (U.S. Census Bureau, Quarterly Residential Vacancies and Homeownership, Second Quarter 2026, Q2 2026)
- 69.0% homeownership rate made the Midwest the region with the smallest renter share in Q2 2026. (U.S. Census Bureau, Quarterly Residential Vacancies and Homeownership, Second Quarter 2026, Q2 2026)
- 47.6 million renter consumer units were counted in the 2024 Consumer Expenditure Surveys, against 88.1 million homeowner units. (U.S. Bureau of Labor Statistics, Consumer Expenditure Surveys, 2024: Table 1710, Housing tenure, 2024)
- 35% of US consumer units were renters in 2024, while 65% were homeowners, according to BLS spending survey data. (U.S. Bureau of Labor Statistics, Consumer Expenditure Surveys, 2024: Table 1710, Housing tenure, 2024)
- 65.6% of US families owned their primary residence in 2025, down slightly from 66.1% in 2022, leaving about a third renting or in other arrangements. (Board of Governors of the Federal Reserve System, Changes in U.S. Family Finances from 2022 to 2025: Evidence from the Survey of Consumer Finances, 2025)
- 19.2% year-over-year rise in US rental demand in September 2026, measured by the Zillow Observed Renter Demand Index. (Zillow, Rental demand is up 20% as high lending costs stifle the for-sale market, September 2026)
Figure 1: US homeownership rate by quarter, 2023 to Q2 2026 (%)
Chart data
| Label | Value (%) |
|---|---|
| Q1 2023 | 66.0% |
| Q2 2023 | 65.9% |
| Q3 2023 | 66.0% |
| Q4 2023 | 65.7% |
| Q1 2024 | 65.6% |
| Q2 2024 | 65.6% |
| Q3 2024 | 65.6% |
| Q4 2024 | 65.7% |
| Q1 2025 | 65.1% |
| Q2 2025 | 65.0% |
| Q3 2025 | 65.3% |
| Q4 2025 | 65.7% |
| Q1 2026 | 65.3% |
| Q2 2026 | 65.0% |
Renter Demographics Statistics: Age, Race, Income and Household Type
Renting is far more common among younger, lower-income, Black and Hispanic adults. This section draws on the Federal Reserve's household survey, Census homeownership rates and BLS spending data.
- 27% of U.S. adults rented their home in 2025, while 63% owned, according to the Federal Reserve's household survey. (Board of Governors of the Federal Reserve System, Economic Well-Being of U.S. Households in 2025: Housing, 2025)
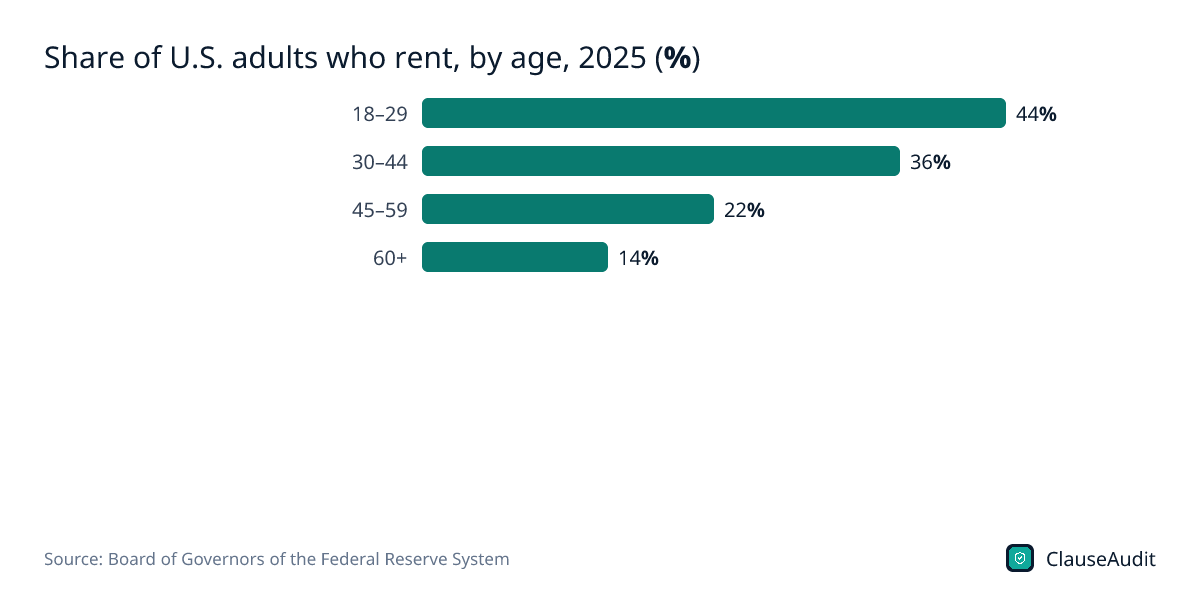
- 44% of adults ages 18 to 29 rented their home in 2025, the highest renting rate of any age group. (Board of Governors of the Federal Reserve System, Economic Well-Being of U.S. Households in 2025: Housing, 2025)
- 14% of adults age 60 and older rented in 2025, compared with 36% of adults ages 30 to 44. (Board of Governors of the Federal Reserve System, Economic Well-Being of U.S. Households in 2025: Housing, 2025)
- 43% of Black adults and 41% of Hispanic adults rented in 2025, versus 20% of White adults. (Board of Governors of the Federal Reserve System, Economic Well-Being of U.S. Households in 2025: Housing, 2025)
- 45% of adults with family income under $25,000 rented in 2025, compared with 12% of those earning $100,000 or more. (Board of Governors of the Federal Reserve System, Economic Well-Being of U.S. Households in 2025: Housing, 2025)
- 36% of adults with a disability rented in 2025, compared with 24% of adults without a disability. (Board of Governors of the Federal Reserve System, Economic Well-Being of U.S. Households in 2025: Housing, 2025)
- 35.2% was the homeownership rate for householders under 35 in Q2 2026, down from 36.4% a year earlier, the lowest of any age group. (U.S. Census Bureau, Quarterly Residential Vacancies and Homeownership, Second Quarter 2026 (Release CB26-116), Q2 2026)
- 45.4% was the homeownership rate for Black householders in Q2 2026, compared with 74.5% for non-Hispanic White householders. (U.S. Census Bureau, Quarterly Residential Vacancies and Homeownership, Second Quarter 2026 (Release CB26-116), Q2 2026)
- 52.1% was the homeownership rate for households with family income below the median in Q2 2026, versus 77.9% for those at or above it. (U.S. Census Bureau, Quarterly Residential Vacancies and Homeownership, Second Quarter 2026 (Release CB26-116), Q2 2026)
- $65,555 was the average pre-tax income of renter households (consumer units) in 2024, about half the $125,105 averaged by homeowners. (U.S. Bureau of Labor Statistics, Consumer Expenditure Surveys, 2024: Table 1710, Housing tenure, 2024)
- 44.7 years was the average age of renter household heads in 2024, compared with 56.2 years for homeowners. (U.S. Bureau of Labor Statistics, Consumer Expenditure Surveys, 2024: Table 1710, Housing tenure, 2024)
- 24% of renter households were headed by a Hispanic or Latino person in 2024 and 21% by a Black person, versus 11% and 9% of homeowners. (U.S. Bureau of Labor Statistics, Consumer Expenditure Surveys, 2024: Table 1710, Housing tenure, 2024)
- 37% of renter households younger than 40 could afford the monthly cost of owning a home in 2024, down from 56% in 2019. (Pew Research Center, Buying a home has gotten harder for young adults in most U.S. metro areas, 2024)
Figure 2: Share of U.S. adults who rent, by age, 2025 (%)
Chart data
| Label | Value |
|---|---|
| 18–29 | 44% |
| 30–44 | 36% |
| 45–59 | 22% |
| 60+ | 14% |
Average Rent Statistics and Rent Growth Trends
Government and private rent measures move at different speeds, because the CPI tracks rents paid by all tenants while listing sites track asking rents for new leases. Both are shown here and labeled by source.
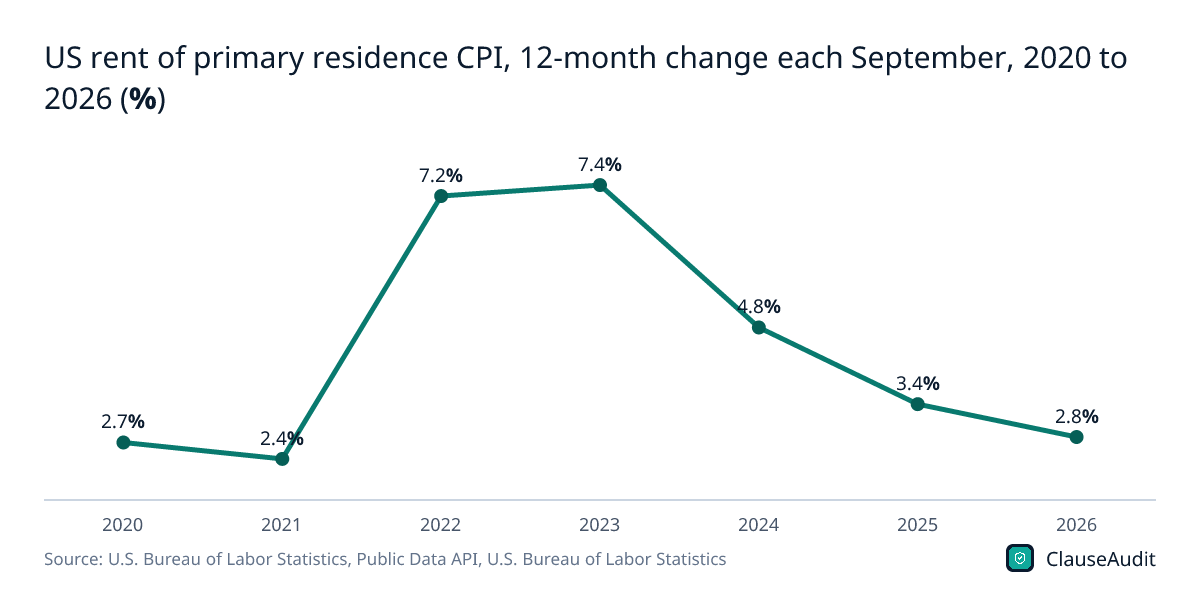
- 2.8% was the 12-month rise in the BLS rent of primary residence index from September 2025 to September 2026, not seasonally adjusted. (U.S. Bureau of Labor Statistics, CPI Table 1: Consumer Price Index for All Urban Consumers, U.S. city average, September 2026, September 2026)
- 3.2% was the year-over-year increase in the CPI shelter index in September 2026, after a 0.4% rise that month. (U.S. Bureau of Labor Statistics, Consumer Price Index News Release, September 2026, September 2026)
- $1,932 was the typical US monthly rent in September 2026, up 2.7% from a year earlier, according to Zillow. (Zillow, Rental demand is up 20% as high lending costs stifle the for-sale market, September 2026)
- 3% was the annual rise in typical single-family asking rents to $2,314 in July 2026, versus a 1.7% gain for multifamily units at $1,786. (Zillow Group, Rents near $2,000, rising at the fastest pace in over a year (Zillow Rental Market Report, July 2026), July 2026)
- 11.8% was San Francisco's year-over-year rise in typical rent in September 2026, versus 8.3% in San Jose, according to Zillow. (Zillow, Rental demand is up 20% as high lending costs stifle the for-sale market, September 2026)
- $77,278 a year in household income is needed to afford the typical US rental in September 2026, versus $121,496 for a typical home, per Zillow. (Zillow, Rental demand is up 20% as high lending costs stifle the for-sale market, September 2026)
- 39.8% of rental listings on Zillow offered a concession in July 2026, up from 35.9% a year earlier. (Zillow Group, Rents near $2,000, rising at the fastest pace in over a year (Zillow Rental Market Report, July 2026), July 2026)
- $1,694 was the median asking rent for studio to two-bedroom units in the 50 largest US metros in September 2026, down 0.4% year over year, the 38th straight annual decline. (Realtor.com (via PR Newswire), Rents Rebound in AI Hubs and Affordable Alternatives: Realtor.com September Rent Report, September 2026)
- 14.5% is how far the September 2026 median asking rent in the 50 largest metros sits above its pre-pandemic level, though it is 4.5% below the August 2022 peak. (Realtor.com (via PR Newswire), Rents Rebound in AI Hubs and Affordable Alternatives: Realtor.com September Rent Report, September 2026)
- 43.9% of studio to two-bedroom rental listings in the 50 largest metros offered a concession in September 2026, up 1.3 percentage points from a year earlier. (Realtor.com (via PR Newswire), Rents Rebound in AI Hubs and Affordable Alternatives: Realtor.com September Rent Report, September 2026)
- 2.0% was the year-over-year rise in US single-family rents in August 2026, with Chicago posting the strongest gain among major metros at 4.9%. (Cotality, Annual Single-Family Rent Growth Accelerated for the Sixth Consecutive Month, August 2026)
- $1,901 was the US median asking rent in December 2025, up 2.1% year over year and $15 below the August 2025 all-time high. (Redfin, Homebuyers Need to Earn $35,000 More Than Renters to Afford Monthly Payments, December 2025)
- 8.0% is the median rent increase US households expected over the next 12 months in the New York Fed 2026 housing survey, unchanged from 2025. (Federal Reserve Bank of New York, SCE Housing Survey 2026, February 2026)
- 12 months is the minimum age of nonpublic landlord data RealPage may use to train its rent-pricing model under its November 2025 DOJ settlement. (U.S. Department of Justice, Justice Department Requires RealPage to End the Sharing of Competitively Sensitive Information, November 2025)
Figure 3: US rent of primary residence CPI, 12-month change each September, 2020 to 2026 (%)
Chart data
| Label | Value (%) |
|---|---|
| 2020 | 2.7% |
| 2021 | 2.4% |
| 2022 | 7.2% |
| 2023 | 7.4% |
| 2024 | 4.8% |
| 2025 | 3.4% |
| 2026 | 2.8% |
Rent Affordability and Cost-Burdened Renter Statistics
A household is cost burdened when housing takes more than 30% of income and severely burdened above 50%. These figures cover burden rates, the wage needed to afford a two-bedroom rental and the shortage of low-cost homes.
- 22.7 million renter households, or 49.4% of renters, spent more than 30% of income on housing in 2024, versus 23.9% of owners. (Congressional Research Service, Housing Cost Burdens in 2024: In Brief (R48945), 2024)
- 26.2% of US renter households were severely cost burdened in 2024, paying more than half of their income on housing. (Congressional Research Service, Housing Cost Burdens in 2024: In Brief (R48945), 2024)
- 67.3% of renter households earning under $30,000 faced severe housing cost burdens in 2024, compared with 57.1% of owners in that bracket. (Congressional Research Service, Housing Cost Burdens in 2024: In Brief (R48945), 2024)
- 46.3%-50.7% of all US renters were cost burdened in every year from 2006 to 2024, so roughly half have been stretched for two decades. (Congressional Research Service, Housing Cost Burdens in 2024: In Brief (R48945), 2006 to 2024)
- 59.3% of Florida renters were cost burdened in 2024, the highest rate of any state; 12 states had more than half of renters burdened. (Congressional Research Service, Housing Cost Burdens in 2024: In Brief (R48945), 2024)
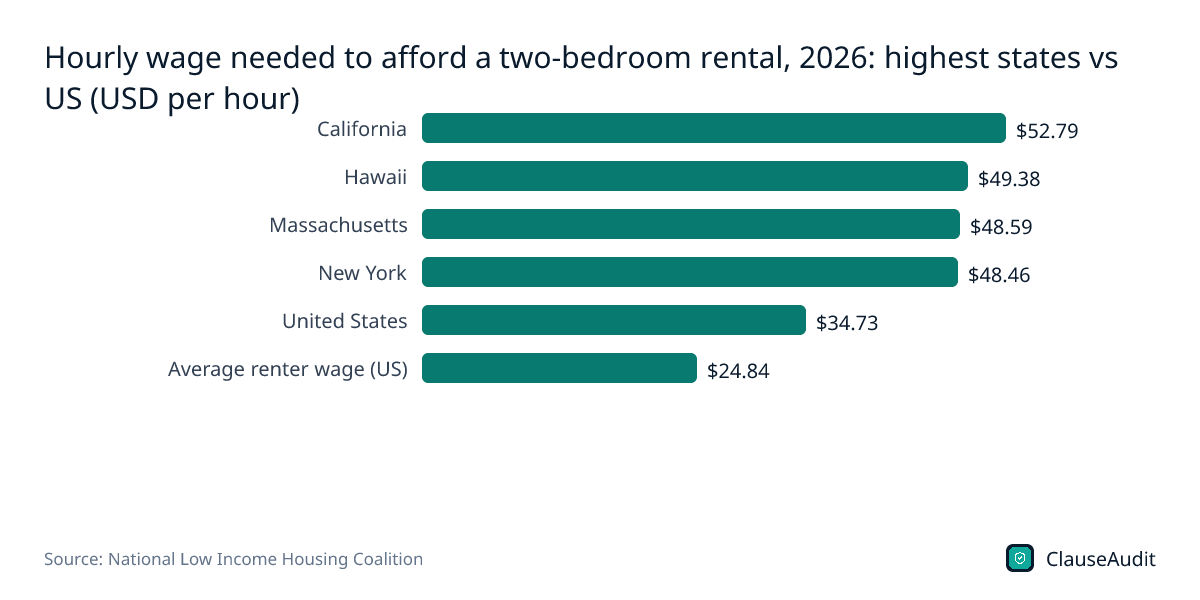
- $34.73 an hour is the 2026 national Housing Wage needed to afford a modest two-bedroom rental at fair market rent without spending over 30% of income. (National Low Income Housing Coalition, NLIHC Releases Out of Reach 2026: The High Cost of Housing, 2026)
- $24.84 an hour is the average renter wage in 2026, $9.89 short of the two-bedroom Housing Wage. (National Low Income Housing Coalition, NLIHC Releases Out of Reach 2026: The High Cost of Housing, 2026)
- 18 of the 25 most common US occupations pay median wages below the two-bedroom Housing Wage in 2026. (National Low Income Housing Coalition, NLIHC Releases Out of Reach 2026: The High Cost of Housing, 2026)
- 7.2 million is the national shortage of rental homes affordable and available to extremely low-income renters, according to The Gap 2026. (National Low Income Housing Coalition, The Gap: A Shortage of Affordable Homes (2026), 2026 edition)
- 35 affordable and available rental homes exist for every 100 extremely low-income renter households in the US. (National Low Income Housing Coalition, The Gap: A Shortage of Affordable Homes (2026), 2026 edition)
- 26.3% of income is what the median US household would spend on a new rental in September 2026. (Zillow, Rental demand is up 20% as high lending costs stifle the for-sale market, September 2026)
- $76,020 a year is the household income needed to afford the typical US rental, according to Redfin December 2025 data. (Redfin, Homebuyers Need to Earn $35,000 More Than Renters to Afford Monthly Payments, the Smallest Gap in 3 Years, December 2025)
- 39.4% of renter households’ annual spending went to housing in 2024, compared with 31.4% for homeowners. (U.S. Bureau of Labor Statistics, Consumer Expenditure Surveys, 2024: Table 1710, Housing tenure, 2024)
- 53.5% of US renters surveyed in January 2026 were rent burdened, paying more than 30% of gross income on rent, the Philadelphia Fed estimates. (Federal Reserve Bank of Philadelphia, Recent Trends in Renter Financial Security and Homebuying Intentions (LIFE Survey), January 2026)
- 27.7% of renters in the Philadelphia Fed January 2026 survey were severely burdened, spending over 50% of gross income on rent. (Federal Reserve Bank of Philadelphia, Recent Trends in Renter Financial Security and Homebuying Intentions (LIFE Survey), January 2026)
Figure 4: Hourly wage needed to afford a two-bedroom rental, 2026: highest states vs US (USD per hour)
Chart data
| Label | Value |
|---|---|
| California | $52.79 |
| Hawaii | $49.38 |
| Massachusetts | $48.59 |
| New York | $48.46 |
| United States | $34.73 |
| Average renter wage (US) | $24.84 |
Rental Vacancy Rate and Rental Housing Supply Statistics
Vacancy and new construction affect how much bargaining power renters have. This section covers the Census vacancy rate, apartment completions and starts, and broker estimates, which use different methods and are not directly comparable.
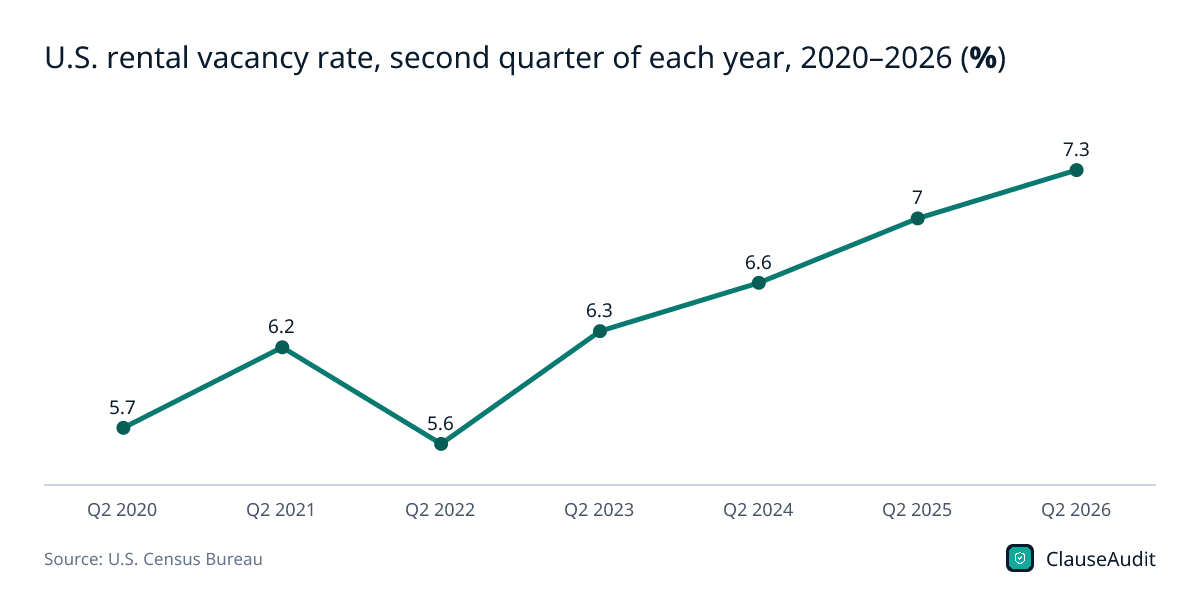
- 7.3% was the U.S. rental vacancy rate in Q2 2026, not statistically different from 7.0% a year earlier. (U.S. Census Bureau, Quarterly Residential Vacancies and Homeownership, Second Quarter 2026 (Release CB26-116), Q2 2026)
- 9.5% was the rental vacancy rate in the South in Q2 2026, the highest of any region, versus 5.3% in the West and 5.9% in the Northeast. (U.S. Census Bureau, Quarterly Residential Vacancies and Homeownership, Second Quarter 2026 (Release CB26-116), Q2 2026)
- 8.0% was the rental vacancy rate in principal cities in Q2 2026, versus 6.9% in suburbs and 5.8% outside metro areas. (U.S. Census Bureau, Quarterly Residential Vacancies and Homeownership, Second Quarter 2026 (Release CB26-116), Q2 2026)
- 2.5% of all U.S. housing units were vacant and for rent in Q2 2026, while renter-occupied units made up 31.3% of the inventory. (U.S. Census Bureau, Quarterly Residential Vacancies and Homeownership, Second Quarter 2026 (Release CB26-116), Q2 2026)
- 484,000 units in buildings with two or more units were completed in 2025, down from 608,000 in 2024, Census construction data show. (U.S. Census Bureau and U.S. Department of Housing and Urban Development, Quarterly Starts and Completions by Purpose and Design (New Residential Construction), 2025)
- 461,000 of the 484,000 multifamily units completed in 2025 were built for rent, with only 23,000 built for sale. (U.S. Census Bureau and U.S. Department of Housing and Urban Development, Quarterly Starts and Completions by Purpose and Design (New Residential Construction), 2025)
- 217,000 multifamily units were completed in the South in 2025, down from 292,000 in 2024. (U.S. Census Bureau and U.S. Department of Housing and Urban Development, Quarterly Starts and Completions by Purpose and Design (New Residential Construction), 2025)
- 392,000 multifamily units started construction as rentals in 2025, up from 331,000 in 2024 but below 459,000 in 2023. (U.S. Census Bureau and U.S. Department of Housing and Urban Development, Quarterly Starts and Completions by Purpose and Design (New Residential Construction), 2025)
- 77,700 new apartment units were completed in Q2 2026, far below the delivery peak of roughly 160,000 units in Q3 2024. (RealPage Analytics, Supply Update 2nd Quarter 2026, Q2 2026)
- 95.4% was average U.S. apartment occupancy in Q3 2026, unchanged from Q2 and 10 basis points above a year earlier, according to RealPage. (RealPage, 3Q 2026 U.S. Data Update, Q3 2026)
- 4.3% was CBRE's national multifamily vacancy rate in Q2 2026, down 50 basis points from the prior quarter. (CBRE, U.S. Multifamily Fundamentals Improve in Q2 2026 as Demand Outpaces New Supply, Q2 2026)
- Fewer than 480,000 apartment units were under construction at the end of Q3 2026, just 3.6% of existing inventory and the lowest level since 2015, per Cushman & Wakefield. (Cushman & Wakefield, U.S. Multifamily MarketBeat, Q3 2026, Q3 2026)
- 8.6% was Cushman & Wakefield's national multifamily vacancy rate in Q3 2026, down 30 basis points; broker methods differ, so rates are not comparable. (Cushman & Wakefield, U.S. Multifamily MarketBeat, Q3 2026, Q3 2026)
- 344,000 was the seasonally adjusted annual rate of housing starts in buildings with five or more units in August 2026; permits ran at 467,000. (U.S. Census Bureau and HUD, Monthly New Residential Construction, August 2026 (CB26-147), August 2026)
- 68,000 single-family built-for-rent homes began construction in 2025, a 19% drop from an estimated 84,000 in 2024, NAHB estimates. (National Association of Home Builders (Eye on Housing), Weaker Conditions for Single-Family Built-for-Rent Housing, 2025)
Figure 5: U.S. rental vacancy rate, second quarter of each year, 2020–2026 (%)
Chart data
| Label | Value (%) |
|---|---|
| Q2 2020 | 5.7 |
| Q2 2021 | 6.2 |
| Q2 2022 | 5.6 |
| Q2 2023 | 6.3 |
| Q2 2024 | 6.6 |
| Q2 2025 | 7 |
| Q2 2026 | 7.3 |
Lease Statistics: Lease Length, Renewals and Move-Out Reasons
Large landlords report how renewal rents compare with new leases, which shows where they set prices for tenants who stay. These figures also cover turnover, how often renters move and why.
- 5.2% was the renewal rate increase Equity Residential achieved on same-store apartments in Q2 2026, while new leases fell 0.7%. (Equity Residential via SEC EDGAR, Equity Residential Reports Second Quarter 2026 Results (Form 8-K, Exhibit 99.1), Q2 2026)
- 60.0% of Equity Residential's same-store residents with expiring leases renewed in Q2 2026, up from 59.3% in Q2 2025. (Equity Residential via SEC EDGAR, Equity Residential Reports Second Quarter 2026 Results (Form 8-K, Exhibit 99.1), Q2 2026)
- 2.8% was Equity Residential's blended same-store lease rate change in Q2 2026, up from 1.5% in Q1 2026. (Equity Residential via SEC EDGAR, Equity Residential Reports Second Quarter 2026 Results (Form 8-K, Exhibit 99.1), Q2 2026)
- -5.3% was MAA's same-store effective new lease rate growth in Q2 2026, while renewals rose 5.2%, for 0.7% blended growth. (Mid-America Apartment Communities via SEC EDGAR, MAA Reports Second Quarter 2026 Results (Form 8-K, Exhibit 99.1), Q2 2026)
- 39.6% was resident turnover in MAA's same-store apartment portfolio as of June 30, 2026, which the company called historically low. (Mid-America Apartment Communities via SEC EDGAR, MAA Reports Second Quarter 2026 Results (Form 8-K, Exhibit 99.1), June 2026)
- 10.9% of MAA apartment move-outs in Q2 2026 were residents leaving to buy single-family homes. (Mid-America Apartment Communities via SEC EDGAR, MAA Reports Second Quarter 2026 Results (Form 8-K, Exhibit 99.1), Q2 2026)
- 2.8% was Camden's renewal rate growth in Q2 2026, including California, while new lease rates fell 3.1%. (Camden Property Trust, Camden Property Trust Announces Second Quarter 2026 Operating Results, Q2 2026)
- 3.3% was Invitation Homes' same-store renewal rent growth on single-family rentals in Q2 2026, against 1.1% for new leases. (Invitation Homes, Invitation Homes Q2 2026 Earnings Release and Supplemental Information, Q2 2026)
- 22.9% was Invitation Homes' trailing four-quarter same-store turnover rate for single-family rental homes as of Q2 2026. (Invitation Homes, Invitation Homes Q2 2026 Earnings Release and Supplemental Information, Q2 2026)
- 16.2% of people living in renter-occupied homes moved in the past year in 2023, compared with 4.1% of people in owner-occupied homes. (U.S. Census Bureau, Table A-4. Annual Geographic Mobility by Tenure: 1988-2023 (CPS ASEC), 2023)
- 41.3% of all US movers in 2023 gave a housing-related reason as their main reason for moving, the largest category. (U.S. Census Bureau, Table A-5. Annual Reason for Move (Collapsed and Specific Categories): 1999-2023 (CPS ASEC), 2023)
- 9.4% of US movers in 2023 said they moved mainly to find cheaper housing. (U.S. Census Bureau, Table A-5. Annual Reason for Move (Collapsed and Specific Categories): 1999-2023 (CPS ASEC), 2023)
- 0.7% of US movers in 2023 named foreclosure or eviction as their main reason for moving. (U.S. Census Bureau, Table A-5. Annual Reason for Move (Collapsed and Specific Categories): 1999-2023 (CPS ASEC), 2023)
- 39% of US renters planned to move in the next 12 months in AppFolio's 2026 survey of 3,002 renters, up from 35% in 2025. (AppFolio, What Renters Want After Free Rent Concessions End (survey of 3,002 U.S. renters), 2026)
| Company | Property type | Renewal lease change | New lease change | Blended change |
|---|---|---|---|---|
| Equity Residential | Apartments | 5.2% | -0.7% | 2.8% |
| MAA | Apartments | 5.2% | -5.3% | 0.7% |
| Camden (incl. California) | Apartments | 2.8% | -3.1% | -0.1% |
| Invitation Homes | Single-family rentals | 3.3% | 1.1% | 2.7% |
Security Deposit, Application Fee and Rental Junk Fee Statistics
Deposits and fees add to the cost of a lease and are a frequent source of disputes. This section covers junk fee surveys, federal enforcement cases and state rules on deposit caps, late fees and deposit return deadlines in several states.
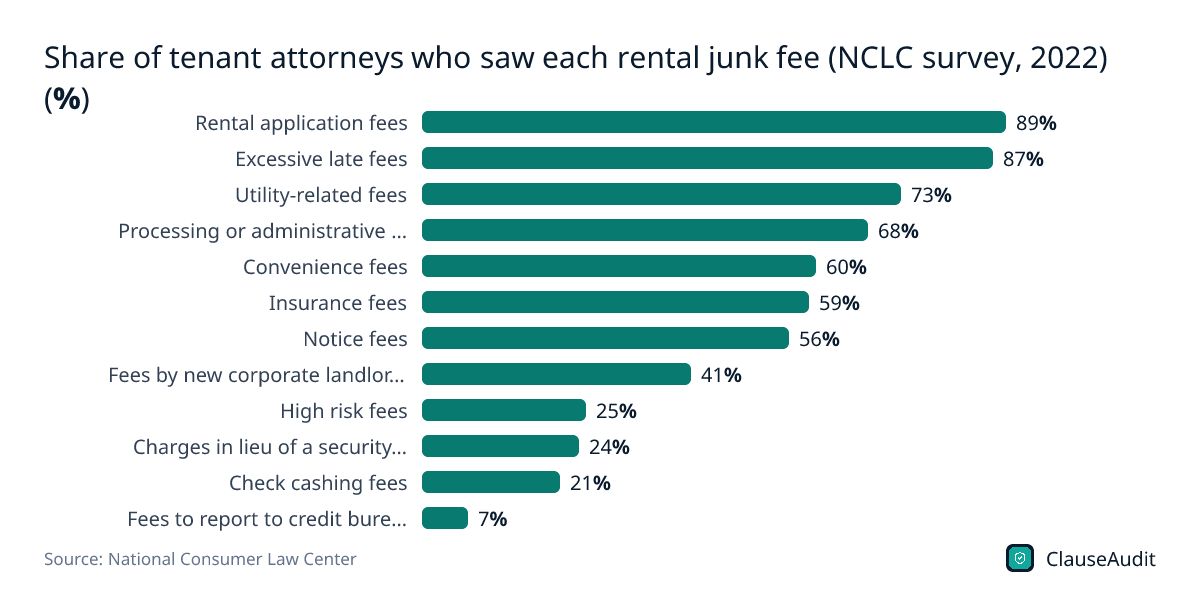
- 89% of legal aid and nonprofit attorneys surveyed in 2022 reported landlords imposing rental application fees, the most common junk fee. (National Consumer Law Center, Too Damn High: How Junk Fees Add to Skyrocketing Rents, 2022)
- 87% of attorneys in the 2022 NCLC survey said landlords charge excessive late fees. (National Consumer Law Center, Too Damn High: How Junk Fees Add to Skyrocketing Rents, 2022)
- 15 days is the Florida deadline to return a security deposit when the landlord makes no claim, or 30 days to send written notice of a claim. (Florida Legislature, Florida Statutes § 83.49 (deposit money or advance rent), Current law)
- $48 million was the refund payment Invitation Homes agreed to in a 2024 FTC settlement over hidden junk fees and withheld security deposits. (Federal Trade Commission, FTC Takes Action Against Invitation Homes for Deceiving Renters, Charging Junk Fees, Withholding Security Deposits, September 2024)
- More than $1,700 a year in mandatory junk fees could be added to Invitation Homes leases, the FTC alleged, often disclosed only after renters saw the lease. (Federal Trade Commission, FTC Takes Action Against Invitation Homes for Deceiving Renters, Charging Junk Fees, Withholding Security Deposits, 2021 to 2023)
- 39.2% of security deposit dollars were returned by Invitation Homes in 2020 to 2022, against a national average of 63.9%, the FTC alleged. (Federal Trade Commission, FTC Takes Action Against Invitation Homes for Deceiving Renters, Charging Junk Fees, Withholding Security Deposits, 2020 to 2022)
- $24 million is what property manager Greystar agreed to pay in December 2025 to settle FTC and Colorado charges over hidden mandatory rental fees. (Federal Trade Commission, Greystar Agrees to Pay $24 Million and Stop Deceptive Advertising Practices, December 2025)
- One month’s rent is the most a New York landlord may collect as a security deposit or advance for covered units. (New York State Senate, New York General Obligations Law § 7-108 (security deposits), Current law)
- $20 is the cap on New York background and credit check fees, or the actual cost if lower. (New York State Senate, New York Real Property Law § 238-A (fees and charges), Current law)
- $50 or 5% of monthly rent, whichever is less, is the most a New York landlord can charge as a late fee, and only after five days. (New York State Senate, New York Real Property Law § 238-A (fees and charges), Current law)
- 1.5 times one month’s rent is the maximum security deposit a New Jersey landlord can collect, with yearly increases capped at 10%. (New Jersey Department of Community Affairs, Truth in Renting: A guide to the rights and responsibilities of residential tenants and landlords in New Jersey, Current law)
- 8% of the overdue rent payment is the maximum late fee a Minnesota landlord may charge, and only if agreed in writing. (Minnesota Office of the Revisor of Statutes, Minnesota Statutes § 504B.177 (late fees), Current law)
- 30 days is how long Washington landlords have to return a deposit or give a full statement, and courts may award up to twice the deposit. (Washington State Legislature, RCW 59.18.280 (return of deposits), Current law)
- 35.0% of renters are charged convenience or service fees in their current home, NLIHC's 2025 National Renter Survey of 3,734 renters found. (National Low Income Housing Coalition, NLIHC Releases Findings from 2025 National Renter Survey, 2025)
Figure 7: Share of tenant attorneys who saw each rental junk fee (NCLC survey, 2022) (%)
Chart data
| Label | Value |
|---|---|
| Rental application fees | 89% |
| Excessive late fees | 87% |
| Utility-related fees | 73% |
| Processing or administrative fees | 68% |
| Convenience fees | 60% |
| Insurance fees | 59% |
| Notice fees | 56% |
| Fees by new corporate landlords | 41% |
| High risk fees | 25% |
| Charges in lieu of a security deposit | 24% |
| Check cashing fees | 21% |
| Fees to report to credit bureaus | 7% |
Tenant Screening and Rental Application Statistics
Landlords often use screening reports to decide on applicants, and errors in those reports can cost a renter a home. These figures come mainly from the CFPB, the FTC and the National Consumer Law Center.
- 26,700 tenant screening complaints reached the CFPB from January 2019 through September 2022 (2022 report), with volumes rising every year. (Consumer Financial Protection Bureau, Consumer Snapshot: Tenant Background Checks, Jan 2019–Sep 2022)
- 17,240 of the 26,700 tenant screening complaints, the largest group, concerned incorrect information on a renter's report (CFPB, 2022). (Consumer Financial Protection Bureau, Consumer Snapshot: Tenant Background Checks, Jan 2019–Sep 2022)
- Almost 700 tenant screening complaints a month reached the CFPB by September 2022, up from about 300 a month in January 2019 (2022 report). (Consumer Financial Protection Bureau, Consumer Snapshot: Tenant Background Checks, Sep 2022)
- 4,956 tenant screening complaints from 2019 to September 2022 concerned problems with a company's investigation of a disputed issue (CFPB, 2022). (Consumer Financial Protection Bureau, Consumer Snapshot: Tenant Background Checks, Jan 2019–Sep 2022)
- 2.3% of the roughly 80 million US adults living in rental housing, just 1.8 million, had a rental tradeline in their traditional credit file in 2019, FICO estimated. (FICO (Joanne Gaskin), Leveraging Alternative Data to Extend Credit to More Borrowers, 2019)
- $11 million in consumer redress plus a $4 million penalty was ordered against TransUnion's rental screening unit in October 2023 over inaccurate eviction records. (Consumer Financial Protection Bureau, Enforcement action: TransUnion Rental Screening Solutions, Inc. and Trans Union LLC, October 2023)
- 86% of advocates answering in NCLC's 2023 survey had seen landlords ignore a renter's screening dispute and reject the applicant, the most common response. (National Consumer Law Center, Digital Denials: How Abuse, Bias, and Lack of Transparency in Tenant Screening Harm Renters, 2023)
- 84% of advocates in NCLC's 2023 survey had seen credit scores used to deny applicants for private rental housing. (National Consumer Law Center, Digital Denials: How Abuse, Bias, and Lack of Transparency in Tenant Screening Harm Renters, 2023)
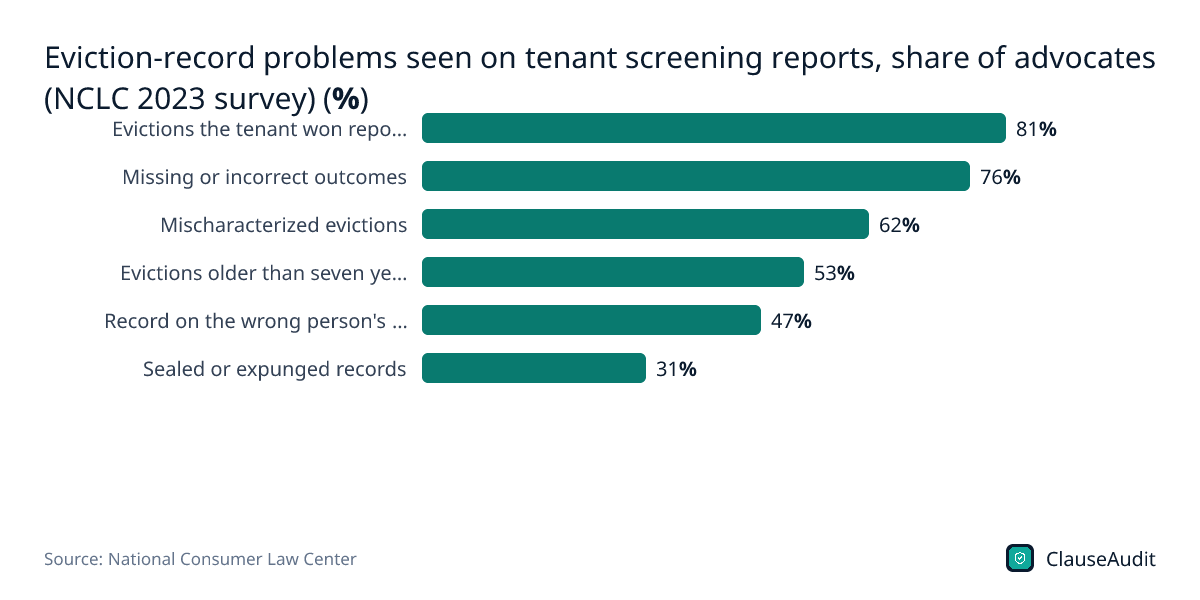
- 81% of advocates in NCLC's 2023 survey had seen screening reports list evictions that the tenant actually won. (National Consumer Law Center, Digital Denials: How Abuse, Bias, and Lack of Transparency in Tenant Screening Harm Renters, 2023)
- 76% of advocates in NCLC's 2023 survey had seen eviction records with missing or incorrect outcomes on tenant screening reports. (National Consumer Law Center, Digital Denials: How Abuse, Bias, and Lack of Transparency in Tenant Screening Harm Renters, 2023)
- 50% of advocates in NCLC's 2023 survey said private landlords rarely disclosed their screening criteria, and another 13% said they never did. (National Consumer Law Center, Digital Denials: How Abuse, Bias, and Lack of Transparency in Tenant Screening Harm Renters, 2023)
- 46% of advocates in NCLC's 2023 survey said private landlords rarely or never reviewed the underlying information in a tenant screening report. (National Consumer Law Center, Digital Denials: How Abuse, Bias, and Lack of Transparency in Tenant Screening Harm Renters, 2023)
- $2.25 million is what tenant screening firm RentGrow agreed to pay in July 2026 to settle FTC charges over duplicate criminal and eviction records. (Federal Trade Commission, RentGrow to Pay $2.25 Million to Settle FTC Allegations the Company Violated the Fair Credit Reporting Act and FTC Act, July 2026)
Figure 8: Eviction-record problems seen on tenant screening reports, share of advocates (NCLC 2023 survey) (%)
Chart data
| Label | Value |
|---|---|
| Evictions the tenant won reported | 81% |
| Missing or incorrect outcomes | 76% |
| Mischaracterized evictions | 62% |
| Evictions older than seven years | 53% |
| Record on the wrong person's report | 47% |
| Sealed or expunged records | 31% |
Eviction Statistics: Filings, Rates and Who Is Affected
There is no single national count of evictions, so these figures combine Eviction Lab's tracked sites, New York City court and marshal data, and academic estimates.
- 1.23 million eviction cases were filed in 2025 across the 38 city areas and 10 states in Eviction Lab's tracking system, down from 1.26 million in 2024. (The Eviction Lab, Princeton University, Preliminary Analysis: Eviction Filing Patterns in 2025, 2025)
- 8.0% was the average eviction filing rate across Eviction Lab's tracked sites in 2025, roughly one case for every 13 renter households. (The Eviction Lab, Princeton University, Preliminary Analysis: Eviction Filing Patterns in 2025, 2025)
- 39% of 2025 eviction filings in tracked sites named a Black defendant, although Black households made up 28% of renters there. (The Eviction Lab, Princeton University, Preliminary Analysis: Eviction Filing Patterns in 2025, 2025)
- 27% more eviction cases than normal were filed in Travis County, Texas, in 2025; filings were above average in 14 of 48 tracked sites. (The Eviction Lab, Princeton University, Preliminary Analysis: Eviction Filing Patterns in 2025, 2025)
- 5% was New York City's eviction filing rate in 2025, lower than most tracked sites despite high rents, which Eviction Lab links to strong renter protections. (The Eviction Lab, Princeton University, Preliminary Analysis: Eviction Filing Patterns in 2025, 2025)
- 100 buildings accounted for more than half of eviction filings in the Albuquerque and South Bend areas in 2025, showing how concentrated filings are. (The Eviction Lab, Princeton University, Preliminary Analysis: Eviction Filing Patterns in 2025, 2025)
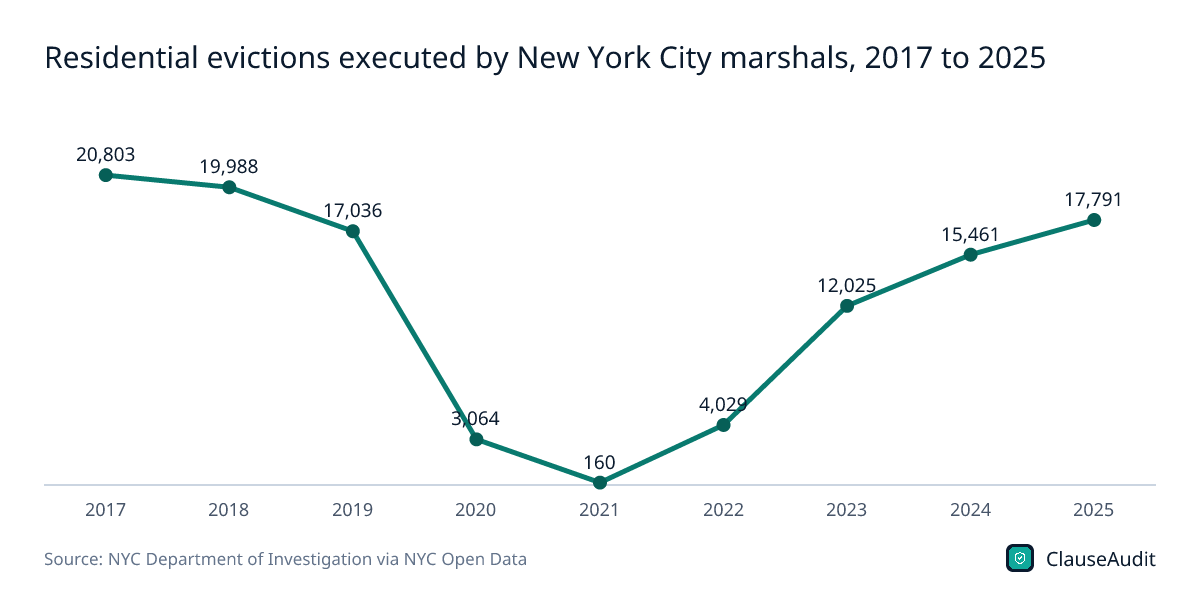
- 17,791 residential evictions were executed by New York City marshals in 2025, up from 160 in 2021 under the pandemic moratorium. (NYC Department of Investigation via NYC Open Data, Evictions dataset (executed evictions, 2017-present), residential records counted by executed year, 2025)
- 44% of tenants who appeared in NYC Housing Court eviction cases had full legal representation in Q4 FY2025, up from 30% when the program launched in 2017. (NYC Human Resources Administration, Office of Civil Justice, Office of Civil Justice Annual Report FY2025, FY2025)
- 22,700 New York City households received full legal representation in eviction proceedings in FY2025, a record high. (NYC Human Resources Administration, Office of Civil Justice, Office of Civil Justice Annual Report FY2025, FY2025)
- 2 million US households or more have an eviction case filed against them each year, according to an NBER working paper revised in 2023. (National Bureau of Economic Research, Eviction and Poverty in American Cities (NBER Working Paper 30382), 2023)
- 15.9% more women than men were evicted each year across 1,195 US counties in 2012 to 2016, an estimated 341,756 female renters. (Sociological Science (Hepburn, Louis and Desmond), Racial and Gender Disparities among Evicted Americans (Sociological Science 7: 649-662), 2012-2016)
- Over 30 million civil court case records filed since 2016, covering eviction, domestic violence, consumer debt and family law, have been collected by LSC's Civil Court Data Initiative. (Legal Services Corporation, About the Civil Court Data Initiative, 2016-2026)
Figure 9: Residential evictions executed by New York City marshals, 2017 to 2025
Chart data
| Label | Value |
|---|---|
| 2017 | 20,803 |
| 2018 | 19,988 |
| 2019 | 17,036 |
| 2020 | 3,064 |
| 2021 | 160 |
| 2022 | 4,029 |
| 2023 | 12,025 |
| 2024 | 15,461 |
| 2025 | 17,791 |
Renter Finances: Wealth, Savings and Renters Insurance Statistics
Renters hold far less wealth than homeowners and are more likely to fall behind on bills. This section covers net worth, income, missed payments and renters insurance coverage.
- $10,600 was the median net worth of renter and other non-homeowner families in 2025, down 7% from 2022 after inflation. (Board of Governors of the Federal Reserve System, Changes in U.S. Family Finances from 2022 to 2025: Evidence from the Survey of Consumer Finances, 2025)
- $458,900 was homeowners’ median net worth in 2025, about 43 times the renter median, after rising 6% since 2022. (Board of Governors of the Federal Reserve System, Changes in U.S. Family Finances from 2022 to 2025: Evidence from the Survey of Consumer Finances, 2025)
- $50,300 was the median pretax income in 2024 of renter and other non-homeowner families (2025 Survey of Consumer Finances), up 9% from 2021 in real terms. (Board of Governors of the Federal Reserve System, Changes in U.S. Family Finances from 2022 to 2025: Evidence from the Survey of Consumer Finances, 2024 (2025 SCF))
- 23% of US renters said they had been behind on rent at some point in the past year, per the Fed 2025 household survey. (Board of Governors of the Federal Reserve System, Economic Well-Being of U.S. Households in 2025: Housing, 2025)
- Nearly one-third of renters earning under $50,000 were behind on rent in 2025, compared with 5% of renters earning $100,000 or more. (Board of Governors of the Federal Reserve System, Economic Well-Being of U.S. Households in 2025: Housing, 2025)
- 18.9% of renters missed, partly paid or paid late on rent in the three months before July 2025, versus 4.8% of mortgage holders. (Federal Reserve Bank of Philadelphia, Under Pressure: Financial Stress and Housing Payments (LIFE Survey), July 2025)
- 35.3% of renters missed at least one debt payment over a three-month period in mid-2025, the highest rate of any housing group. (Federal Reserve Bank of Philadelphia, Under Pressure: Financial Stress and Housing Payments (LIFE Survey), July 2025)
- 6.4% of renters reported relocating because of housing costs, and more than one in five reported unexpected rent increases over the prior 12 months. (Federal Reserve Bank of Philadelphia, Under Pressure: Financial Stress and Housing Payments (LIFE Survey), July 2025)
- 49% of US renters held renters insurance in 2023, compared with 92% of homeowners who had homeowners insurance. (Financial Health Network, Climate Disaster and Renters Insurance: Who’s Protected?, 2023)
- 37% and 40% of Black and Latinx renters had renters insurance in 2023, well below the 57% of white renters with coverage. (Financial Health Network, Climate Disaster and Renters Insurance: Who’s Protected?, 2023)
- 61% of renters with renters insurance felt mostly or very well protected by their property insurance in 2026, compared with 79% of homeowners. (Financial Health Network, Financial Health Pulse 2026 U.S. Trends Report, 2026)
- 0.6% was the rise in the average HO-4 renters insurance premium from 2021 to 2022, versus an 11.26% jump for standard HO-3 homeowners policies. (National Association of Insurance Commissioners, NAIC Releases Homeowners Insurance Report (data for 2022), 2022)
- 6.4% of renters planned to take out a mortgage in the next six months in January 2026, down from around 13% in 2024. (Federal Reserve Bank of Philadelphia, Recent Trends in Renter Financial Security and Homebuying Intentions (LIFE Survey), January 2026)
| Measure | Homeowners 2022 | Homeowners 2025 | Renters or other 2022 | Renters or other 2025 |
|---|---|---|---|---|
| Median net worth | $433,600 | $458,900 | $11,400 | $10,600 |
| Mean net worth | $1,675,300 | $1,812,900 | $169,600 | $153,500 |
| Median income (2021 and 2024) | $102,900 | $108,900 | $46,300 | $50,300 |
| Mean income (2021 and 2024) | $194,800 | $184,600 | $78,500 | $70,300 |
Single-Family Rental and Landlord Ownership Statistics
Large investors own a small share of single-family rentals nationally but a much larger share in some metros. These figures come from GAO reports, company filings and Cotality data.
- 300,000 homes, nearly 2% of U.S. single-family rentals, were owned by the five largest investors at the end of 2022, by GAO's analysis. (U.S. Government Accountability Office, Rental Housing: Information on Institutional Investment in Single-Family Homes (GAO-24-106643), End of 2022)
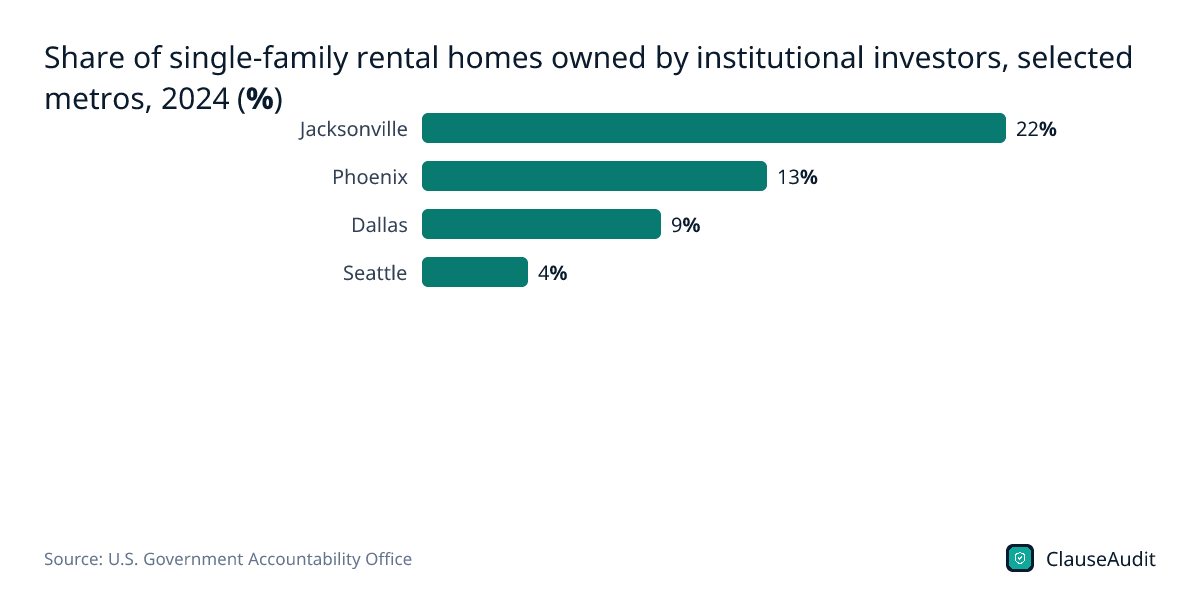
- 22 percent of Jacksonville's single-family rental homes were owned by institutional investors in 2024, up from 7% in 2018, the highest of six metros GAO studied. (U.S. Government Accountability Office, Rental Housing: Institutional Investor Ownership of Single-Family Rental Homes (GAO-26-108675), 2024)
- 3 percent or less of all single-family homes were owned by institutional investors in each of six high-investor metros GAO studied in 2024. (U.S. Government Accountability Office, Rental Housing: Institutional Investor Ownership of Single-Family Rental Homes (GAO-26-108675), 2024)
- 30,000 single-family homes were owned by institutional investors in each of the Dallas and Phoenix metros in 2024, more than double their 2018 holdings. (U.S. Government Accountability Office, Rental Housing: Institutional Investor Ownership of Single-Family Rental Homes (GAO-26-108675), 2024)
- 177 percent was the increase in institutional investor-owned single-family homes in Phoenix from 2018 to 2024; Dallas rose about 114%. (U.S. Government Accountability Office, Rental Housing: Institutional Investor Ownership of Single-Family Rental Homes (GAO-26-108675), 2018–2024)
- 86,192 single-family homes for lease were wholly owned by Invitation Homes at the end of 2025, plus 8,006 held in joint ventures. (Invitation Homes Inc. (SEC filing), Invitation Homes Inc. Form 10-K for fiscal year 2025, Dec 31, 2025)
- 61,479 single-family properties in 24 states were held by American Homes 4 Rent at the end of 2025. (American Homes 4 Rent (SEC filing), American Homes 4 Rent Form 10-K for fiscal year 2025, Dec 31, 2025)
- 20% more homes were bought than sold in the prior year by small investors owning under 10 properties, according to Cotality data published in May 2026. (Cotality, Small investors, big squeeze, 2025)
- 9% was the average discount cash buyers, mostly investors, secured over financed buyers in 2025, according to Cotality. (Cotality, Decoding the fine print: The Wall Street ban and the real estate reality, 2025)
Figure 11: Share of single-family rental homes owned by institutional investors, selected metros, 2024 (%)
Chart data
| Label | Value |
|---|---|
| Jacksonville | 22% |
| Phoenix | 13% |
| Dallas | 9% |
| Seattle | 4% |
Global Renter Statistics: Europe, OECD, UK and India
Renting is more common in parts of Europe than in the US and less common in India outside cities. These figures cover the EU, UK, Canada, Australia, Ireland, Norway, Switzerland and India, and definitions differ between countries.
- 31.5% of the EU-27 population lived as tenants in 2025, according to Eurostat survey data on housing tenure. (Eurostat, Distribution of population by tenure status, type of household and income group (ilc_lvho02), tenants, 2025, 2025)
- 52.8% of Germany's population lived as tenants in 2025, the highest share in the EU; Slovakia was lowest at 6.2%. (Eurostat, Distribution of population by tenure status, type of household and income group (ilc_lvho02), tenants, 2025, 2025)
- 19% of households in England rented privately in 2024-25, behind owner occupiers at 65% and ahead of social renters at 16%. (Ministry of Housing, Communities and Local Government (GOV.UK), English Housing Survey 2024 to 2025: headline findings on demographics and household resilience, introduction and key findings, 2024-25)
- 14% of English private renters whose tenancy ended in the past 12 months said it ended due to eviction. (Ministry of Housing, Communities and Local Government (GOV.UK), English Housing Survey 2024 to 2025: private rented sector, pre-Renters' Rights Act overview, 2024-25)
- £1,400 was the average UK monthly private rent in August 2026, up 3.8% in 12 months; England averaged £1,459. (Office for National Statistics, Private rent and house prices, UK: September 2026, August 2026)
- 33.1% of Canadian households rented at the 2021 Census, totalling 5.0 million renter households. (Statistics Canada, The Daily, To buy or to rent: The housing market continues to be reshaped by several factors as Canadians search for an affordable place to call home (2021 Census), 2021)
- 30.6% of occupied private dwellings in Australia were rented at the 2021 Census. (Australian Bureau of Statistics, Housing: Census, 2021, 2021)
- 3.6% was the rise in Australian rental prices in the 12 months to August 2026, unchanged since May 2026. (Australian Bureau of Statistics, Consumer Price Index, Australia, August 2026, August 2026)
- 513,704 rented occupied dwellings were counted in Ireland's 2022 Census, up 9% since 2016. (Central Statistics Office (Ireland), Census of Population 2022 Profile 2: Housing in Ireland, 2022)
- 32.8% of urban Indian households lived in hired (rented) dwellings in 2018, against 13.1% of all households and 2.8% in rural areas. (National Statistical Office, Ministry of Statistics and Programme Implementation, Government of India, NSS Report No. 584: Drinking Water, Sanitation, Hygiene and Housing Condition in India (NSS 76th round, July-December 2018), 2018)
- 23.1% of urban Indian households rented without a written contract in 2018, compared with 6.3% that rented with a written contract. (National Statistical Office, Ministry of Statistics and Programme Implementation, Government of India, NSS Report No. 584: Drinking Water, Sanitation, Hygiene and Housing Condition in India (NSS 76th round, July-December 2018), 2018)
- Rs 3,306 was the average monthly rent paid by urban Indian households in hired dwellings in 2018, versus Rs 1,424 in rural areas. (National Statistical Office, Ministry of Statistics and Programme Implementation, Government of India, NSS Report No. 584: Drinking Water, Sanitation, Hygiene and Housing Condition in India (NSS 76th round, July-December 2018), 2018)
- 3.1% was the average purpose-built rental vacancy rate in Canada's major centres in 2025, up from 2.2% in 2024; two-bedroom rents rose 5.1%. (Canada Mortgage and Housing Corporation, Rental Market Report 2025, 2025)
- 27.8% of income was spent on rent by Germany's roughly 19.9 million main tenant households in 2022. (Federal Statistical Office of Germany (Destatis), Housing: rent burden of main tenant households, 2022)
- 36.3% of private-renter household income went on rent in England in the year to March 2024; London was least affordable at 41.6%. (Office for National Statistics, Private rental affordability, England: 2024, FYE 2024)
- 27.3% of Norwegian households were tenants in 2025, 713,623 households in all, down from 27.4% in 2024. (Statistics Norway, Housing conditions, register-based, 2025)
- 57% of Swiss households rent at market rate, the highest share in the OECD tenure data (2022 or latest year), ahead of Germany at 52%. (OECD, OECD Affordable Housing Database, indicator HM1.3 Housing tenures, 2022 or latest)
- 18.6% of EU tenants renting at market price spent over 40% of disposable income on housing in 2025, versus 7.7% of the whole population. (Eurostat, Housing cost overburden rate by tenure status (ilc_lvho07c), 2025)
Figure 12: Share of population living as tenants in selected EU countries, 2025 (%)
Chart data
| Label | Value |
|---|---|
| Germany | 52.8% |
| Austria | 45.8% |
| Denmark | 41.6% |
| France | 38.6% |
| Sweden | 35.4% |
| EU-27 | 31.5% |
| Netherlands | 31.2% |
| Ireland | 29.1% |
| Spain | 26.4% |
| Italy | 22.9% |
| Poland | 12.8% |
| Hungary | 10.2% |
| Romania | 6.8% |
| Slovakia | 6.2% |
What the numbers mean for renters
Homeownership has slipped and buying has become harder to afford. The homeownership rate was 65.0% in Q2 2026, a point below the 66.0% reached in Q1 and Q3 2023, and only 37% of renter households younger than 40 could afford the monthly cost of owning in 2024, down from 56% in 2019. The wealth gap is wide: median net worth was $10,600 for renter and other non-homeowner families in 2025, against $458,900 for homeowners.
Rent growth has cooled, which may give renters some room to negotiate. The CPI rent index rose 2.8% in the year to September 2026, down from 7.4% in 2023, and 43.9% of studio to two-bedroom listings in the 50 largest metros offered a concession in September 2026. Large landlords still push harder on renewals than on new leases. MAA raised renewal rents 5.2% in Q2 2026 while its new lease rates fell 5.3%. If you are renewing, compare the offer with current asking rents for similar units nearby, and ask for the same concessions new tenants get.
Fees, deposits and screening add costs the rent does not show
The monthly rent is not the full price of a lease. In NCLC's 2022 survey, 89% of tenant attorneys had seen landlords charge application fees and 87% had seen excessive late fees. The FTC alleged that Invitation Homes leases could carry more than $1,700 a year in mandatory fees, and that the company returned 39.2% of security deposit dollars in 2020 to 2022, against a national average of 63.9%. The company agreed to $48 million in refunds in 2024, and Greystar agreed to pay $24 million in December 2025 over hidden mandatory fees.
Some states set limits that a lease cannot override. New York caps security deposits at one month's rent for covered units and late fees at $50 or 5% of monthly rent, whichever is less. New Jersey allows up to 1.5 times one month's rent as a deposit, and Minnesota limits late fees to 8% of the overdue payment. Before you sign, list every fee in the lease, add them to the monthly rent, and check the deposit and late fee against your state's rules.
Screening errors can block the next lease. The CFPB received 26,700 tenant screening complaints from January 2019 to September 2022, and 17,240 of them concerned incorrect information. Ask the landlord for its screening criteria in writing, and keep records of any eviction case you won or settled.
Missed rent, evictions and insurance
Falling behind is common. In the Federal Reserve's 2025 survey, 23% of renters said they had been behind on rent at some point in the past year, and nearly one-third of renters earning under $50,000 had been. Eviction Lab counted 1.23 million eviction filings in 2025 across its tracked sites. Read the default clause, the notice and cure period, and whether the lease adds attorney fees or other charges on top of overdue rent, since those terms decide how fast a missed payment becomes a court case.
Insurance is a gap many renters leave open: 49% of renters held renters insurance in 2023, compared with 92% of homeowners. If the lease requires a policy, check the minimum coverage and whether the landlord must be listed on it. For small landlords and property managers, the same data points the other way. Clear fee disclosure, deposits returned within state deadlines, such as 30 days in Washington, and written screening criteria all lower the risk of disputes and enforcement action.
Check your lease before you sign
Leases often run several pages, and the costly terms sit in the fee schedule, the deposit section and the default clause. An automated review reads your lease, flags the clauses behind the risks on this page, and explains each one in plain English with a suggested change to ask for.
- Security deposit amount, deductions and return deadline
- Late fees, grace periods and when they start
- Application, admin, convenience and other mandatory fees
- Rent increases on renewal and automatic renewal notice periods
- Landlord entry notice and access rules
- Repair and maintenance duties, including appliances
- Early termination and lease-breaking penalties
- Subletting, assignment and guest restrictions
- Default, notice to cure and attorney fee clauses
- Waivers of habitability or other rights that state law may void
- Renters insurance requirements and liability terms
Frequently asked questions
How many renters are there in the US?
The Census Bureau counted 46.8 million renter-occupied housing units in Q2 2026. The homeownership rate was 65.0%, so about 35% of occupied US homes were rented.
What percentage of renters are cost burdened?
In 2024, 22.7 million renter households, or 49.4% of renters, spent more than 30% of income on housing, according to the Congressional Research Service. Of all renter households, 26.2% were severely burdened, paying more than half of their income.
How much has rent gone up in 2026?
The BLS rent of primary residence index rose 2.8% in the 12 months to September 2026. Zillow put the typical US monthly rent at $1,932 in September 2026, up 2.7% from a year earlier.
How much do you need to earn to afford rent?
NLIHC's 2026 Housing Wage is $34.73 an hour for a modest two-bedroom rental at fair market rent, while the average renter earns $24.84 an hour. Zillow estimated in September 2026 that a household needs $77,278 a year to afford the typical US rental.
How many evictions are filed each year?
Eviction Lab counted 1.23 million eviction cases in 2025 across the 38 city areas and 10 states it tracks, down from 1.26 million in 2024. An NBER working paper estimates 2 million or more US households face an eviction filing each year.
What is the rental vacancy rate in 2026?
The US rental vacancy rate was 7.3% in Q2 2026, according to the Census Bureau, not statistically different from 7.0% a year earlier. The South had the highest regional rate at 9.5%.
How many renters have renters insurance?
About half of US renters (49%) had renters insurance in 2023, compared with 92% of homeowners who had homeowners insurance, according to the Financial Health Network.
Use this data
Every chart and card below is free to reuse under CC BY 4.0. Download what you need and link back to this page.
 Stat cards
 Key findings card
 Infographic
 US homeownership rate by quarter, 2023 to Q2 2026 (%)
 Hourly wage needed to afford a two-bedroom rental, 2026: highest states vs US (USD per hour)
 Share of tenant attorneys who saw each rental junk fee (NCLC survey, 2022) (%)
 Share of U.S. adults who rent, by age, 2025 (%)
 U.S. rental vacancy rate, second quarter of each year, 2020–2026 (%)
 Eviction-record problems seen on tenant screening reports, share of advocates (NCLC 2023 survey) (%)
 Share of single-family rental homes owned by institutional investors, selected metros, 2024 (%)
 US rent of primary residence CPI, 12-month change each September, 2020 to 2026 (%)
 Residential evictions executed by New York City marshals, 2017 to 2025
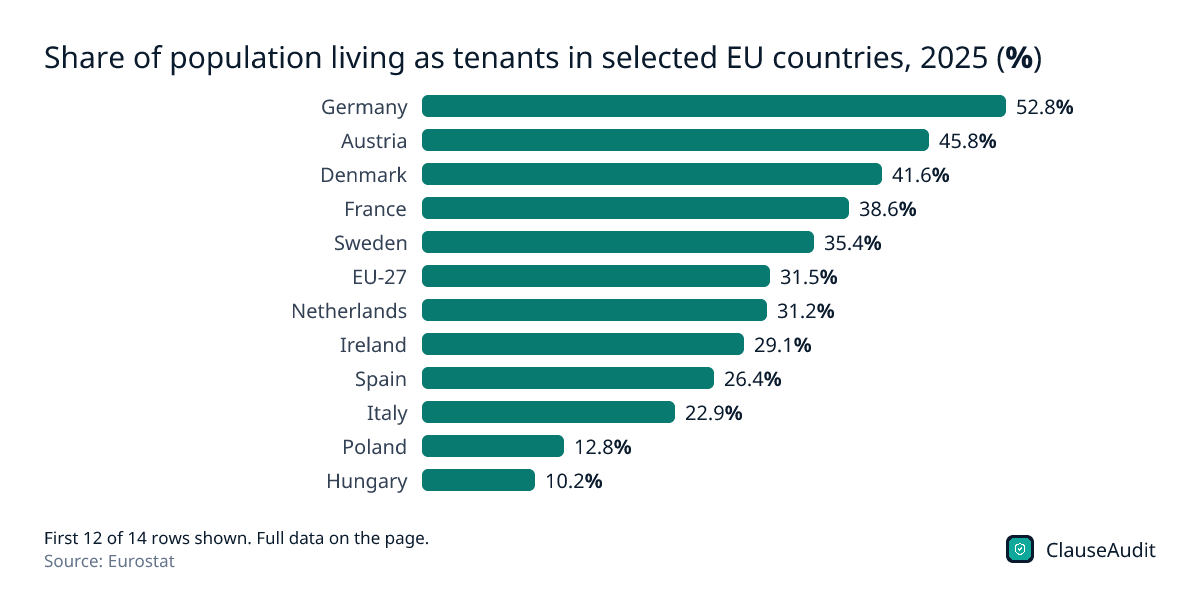 Share of population living as tenants in selected EU countries, 2025 (%)
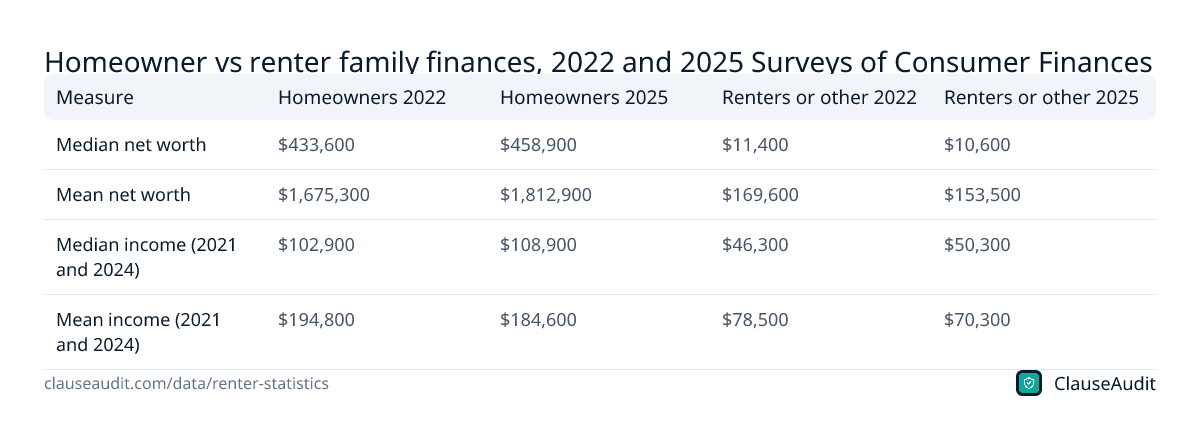 Homeowner vs renter family finances, 2022 and 2025 Surveys of Consumer Finances (2025 dollars; income is for the year before each survey)
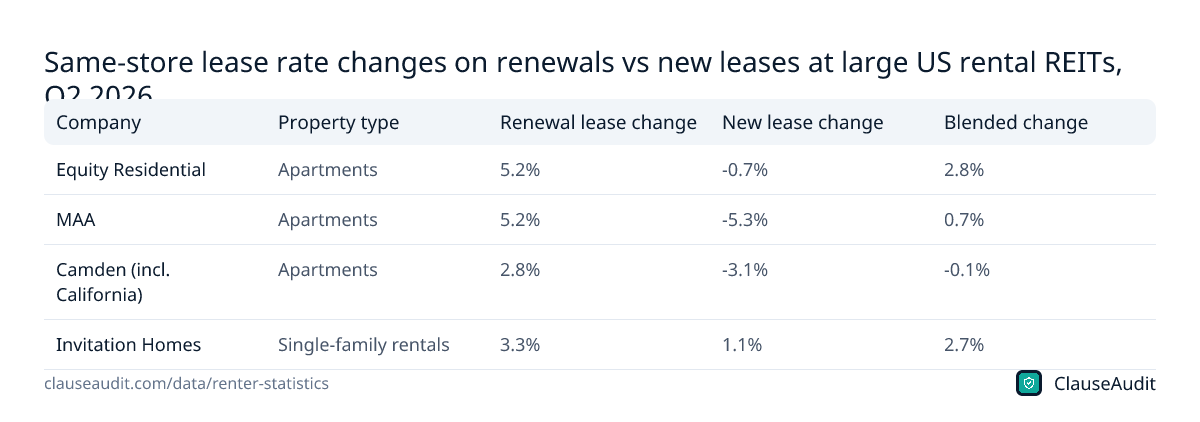 Same-store lease rate changes on renewals vs new leases at large US rental REITs, Q2 2026
Embed the infographic
Free to share on your site, blog or slides under CC BY 4.0. Please keep the credit link.
Sources and method
Every number on this page comes from the sources below, each opened and read on or before October 17, 2026. A second, independent review checked every figure against its source and corrected anything that did not match. Figures that could not be confirmed were left out.
- U.S. Census Bureau, Quarterly Residential Vacancies and Homeownership, Second Quarter 2026 (July 28, 2026)
- U.S. Bureau of Labor Statistics, Consumer Expenditure Surveys, 2024: Table 1710, Housing tenure (2024 annual tables)
- Board of Governors of the Federal Reserve System, Changes in U.S. Family Finances from 2022 to 2025: Evidence from the Survey of Consumer Finances (October 2026)
- Board of Governors of the Federal Reserve System, Economic Well-Being of U.S. Households in 2025: Housing (May 2026)
- Zillow, Rental demand is up 20% as high lending costs stifle the for-sale market (October 15, 2026)
- Congressional Research Service, Housing Cost Burdens in 2024: In Brief (R48945) (May 13, 2026)
- National Low Income Housing Coalition, NLIHC Releases Out of Reach 2026: The High Cost of Housing (July 23, 2026)
- National Low Income Housing Coalition, Out of Reach 2026 (2026 edition)
- National Low Income Housing Coalition, The Gap: A Shortage of Affordable Homes (2026) (2026 edition)
- Redfin, Homebuyers Need to Earn $35,000 More Than Renters to Afford Monthly Payments, the Smallest Gap in 3 Years (February 11, 2026)
- Federal Reserve Bank of Philadelphia, Under Pressure: Financial Stress and Housing Payments (LIFE Survey) (September 2025)
- National Consumer Law Center, Too Damn High: How Junk Fees Add to Skyrocketing Rents (March 13, 2023)
- New York State Senate, New York General Obligations Law § 7-108 (security deposits) (Current text, accessed October 2026)
- New York State Senate, New York Real Property Law § 238-A (fees and charges) (Current text, accessed October 2026)
- New Jersey Department of Community Affairs, Truth in Renting: A guide to the rights and responsibilities of residential tenants and landlords in New Jersey (Current edition, accessed October 2026)
- Minnesota Office of the Revisor of Statutes, Minnesota Statutes § 504B.177 (late fees) (Current text, accessed October 2026)
- Washington State Legislature, RCW 59.18.280 (return of deposits) (Current text, accessed October 2026)
- Financial Health Network, Climate Disaster and Renters Insurance: Who’s Protected? (December 9, 2024)
- National Association of Insurance Commissioners, NAIC Releases Homeowners Insurance Report (data for 2022) (May 21, 2025)
- Federal Trade Commission, FTC Takes Action Against Invitation Homes for Deceiving Renters, Charging Junk Fees, Withholding Security Deposits (September 24, 2024)
- Federal Trade Commission, Greystar Agrees to Pay $24 Million and Stop Deceptive Advertising Practices (December 2, 2025)
- Florida Legislature, Florida Statutes § 83.49 (deposit money or advance rent) (2026 Florida Statutes)
- U.S. Census Bureau, Quarterly Residential Vacancies and Homeownership, Second Quarter 2026 (Release CB26-116) (July 28, 2026)
- Pew Research Center, Buying a home has gotten harder for young adults in most U.S. metro areas (June 24, 2026)
- RealPage Analytics, Supply Update 2nd Quarter 2026 (July 16, 2026)
- CBRE, U.S. Multifamily Fundamentals Improve in Q2 2026 as Demand Outpaces New Supply (August 12, 2026)
- Consumer Financial Protection Bureau, Consumer Snapshot: Tenant Background Checks (November 2022)
- Consumer Financial Protection Bureau, Enforcement action: TransUnion Rental Screening Solutions, Inc. and Trans Union LLC (October 2023)
- National Consumer Law Center, Digital Denials: How Abuse, Bias, and Lack of Transparency in Tenant Screening Harm Renters (September 2023)
- U.S. Government Accountability Office, Rental Housing: Information on Institutional Investment in Single-Family Homes (GAO-24-106643) (May 22, 2024)
- U.S. Government Accountability Office, Rental Housing: Institutional Investor Ownership of Single-Family Rental Homes (GAO-26-108675) (March 24, 2026)
- Invitation Homes Inc. (SEC filing), Invitation Homes Inc. Form 10-K for fiscal year 2025 (February 19, 2026)
- American Homes 4 Rent (SEC filing), American Homes 4 Rent Form 10-K for fiscal year 2025 (February 20, 2026)
- Cotality, Small investors, big squeeze (May 26, 2026)
- Cotality, Decoding the fine print: The Wall Street ban and the real estate reality (February 24, 2026)
- U.S. Census Bureau and U.S. Department of Housing and Urban Development, Quarterly Starts and Completions by Purpose and Design (New Residential Construction) (August 18, 2026)
- Federal Trade Commission, RentGrow to Pay $2.25 Million to Settle FTC Allegations the Company Violated the Fair Credit Reporting Act and FTC Act (July 9, 2026)
- U.S. Bureau of Labor Statistics, Consumer Price Index News Release, September 2026 (14 October 2026 (September 2026 data))
- U.S. Bureau of Labor Statistics, CPI Table 1: Consumer Price Index for All Urban Consumers, U.S. city average, September 2026 (14 October 2026 (September 2026 data))
- U.S. Bureau of Labor Statistics, Public Data API, CPI-U Rent of primary residence, U.S. city average, not seasonally adjusted (series CUUR0000SEHA) (Data through September 2026)
- Zillow Group, Rents near $2,000, rising at the fastest pace in over a year (Zillow Rental Market Report, July 2026) (August 2026 (July 2026 data))
- Redfin, Homebuyers Need to Earn $35,000 More Than Renters to Afford Monthly Payments (11 February 2026 (December 2025 data))
- Equity Residential via SEC EDGAR, Equity Residential Reports Second Quarter 2026 Results (Form 8-K, Exhibit 99.1) (July 2026 (Q2 2026 results))
- Mid-America Apartment Communities via SEC EDGAR, MAA Reports Second Quarter 2026 Results (Form 8-K, Exhibit 99.1) (29 July 2026)
- Camden Property Trust, Camden Property Trust Announces Second Quarter 2026 Operating Results (30 July 2026)
- Invitation Homes, Invitation Homes Q2 2026 Earnings Release and Supplemental Information (29 July 2026)
- U.S. Census Bureau, Table A-4. Annual Geographic Mobility by Tenure: 1988-2023 (CPS ASEC) (2023 CPS ASEC data)
- U.S. Census Bureau, Table A-5. Annual Reason for Move (Collapsed and Specific Categories): 1999-2023 (CPS ASEC) (2023 CPS ASEC data)
- The Eviction Lab, Princeton University, Preliminary Analysis: Eviction Filing Patterns in 2025 (16 April 2026)
- NYC Department of Investigation via NYC Open Data, Evictions dataset (executed evictions, 2017-present), residential records counted by executed year (Queried 18 October 2026)
- NYC Human Resources Administration, Office of Civil Justice, Office of Civil Justice Annual Report FY2025 (FY2025 report)
- National Bureau of Economic Research, Eviction and Poverty in American Cities (NBER Working Paper 30382) (August 2022, revised July 2023)
- Sociological Science (Hepburn, Louis and Desmond), Racial and Gender Disparities among Evicted Americans (Sociological Science 7: 649-662) (December 2020 (2012-2016 data))
- Legal Services Corporation, About the Civil Court Data Initiative (Accessed 18 October 2026)
- Eurostat, Distribution of population by tenure status, type of household and income group (ilc_lvho02), tenants, 2025 (Updated 17 September 2026)
- Ministry of Housing, Communities and Local Government (GOV.UK), English Housing Survey 2024 to 2025: headline findings on demographics and household resilience, introduction and key findings (Updated 9 July 2026)
- Ministry of Housing, Communities and Local Government (GOV.UK), English Housing Survey 2024 to 2025: private rented sector, pre-Renters' Rights Act overview (Updated 30 September 2026)
- Office for National Statistics, Private rent and house prices, UK: September 2026 (16 September 2026)
- Statistics Canada, The Daily, To buy or to rent: The housing market continues to be reshaped by several factors as Canadians search for an affordable place to call home (2021 Census) (21 September 2022)
- Australian Bureau of Statistics, Housing: Census, 2021 (2021 Census release)
- Australian Bureau of Statistics, Consumer Price Index, Australia, August 2026 (30 September 2026)
- Central Statistics Office (Ireland), Census of Population 2022 Profile 2: Housing in Ireland (Census 2022 profile)
- National Statistical Office, Ministry of Statistics and Programme Implementation, Government of India, NSS Report No. 584: Drinking Water, Sanitation, Hygiene and Housing Condition in India (NSS 76th round, July-December 2018) (November 2019 (2018 survey data))
- Federal Reserve Bank of New York, SCE Housing Survey 2026 (2026 survey (fielded February 2026))
- U.S. Department of Justice, Justice Department Requires RealPage to End the Sharing of Competitively Sensitive Information (November 24, 2025)
- Federal Reserve Bank of Philadelphia, Recent Trends in Renter Financial Security and Homebuying Intentions (LIFE Survey) (June 2026)
- U.S. Census Bureau and HUD, Monthly New Residential Construction, August 2026 (CB26-147) (September 17, 2026)
- National Association of Home Builders (Eye on Housing), Weaker Conditions for Single-Family Built-for-Rent Housing (March 12, 2026)
- AppFolio, What Renters Want After Free Rent Concessions End (survey of 3,002 U.S. renters) (September 17, 2026)
- National Low Income Housing Coalition, NLIHC Releases Findings from 2025 National Renter Survey (June 2026)
- Canada Mortgage and Housing Corporation, Rental Market Report 2025 (2025 edition (October 2025 survey))
- Federal Statistical Office of Germany (Destatis), Housing: rent burden of main tenant households (Accessed October 2026 (2022 data))
- Office for National Statistics, Private rental affordability, England: 2024 (18 August 2025)
- Statistics Norway, Housing conditions, register-based (14 September 2026)
- OECD, OECD Affordable Housing Database, indicator HM1.3 Housing tenures (Last updated 16 April 2024)
- Eurostat, Housing cost overburden rate by tenure status (ilc_lvho07c) (Updated 16 October 2026)
- Realtor.com (via PR Newswire), Rents Rebound in AI Hubs and Affordable Alternatives: Realtor.com September Rent Report (October 15, 2026)
- Cotality, Annual Single-Family Rent Growth Accelerated for the Sixth Consecutive Month (October 15, 2026)
- RealPage, 3Q 2026 U.S. Data Update (October 6, 2026)
- Cushman & Wakefield, U.S. Multifamily MarketBeat, Q3 2026 (October 8, 2026)
- FICO (Joanne Gaskin), Leveraging Alternative Data to Extend Credit to More Borrowers (May 22, 2019)
- Financial Health Network, Financial Health Pulse 2026 U.S. Trends Report (September 22, 2026)
Cite this page
ClauseAudit, “Renter Statistics 2026: 160+ Numbers on Rent, Affordability, Fees, Screening and Evictions”, updated October 17, 2026, https://clauseaudit.com/data/renter-statistics. Free to reuse with a link back (CC BY 4.0).
This page summarises published data and law as checked on October 17, 2026. Figures are updated as new editions are released, and your own situation may differ. It is general information, not legal, tax or financial advice.