Eviction Statistics 2026: Filings, Rates and Who Gets Evicted in the US
By ClauseAudit Research · 4 sources ·
What do the latest eviction statistics show?
Evictions are still common in the US. Landlords filed 1.23 million eviction cases in 2025 across the 48 sites Eviction Lab tracks, which hold about one-third of renter households. That is an 8.0% filing rate, or roughly one case for every 13 renter households. The latest national estimate is 3.6 million filings in 2018.
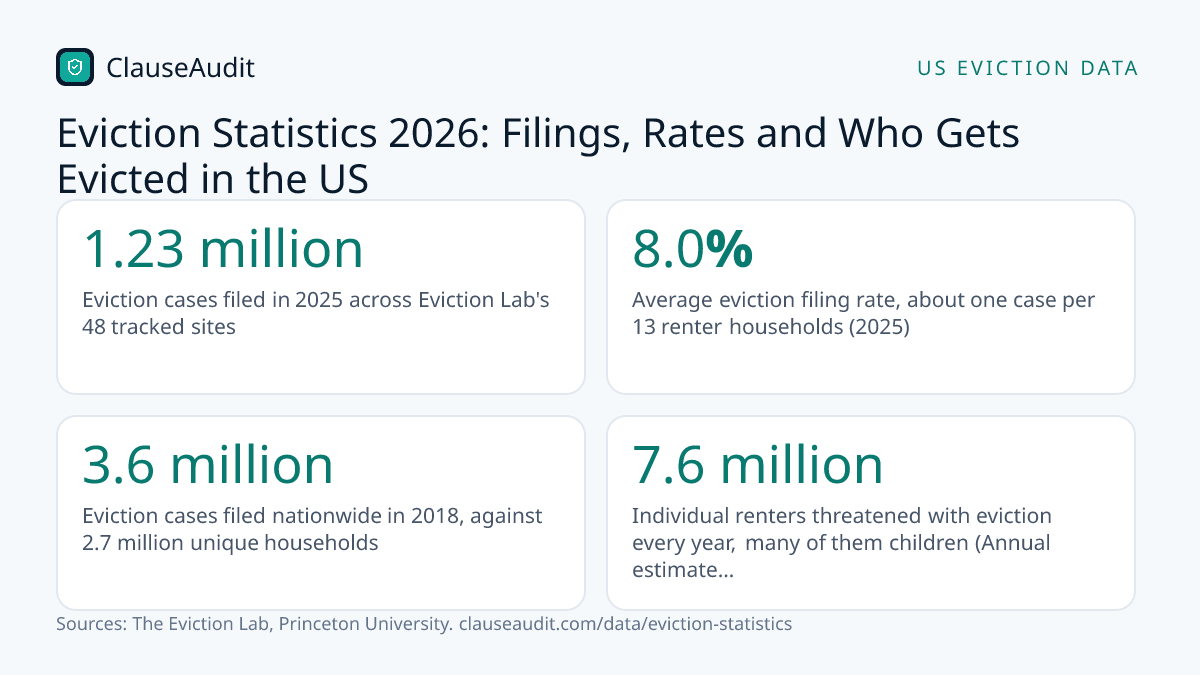
- Eviction cases filed in 2025 across Eviction Lab's 48 tracked sites (2025, The Eviction Lab, Princeton University)
- 1.23 million
- Average eviction filing rate, about one case per 13 renter households (2025, The Eviction Lab, Princeton University)
- 8.0%
- Eviction cases filed nationwide in 2018, against 2.7 million unique households (2018, The Eviction Lab, Princeton University)
- 3.6 million
- Individual renters threatened with eviction every year, many of them children (Annual estimate (2000-2018 data), The Eviction Lab, Princeton University)
- 7.6 million
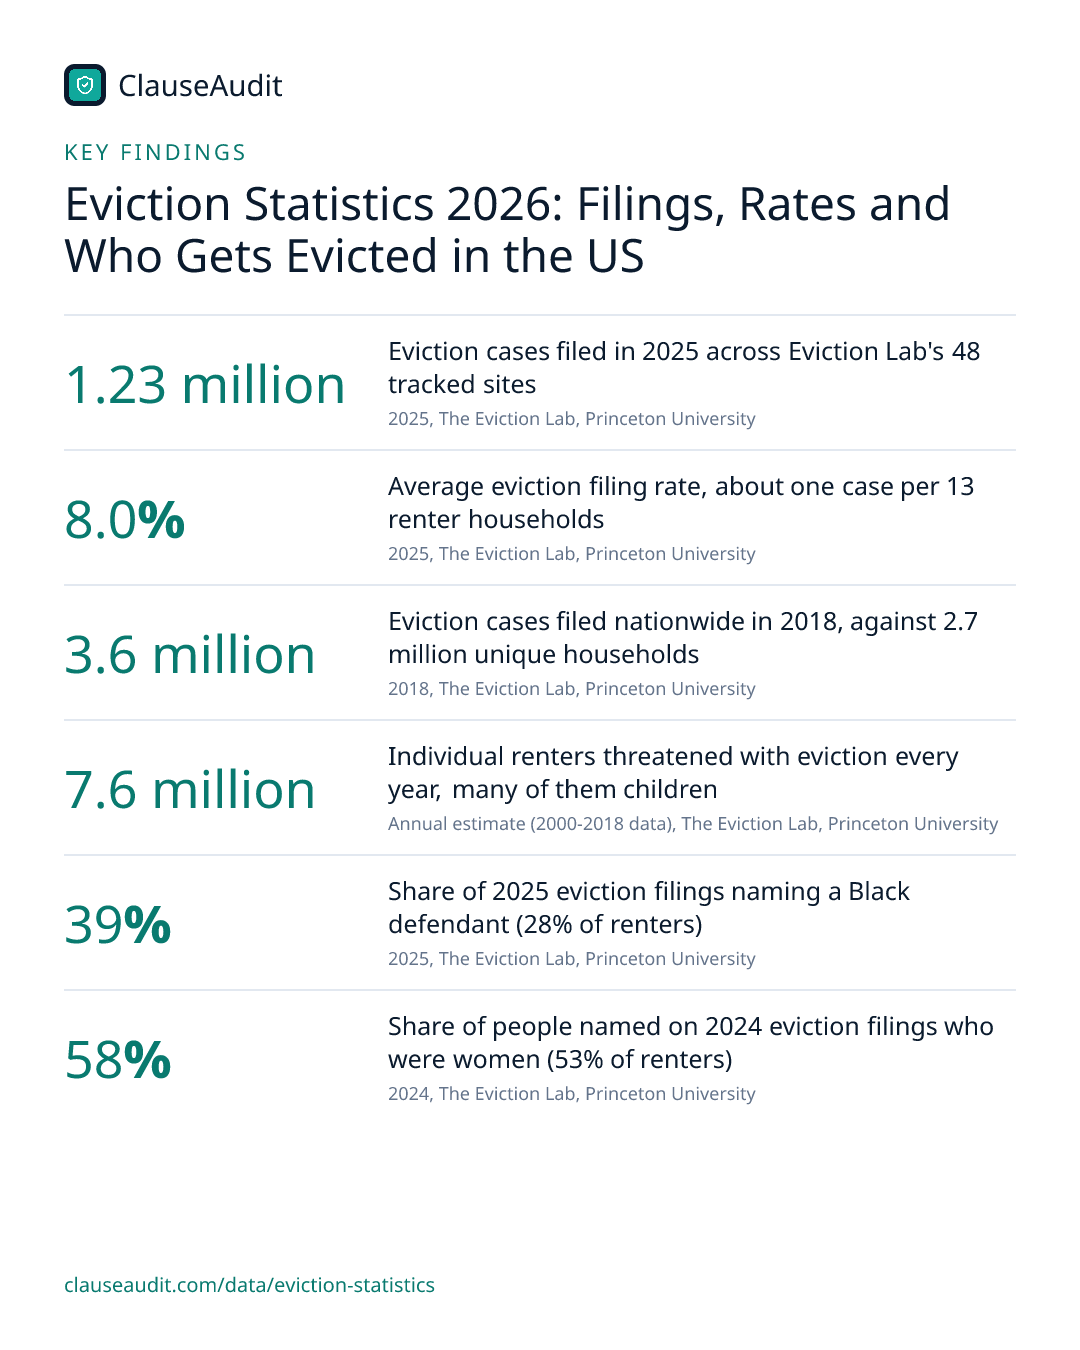
- Share of 2025 eviction filings naming a Black defendant (28% of renters) (2025, The Eviction Lab, Princeton University)
- 39%
- Share of people named on 2024 eviction filings who were women (53% of renters) (2024, The Eviction Lab, Princeton University)
- 58%
- How far 2025 eviction filings fell below the 2023-2024 average (2025, The Eviction Lab, Princeton University)
- 3.2%
An eviction case usually starts with a missed rent payment and a court filing, and it moves faster than most renters expect. In 2025, landlords filed 1.23 million cases in the areas Eviction Lab at Princeton tracks. That is down a little from 1.26 million in 2024, but it still means about one filing for every 13 renter households.
This page pulls together the most recent figures: how many cases get filed, which cities file the most, who ends up named on the paperwork, and whether the trend is rising or falling. Further down you will find what the numbers mean for your own lease and what to check before you sign one.
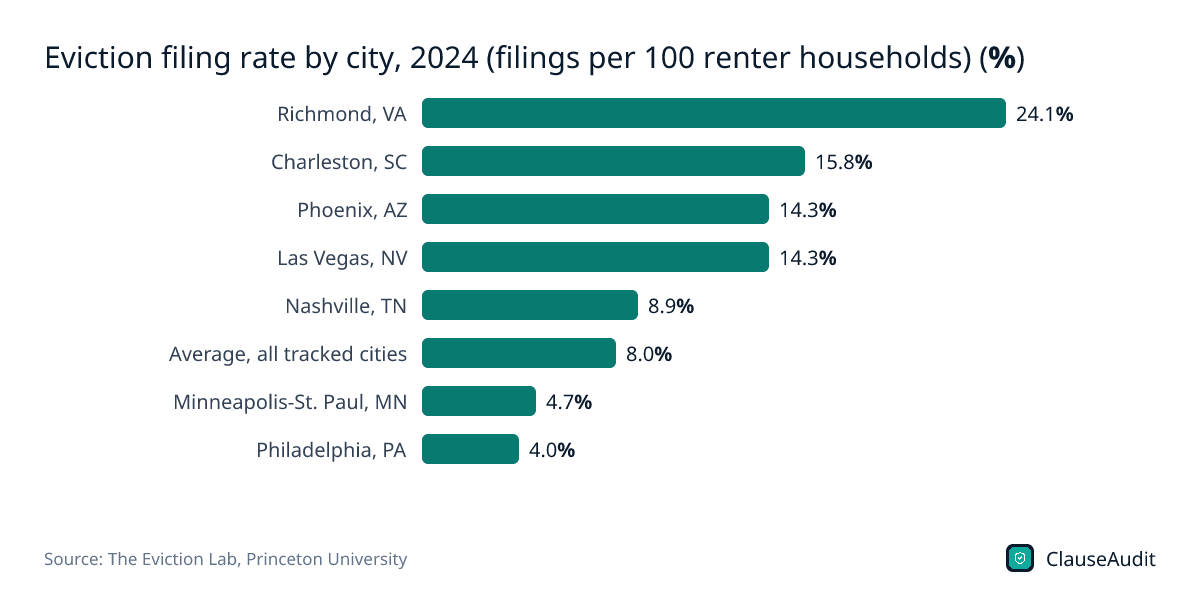
Eviction filing rate by city, 2024 (filings per 100 renter households) (%)
Chart data
| Label | Value |
|---|---|
| Richmond, VA | 24.1% |
| Charleston, SC | 15.8% |
| Phoenix, AZ | 14.3% |
| Las Vegas, NV | 14.3% |
| Nashville, TN | 8.9% |
| Average, all tracked cities | 8.0% |
| Minneapolis-St. Paul, MN | 4.7% |
| Philadelphia, PA | 4.0% |
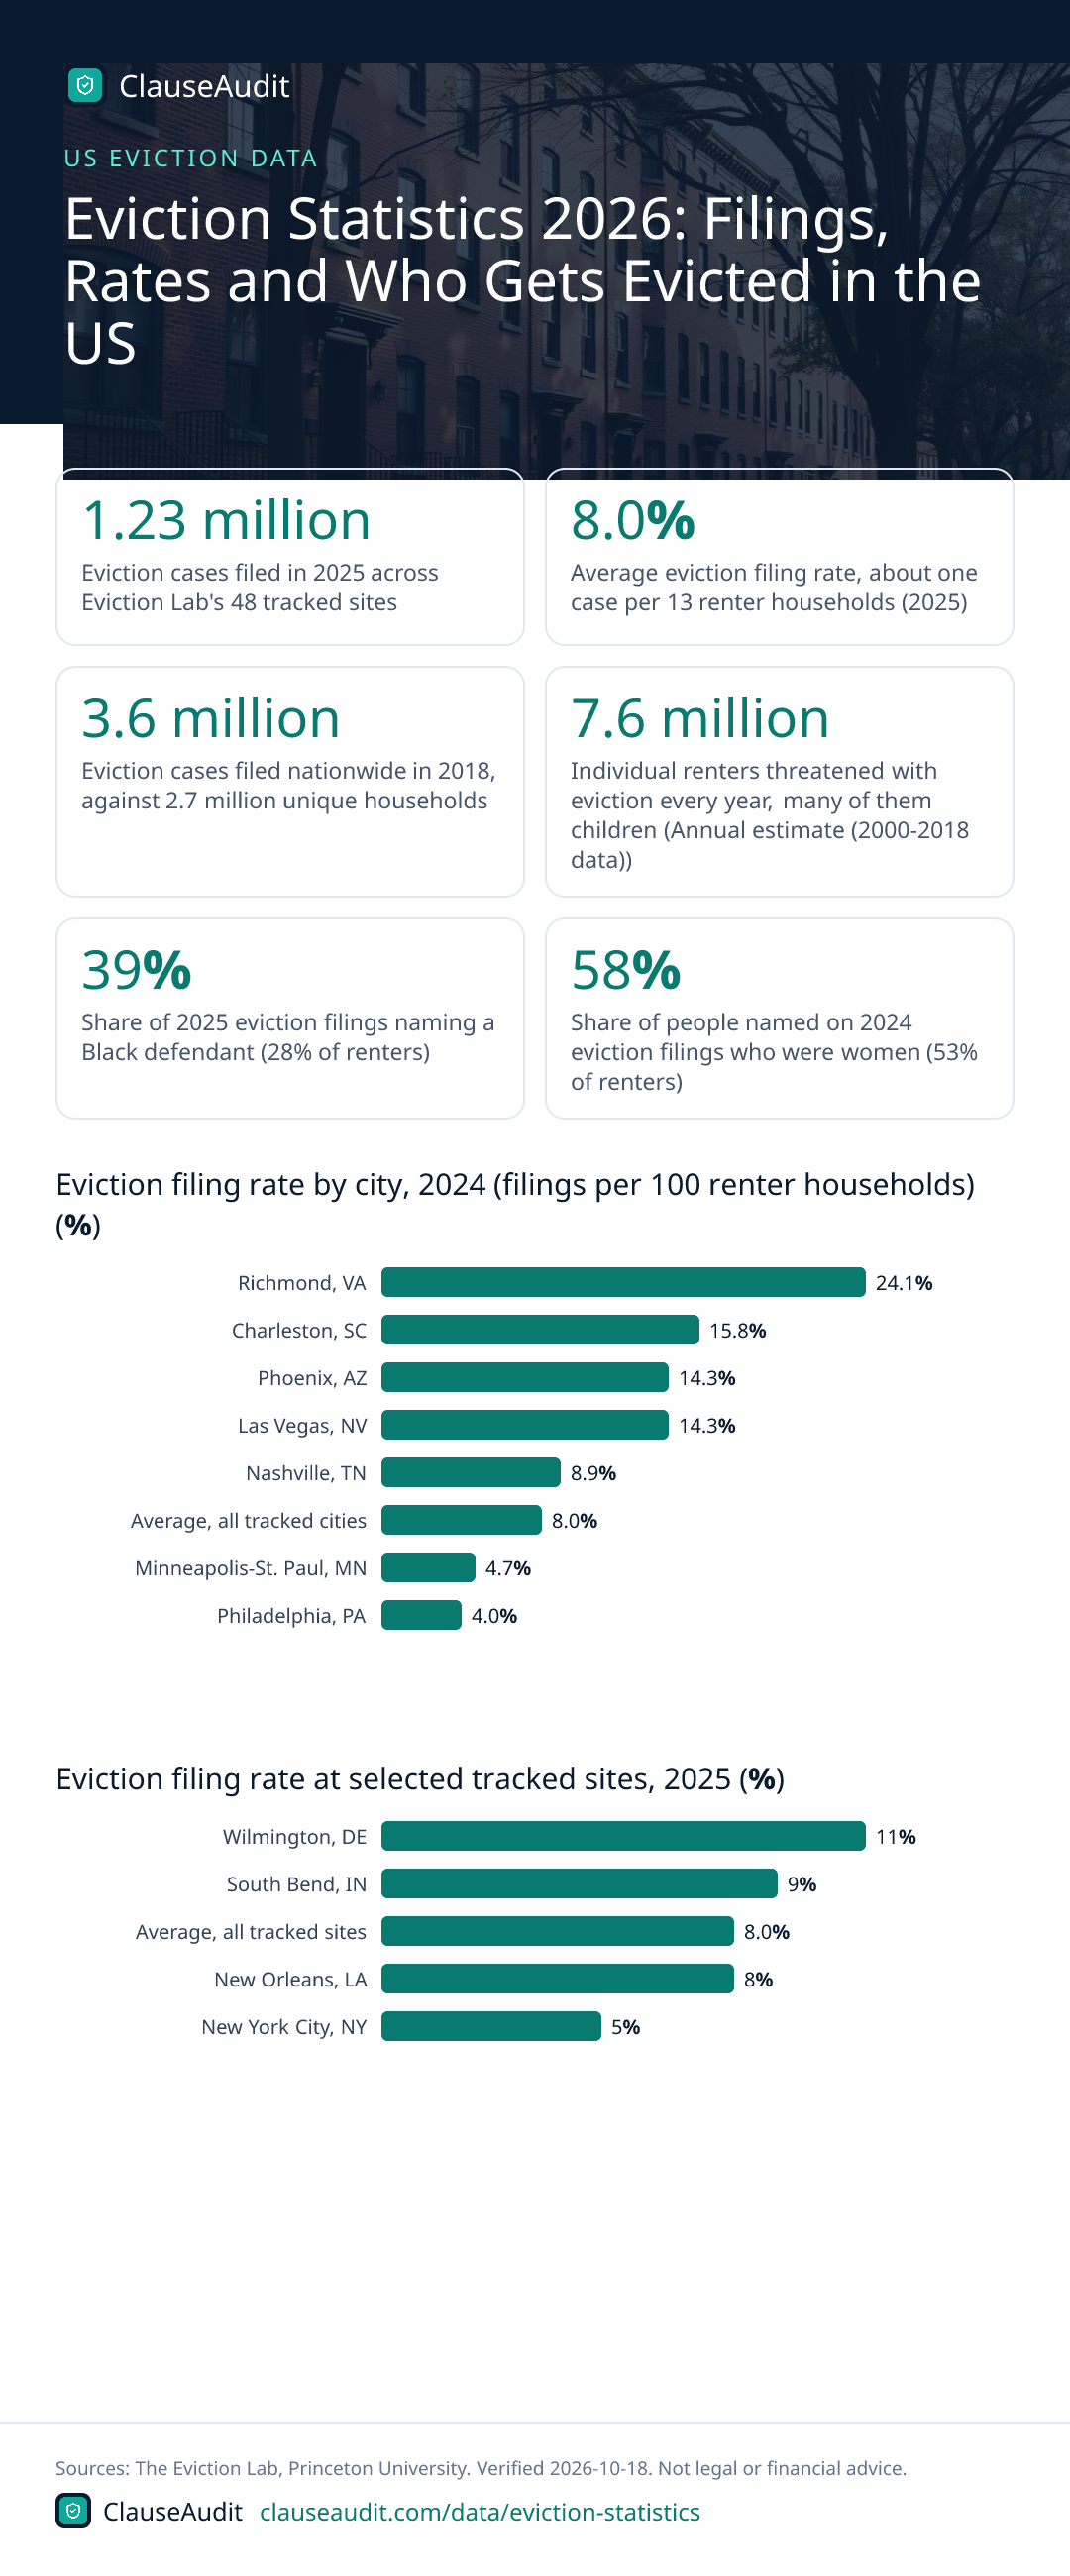
Richmond's rate of 24.1% sits far above the tracked-city average of 8.0%. Philadelphia and Minneapolis-St. Paul sit far below it, so where you rent changes the odds a lot.
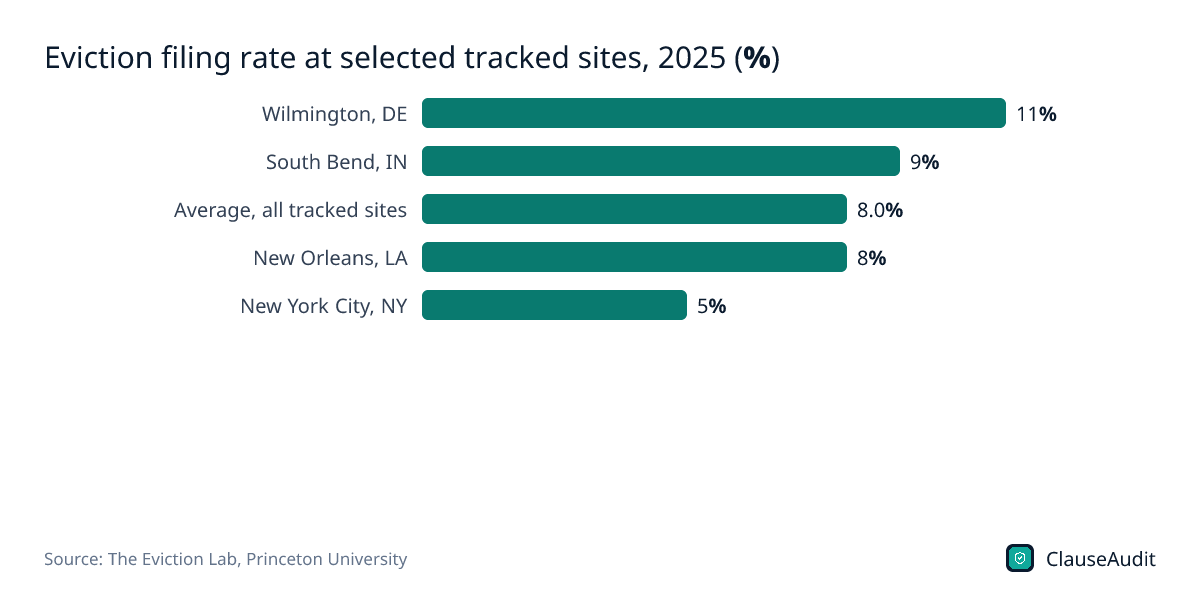
Download this chart (PNG)Eviction filing rate at selected tracked sites, 2025 (%)
Chart data
| Label | Value |
|---|---|
| Wilmington, DE | 11% |
| South Bend, IN | 9% |
| Average, all tracked sites | 8.0% |
| New Orleans, LA | 8% |
| New York City, NY | 5% |
New York City's 5% looks modest, but in a city that size it still adds up to a lot of households. Wilmington's 11% puts it well above the 8.0% average.
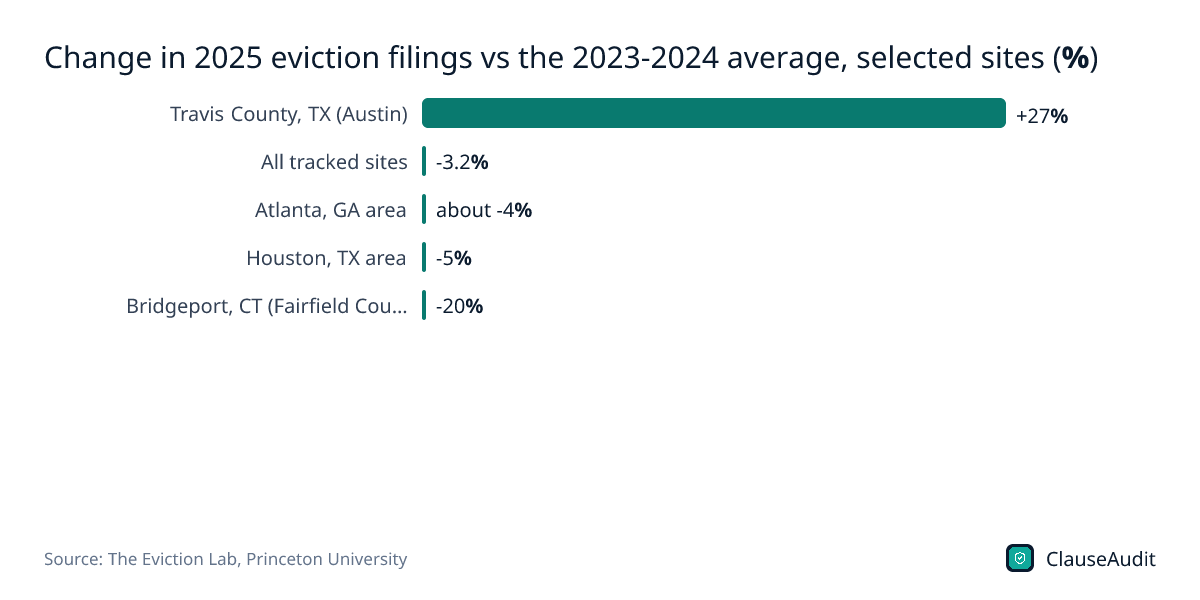
Download this chart (PNG)Change in 2025 eviction filings vs the 2023-2024 average, selected sites (%)
Chart data
| Label | Value |
|---|---|
| Travis County, TX (Austin) | +27% |
| All tracked sites | -3.2% |
| Atlanta, GA area | about -4% |
| Houston, TX area | -5% |
| Bridgeport, CT (Fairfield County) | -20% |
Overall filings came in 3.2% below the 2023-2024 average, but that figure hides big local swings. Travis County jumped 27% while Bridgeport fell 20%.
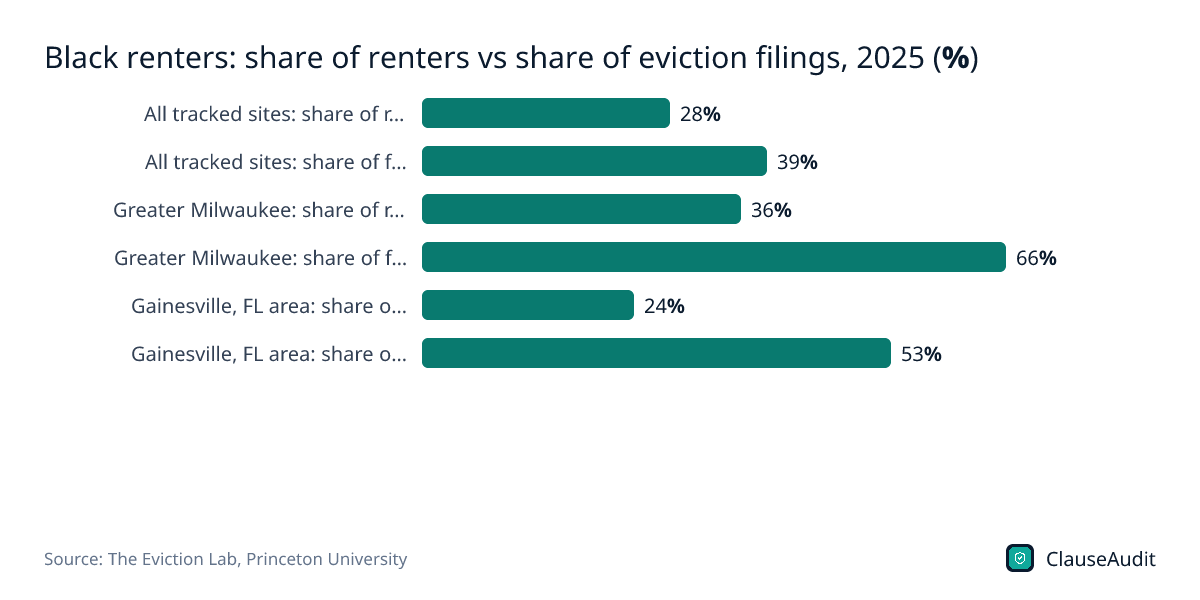
Download this chart (PNG)Black renters: share of renters vs share of eviction filings, 2025 (%)
Chart data
| Label | Value |
|---|---|
| All tracked sites: share of renters | 28% |
| All tracked sites: share of filings | 39% |
| Greater Milwaukee: share of renters | 36% |
| Greater Milwaukee: share of filings | 66% |
| Gainesville, FL area: share of renters | 24% |
| Gainesville, FL area: share of filings | 53% |
In Greater Milwaukee, Black renters are 36% of renters but 66% of eviction defendants. The gap shows up across tracked sites, at 28% versus 39%.
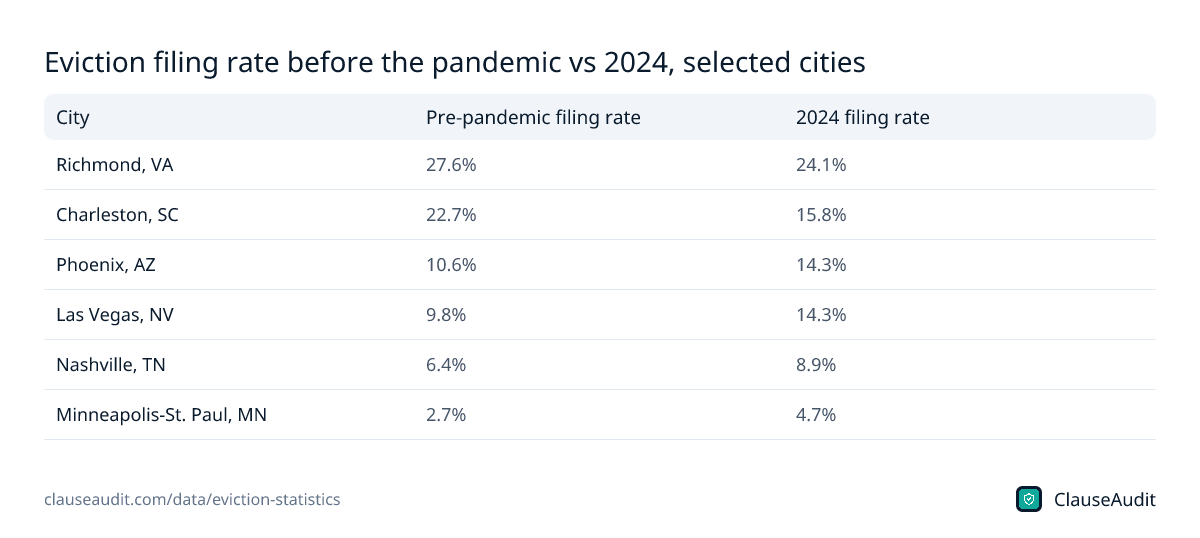
Download this chart (PNG)Eviction filing rate before the pandemic vs 2024, selected cities
| City | Pre-pandemic filing rate | 2024 filing rate |
|---|---|---|
| Richmond, VA | 27.6% | 24.1% |
| Charleston, SC | 22.7% | 15.8% |
| Phoenix, AZ | 10.6% | 14.3% |
| Las Vegas, NV | 9.8% | 14.3% |
| Nashville, TN | 6.4% | 8.9% |
| Minneapolis-St. Paul, MN | 2.7% | 4.7% |
Source: The Eviction Lab, Princeton University, Preliminary Analysis: Eviction Filing Patterns in 2024 (Johnson, Stojanovic, Hepburn; corrected edition). Download as image
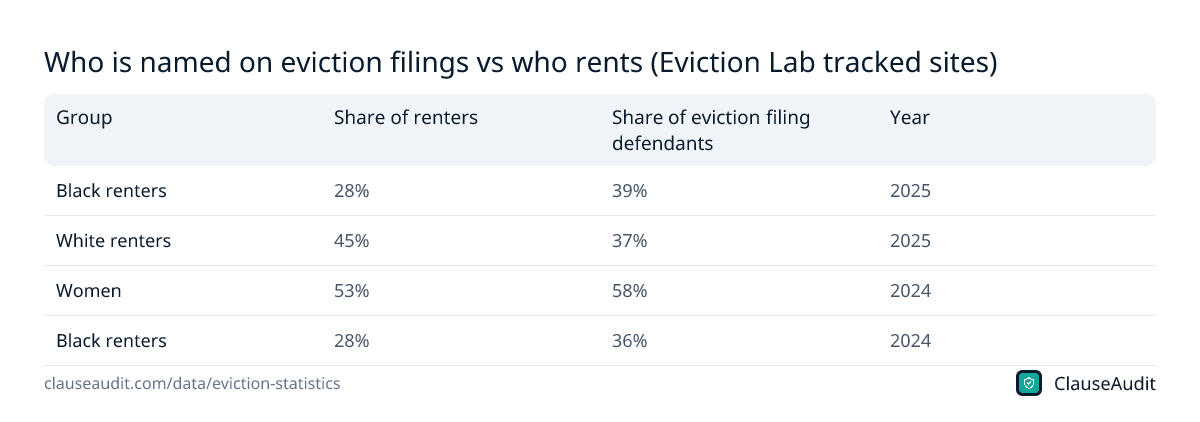
Who is named on eviction filings vs who rents (Eviction Lab tracked sites)
| Group | Share of renters | Share of eviction filing defendants | Year |
|---|---|---|---|
| Black renters | 28% | 39% | 2025 |
| White renters | 45% | 37% | 2025 |
| Women | 53% | 58% | 2024 |
| Black renters | 28% | 36% | 2024 |
Source: The Eviction Lab, Princeton University, Preliminary Analysis: Eviction Filing Patterns in 2025 (Grace Hartley); The Eviction Lab, Princeton University, Preliminary Analysis: Eviction Filing Patterns in 2024 (Johnson, Stojanovic, Hepburn; corrected edition). Download as image
How many evictions happen in the US each year?
There is no single official count. Courts keep their own records, and many states never publish them in a usable form. The best numbers come from Eviction Lab, a research group at Princeton that collects court records directly and cleans them so cities can be compared.
Its tracking system covers 48 sites: 38 city areas and 10 full states, home to roughly one-third of US renter households. Landlords there filed 1.23 million cases in 2025. That is not a national total, so don't read it as one.
For the whole country, the latest published estimate is 3.6 million filings in 2018, aimed at 2.7 million unique households. The gap between those two numbers matters. Some households get filed against more than once in the same year, sometimes by a landlord who uses the court as a collection tool rather than to actually remove anyone.
Keep in mind that a filing is not the same as being forced out. Many cases end in a payment plan, a dismissal or a move-out before judgment. But the filing itself can show up on a tenant screening report later, even if you paid and stayed.
Which cities have the highest eviction rates?
Location matters more than almost anything else. In 2024, Richmond, VA had a filing rate of 24.1%, the highest of the cities named in the report. Charleston, SC came in at 15.8%, and Phoenix and Las Vegas both hit 14.3%. Philadelphia sat at 4.0%.
In 2025, Eviction Lab flagged Atlanta, Charleston, Indianapolis and Memphis as running at least double the average. In Atlanta, one case was filed for every four renters, and the area still logged 144,000 filings even after a small drop. Houston had 77,000.
Local rules play a part. Filing fees, notice periods and how readily landlords go to court after a late payment all vary from place to place. If you rent in one of these places, a single late month carries more risk than it would in Philadelphia or Minneapolis-St. Paul.
Who gets evicted the most?
Eviction does not fall evenly. In 2025, Black renters made up 28% of renters at tracked sites but 39% of the people named on eviction filings. White renters were 45% of renters and 37% of filings. In Greater Milwaukee the gap was wider still: 36% of renters, 66% of filings. Around Gainesville, FL it was 24% versus 53%.
Women are also overrepresented. In 2024, they were 53% of renters but 58% of the people named on filings. Eviction Lab also estimates that 7.6 million renters face an eviction threat each year, and many of them are children.
These figures describe who gets named in court, not why. Income, savings and local rents all play a part, and the filing numbers alone can't separate them.
If you fall into one of these groups, none of this means you will be evicted. It does mean the system has less slack for you, and the terms you agree to at signing carry more weight.
Are evictions going up or down?
Slightly down, for now. Filings in 2025 came in 3.2% below the 2023-2024 average, the second straight year of decline. That is the overall picture.
Local trends were mixed. Filings rose in 14 of the 48 tracked sites. Travis County, TX, home to Austin, was up 27%. Bridgeport, CT fell 20%. And some cities are still above where they were before the pandemic: Phoenix went from 10.6% to 14.3% and Las Vegas from 9.8% to 14.3% by 2024.
So a national dip doesn't tell you much about your building. Check the city figures in the table and chart above for a closer read. Then look at your own lease, because the clauses in it decide how quickly a late month can become a court date in your area.
What this means if your income is uneven
Freelancers, gig workers and small business owners often get paid late, in lumps, or both. Rent, on the other hand, is due on a fixed day. That mismatch is where a lot of filings start: a client pays a week late, rent goes out late, and a landlord in a high-filing city goes straight to court.
Your lease decides how much room you have. Some leases give a grace period before a late fee kicks in. Others charge a fee the next day, add daily charges on top, and let the landlord refuse a partial payment so the clock keeps running. A clause that treats any late payment as a full default can turn a short cash gap into a court case.
If you run a business from a commercial space, the stakes are different but just as real. Commercial tenants usually get fewer legal protections, and a personal guarantee can put your own savings on the line if the business falls behind.
A simple test: picture your worst realistic month, when a big client pays late and a bill lands at the same time. Then read your lease and ask what happens on the first day rent is late, the first week, and the first month. If the answer is a fee, then a notice, then a court filing with little room in between, that is worth fixing before you sign.
What to do before and after a missed rent payment
- Read the late fee, grace period and default clauses before you sign, not after the first missed payment.
- Ask for a rent due date that matches when you actually get paid, and get it written into the lease.
- If you know you will be late, tell the landlord in writing before the due date and propose a specific date to pay.
- Keep proof of every payment, including partial ones, and every message about them.
- If you get a court notice, do not ignore it. Show up to the hearing, since many cases are lost by default.
- Look up local legal aid or a tenant right-to-counsel program in your city as soon as a case is filed.
How ClauseAudit helps
Most eviction cases start with unpaid rent, and a handful of lease clauses decide what happens once rent is late. Those clauses are easy to skim past when you are excited about a new place.
Upload your lease and the automated review flags the terms that raise your eviction risk, explains them in plain English, and suggests what to ask the landlord to change before you sign.
- Grace period length and when the first late fee applies
- Late fee size, daily add-on charges and if they look legal in your state
- Default clauses that treat one late payment as a breach of the whole lease
- If the landlord can refuse partial payments or apply them to fees first
- Notice-to-cure language that gives you time to fix a problem before a filing
- Attorney fee and court cost clauses that make you pay the landlord's legal bills
Frequently asked questions
How many evictions were filed in 2025?
Landlords filed 1.23 million eviction cases in 2025 across the 48 sites Eviction Lab tracks. Those sites cover about one-third of US renter households, so the true national number is higher. There is no official nationwide count for 2025, so treat any single national figure you see online with some caution.
How many evictions happen in the US per year?
The latest national estimate from Eviction Lab is 3.6 million eviction filings in 2018, against 2.7 million unique households. More recent data only covers tracked sites, where filings reached 1.23 million in 2025. Not every filing ends with the tenant being removed.
What is the eviction filing rate?
It is the number of eviction cases filed for every 100 renter households in an area. At Eviction Lab's tracked sites, the average rate in 2025 was 8.0%, which works out to about one filing for every 13 renter households.
Which city has the highest eviction rate?
Among the cities named in Eviction Lab's 2024 report, Richmond, VA had the highest rate at 24.1%, followed by Charleston, SC at 15.8%. In 2025, Atlanta stood out too, with one case filed for every four renters, and its area still logged 144,000 filings.
Are evictions increasing in 2026?
The latest full-year data is for 2025. Filings that year were 3.2% below the 2023-2024 average, the second straight year of decline. But filings still rose in 14 of 48 tracked sites, including a 27% jump in Travis County, TX.
Who is most likely to be evicted?
Black renters and women are named on eviction filings more often than their share of renters. In 2025, Black renters were 28% of renters but 39% of defendants. In 2024, women were 53% of renters and 58% of people named on filings.
Does an eviction filing show up even if I win or pay?
It can. Tenant screening companies often pull court records, and a filing may appear even if the case was dismissed or you paid what was owed. Some places let you seal those records, so ask a local legal aid office what applies to you.
Can my lease make an eviction more likely?
Yes. A lease with no grace period, steep late fees, a default clause triggered by a single late payment, or a rule letting the landlord refuse partial rent gives you less room to recover from a short cash gap. Check those terms before signing, and ask for changes in writing.
Use this data
Every chart and card below is free to reuse under CC BY 4.0. Download what you need and link back to this page.
 Stat cards
 Key findings card
 Infographic
 Eviction filing rate by city, 2024 (filings per 100 renter households) (%)
 Eviction filing rate at selected tracked sites, 2025 (%)
 Change in 2025 eviction filings vs the 2023-2024 average, selected sites (%)
 Black renters: share of renters vs share of eviction filings, 2025 (%)
 Eviction filing rate before the pandemic vs 2024, selected cities
 Who is named on eviction filings vs who rents (Eviction Lab tracked sites)
Embed the infographic
Free to share on your site, blog or slides under CC BY 4.0. Please keep the credit link.
Sources and method
Every number on this page comes from the sources below, each opened and read on or before October 18, 2026. A second, independent review checked every figure against its source and corrected anything that did not match. Figures that could not be confirmed were left out.
- The Eviction Lab, Princeton University, Preliminary Analysis: Eviction Filing Patterns in 2025 (Grace Hartley) (April 16, 2026)
- The Eviction Lab, Princeton University, Preliminary Analysis: Eviction Filing Patterns in 2024 (Johnson, Stojanovic, Hepburn; corrected edition) (April 24, 2025)
- The Eviction Lab, Princeton University, Eviction Lab Research: Key Findings (Last updated June 4, 2025 (accessed 2026-10-18))
- Proceedings of the National Academy of Sciences, Estimating eviction prevalence across the United States (Gromis et al.), PNAS 119(21):e2116169119 (May 16, 2022)
Cite this page
ClauseAudit, “Eviction Statistics 2026: Filings, Rates and Who Gets Evicted in the US”, updated October 18, 2026, https://clauseaudit.com/data/eviction-statistics. Free to reuse with a link back (CC BY 4.0).
This page summarises published data and law as checked on October 18, 2026. Figures are updated as new editions are released, and your own situation may differ. It is general information, not legal, tax or financial advice.