Average Rent by State 2026: Median Rent, HUD Fair Market Rent and Year-Over-Year Change
By ClauseAudit Research · 11 sources ·
What is the average rent by state?
The typical US renter paid $1,487 a month in 2024, counting utilities, according to the Census Bureau. California was the most expensive state at $2,104 and West Virginia the cheapest at $883. If you are signing a new lease now, expect more: Zillow put the typical asking rent at $1,932 in September 2026.

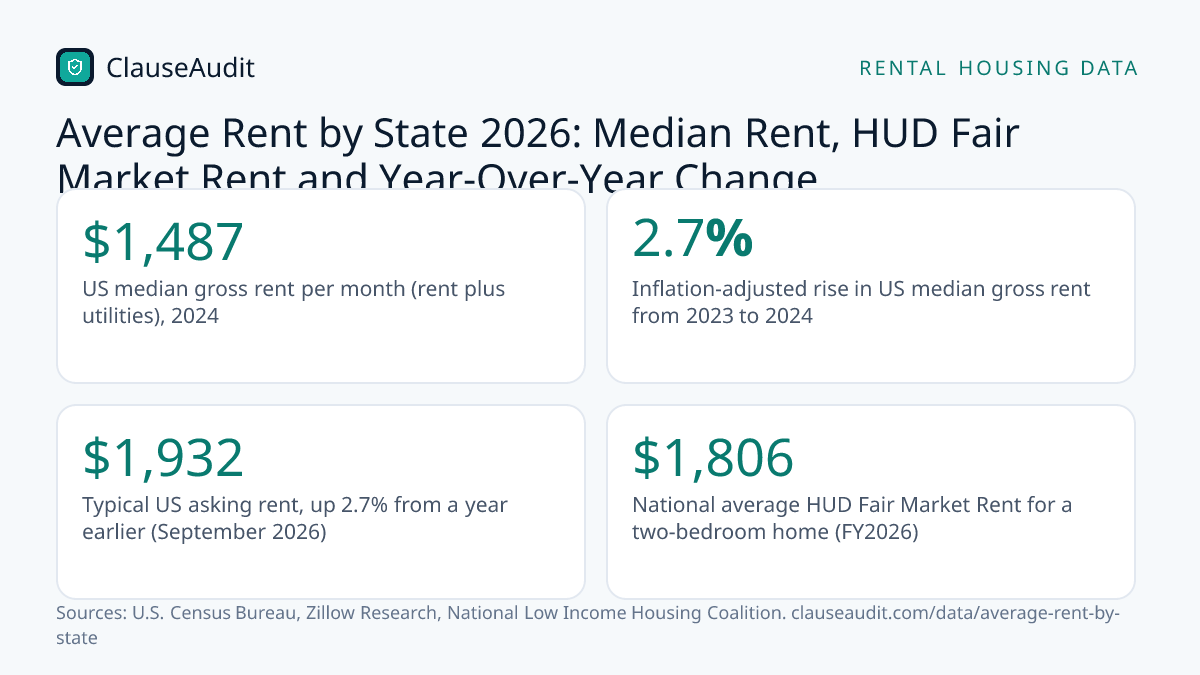
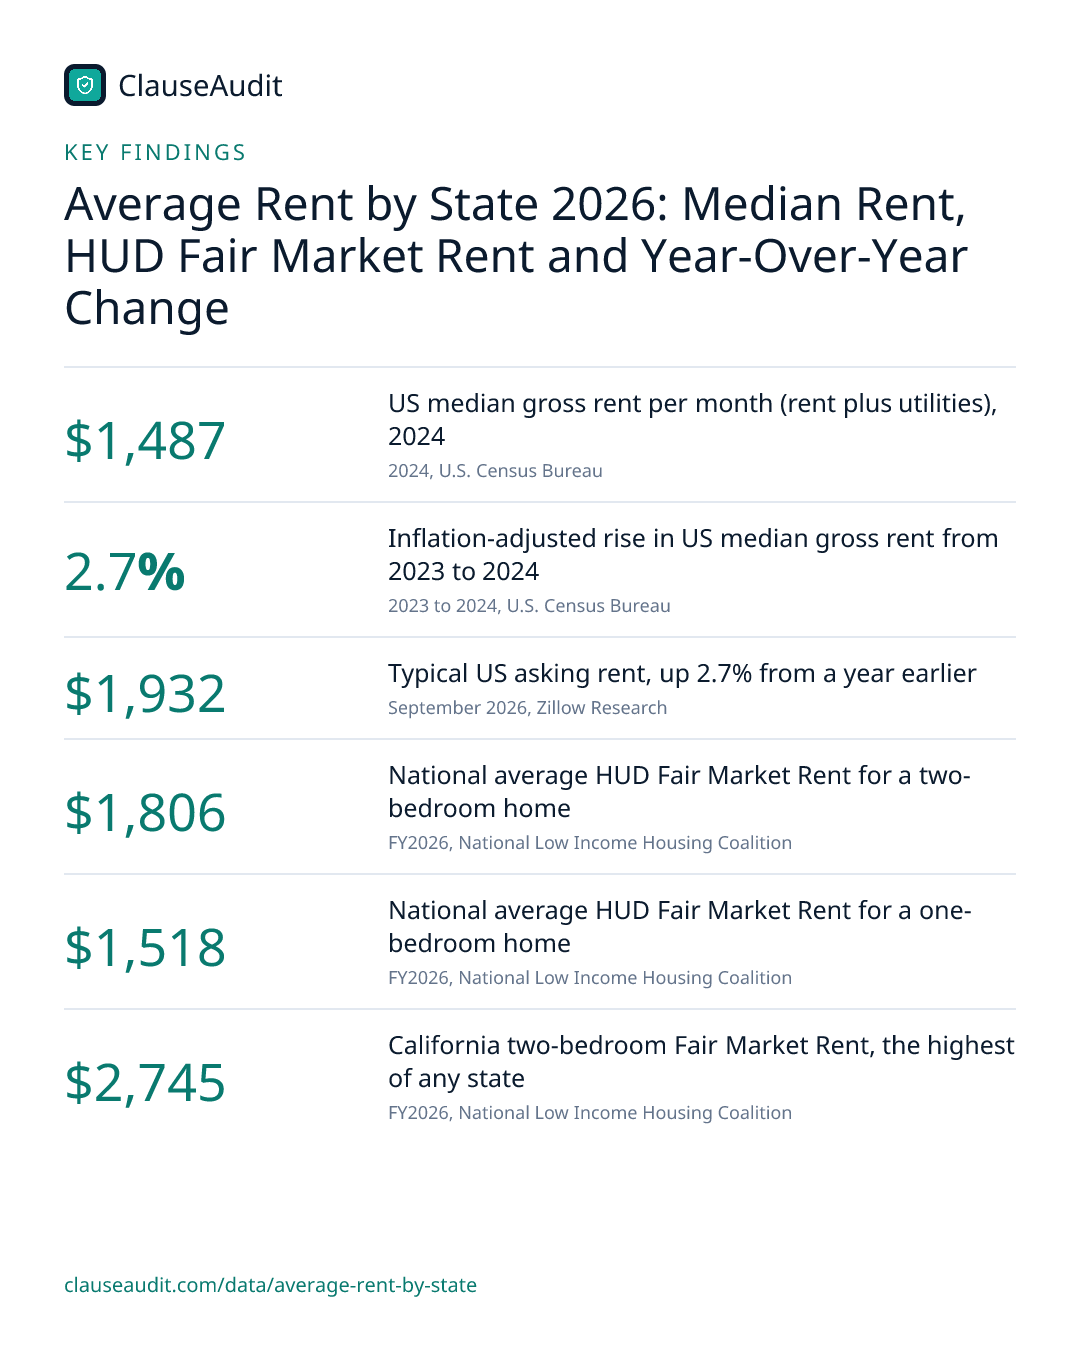
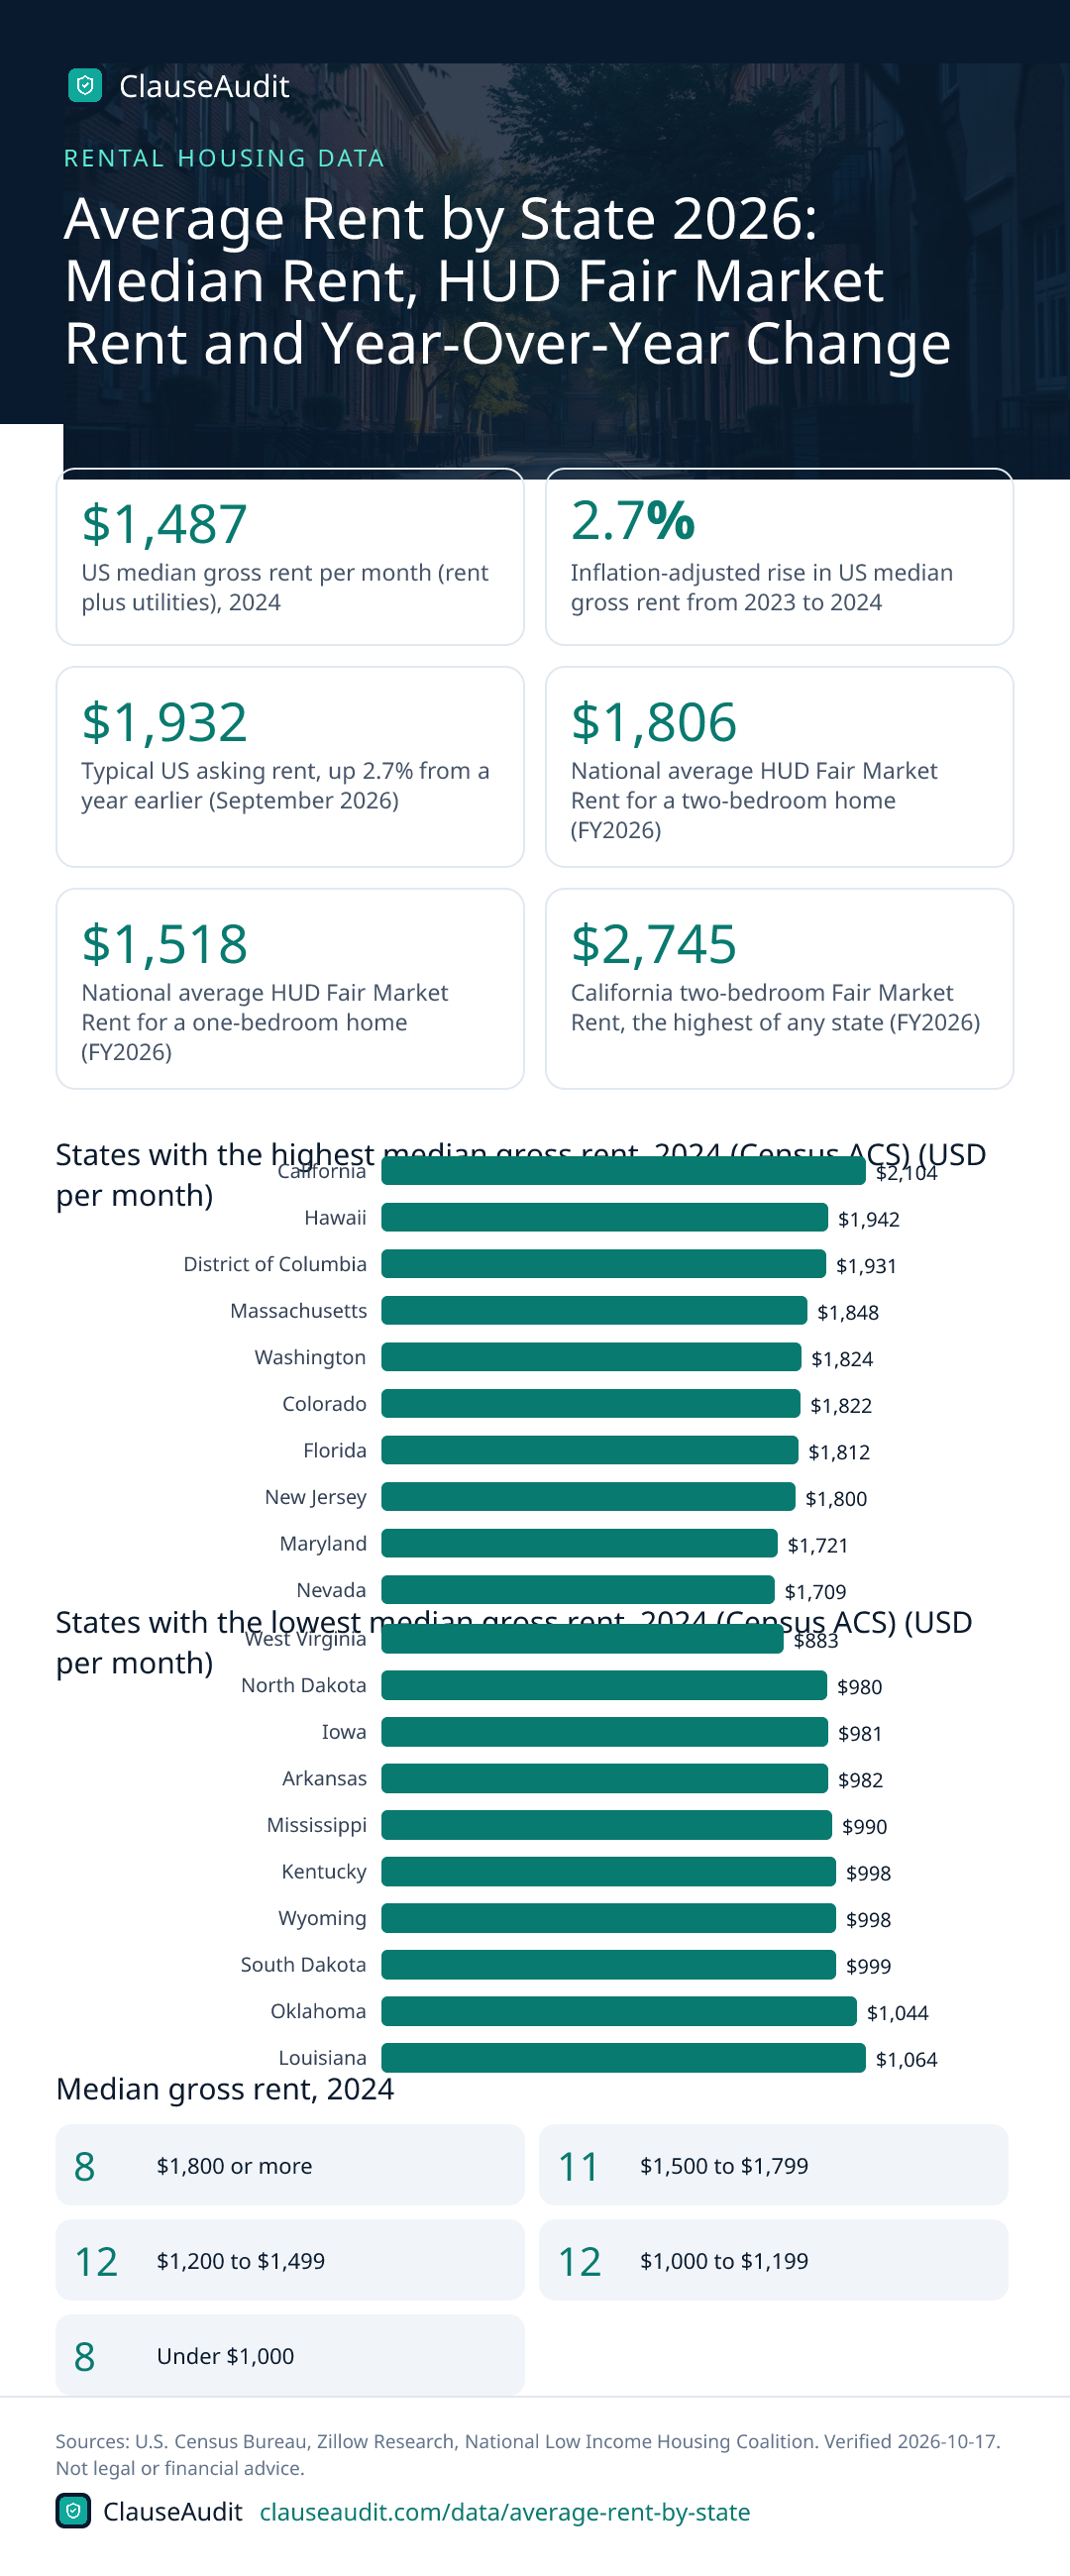
- US median gross rent per month (rent plus utilities), 2024 (2024, U.S. Census Bureau)
- $1,487
- Inflation-adjusted rise in US median gross rent from 2023 to 2024 (2023 to 2024, U.S. Census Bureau)
- 2.7%
- Typical US asking rent, up 2.7% from a year earlier (September 2026, Zillow Research)
- $1,932
- National average HUD Fair Market Rent for a two-bedroom home (FY2026, National Low Income Housing Coalition)
- $1,806
- National average HUD Fair Market Rent for a one-bedroom home (FY2026, National Low Income Housing Coalition)
- $1,518
- California two-bedroom Fair Market Rent, the highest of any state (FY2026, National Low Income Housing Coalition)
- $2,745
- West Virginia two-bedroom Fair Market Rent, the lowest of any state (FY2026, National Low Income Housing Coalition)
- $1,000
- Hourly full-time wage needed to afford a two-bedroom home at FMR (2026, National Low Income Housing Coalition)
- $34.73
Rent in America is really a separate market in every state. A renter in California paid a median of $2,104 a month in 2024. In West Virginia the figure was $883. Same country, same year, and the California renter paid more than twice as much.
This page puts three measures side by side: the Census median that existing renters actually pay, HUD's Fair Market Rent that sets voucher limits, and Zillow's asking rents for homes on the market today. Each tells you something different. Below we explain which one to use when you budget, negotiate or sign.
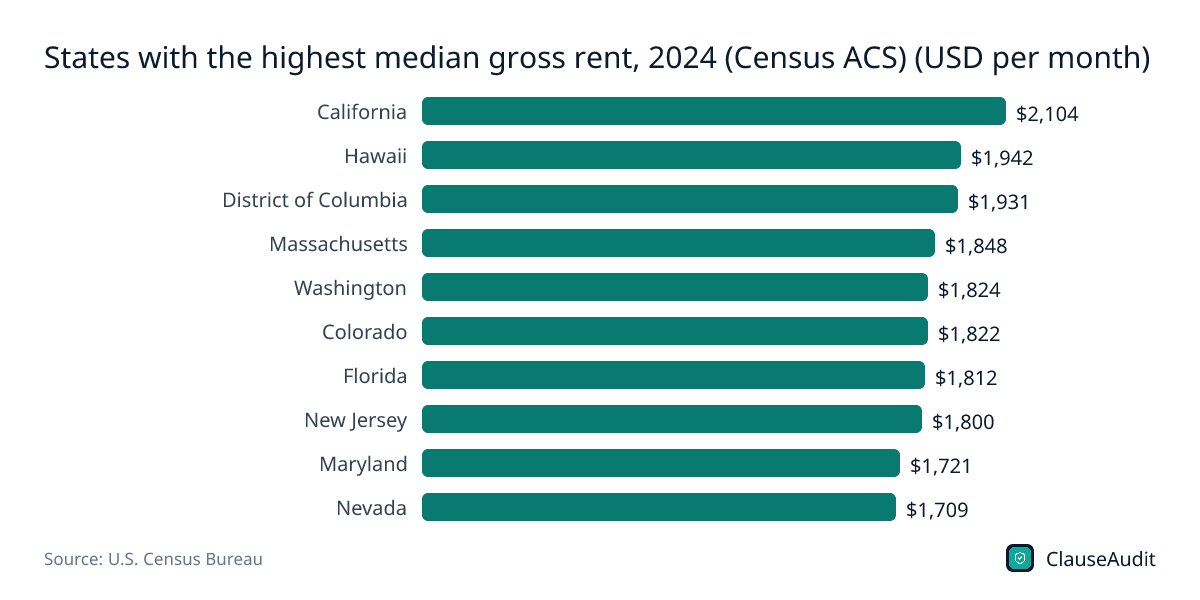
States with the highest median gross rent, 2024 (Census ACS) (USD per month)
Chart data
| Label | Value |
|---|---|
| California | $2,104 |
| Hawaii | $1,942 |
| District of Columbia | $1,931 |
| Massachusetts | $1,848 |
| Washington | $1,824 |
| Colorado | $1,822 |
| Florida | $1,812 |
| New Jersey | $1,800 |
| Maryland | $1,721 |
| Nevada | $1,709 |
Coastal states dominate, and Florida at $1,812 sits ahead of New Jersey and Maryland. These are statewide medians, so an apartment in a big city in any of these states can cost a lot more than the bar shows.
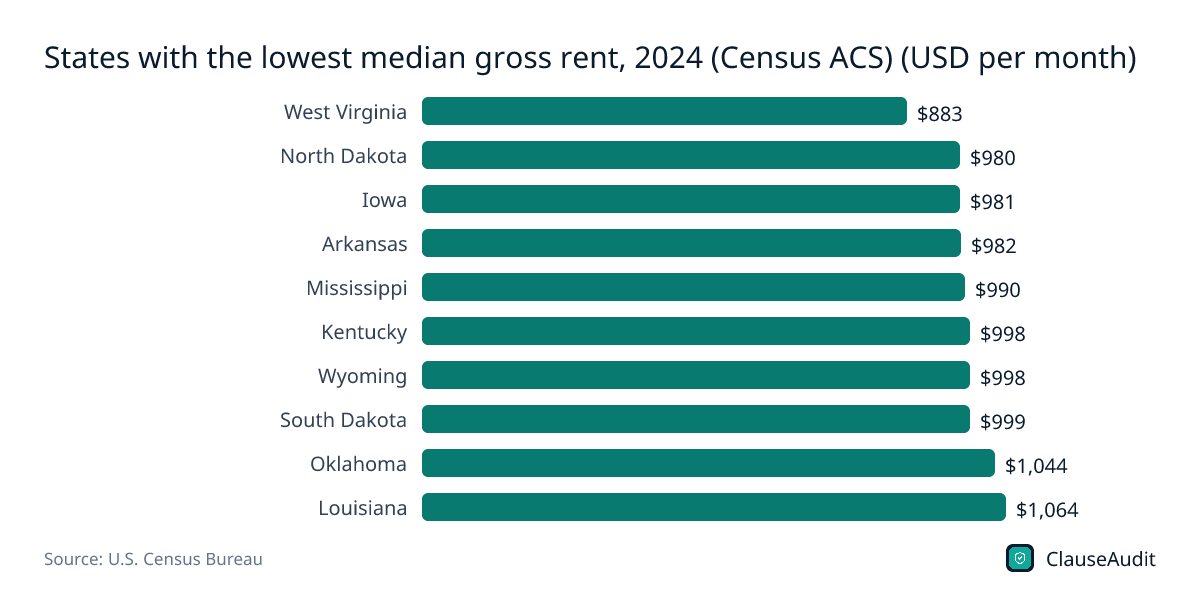
Download this chart (PNG)States with the lowest median gross rent, 2024 (Census ACS) (USD per month)
Chart data
| Label | Value |
|---|---|
| West Virginia | $883 |
| North Dakota | $980 |
| Iowa | $981 |
| Arkansas | $982 |
| Mississippi | $990 |
| Kentucky | $998 |
| Wyoming | $998 |
| South Dakota | $999 |
| Oklahoma | $1,044 |
| Louisiana | $1,064 |
Most of this list is rural, southern or plains states. West Virginia stands alone at $883, while North Dakota, Iowa and Arkansas sit almost tied around $980.
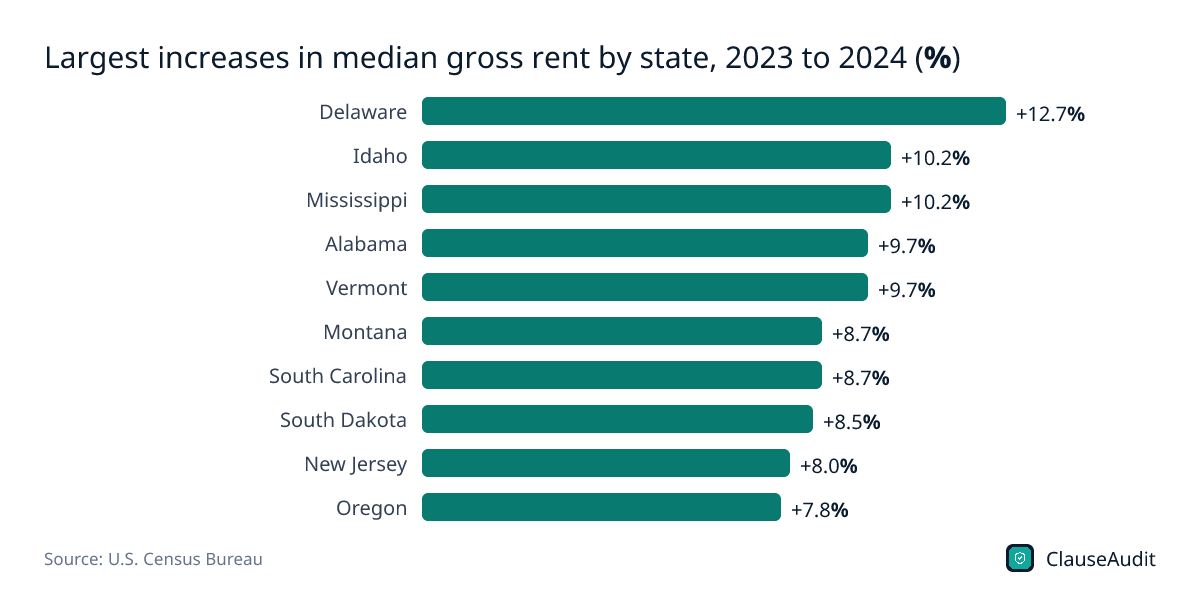
Download this chart (PNG)Largest increases in median gross rent by state, 2023 to 2024 (%)
Chart data
| Label | Value |
|---|---|
| Delaware | +12.7% |
| Idaho | +10.2% |
| Mississippi | +10.2% |
| Alabama | +9.7% |
| Vermont | +9.7% |
| Montana | +8.7% |
| South Carolina | +8.7% |
| South Dakota | +8.5% |
| New Jersey | +8.0% |
| Oregon | +7.8% |
Several cheaper states grew fast. Mississippi rose 10.2% and Alabama 9.7%, yet both remain well below the national median of $1,487. These changes are in current dollars, not adjusted for inflation.
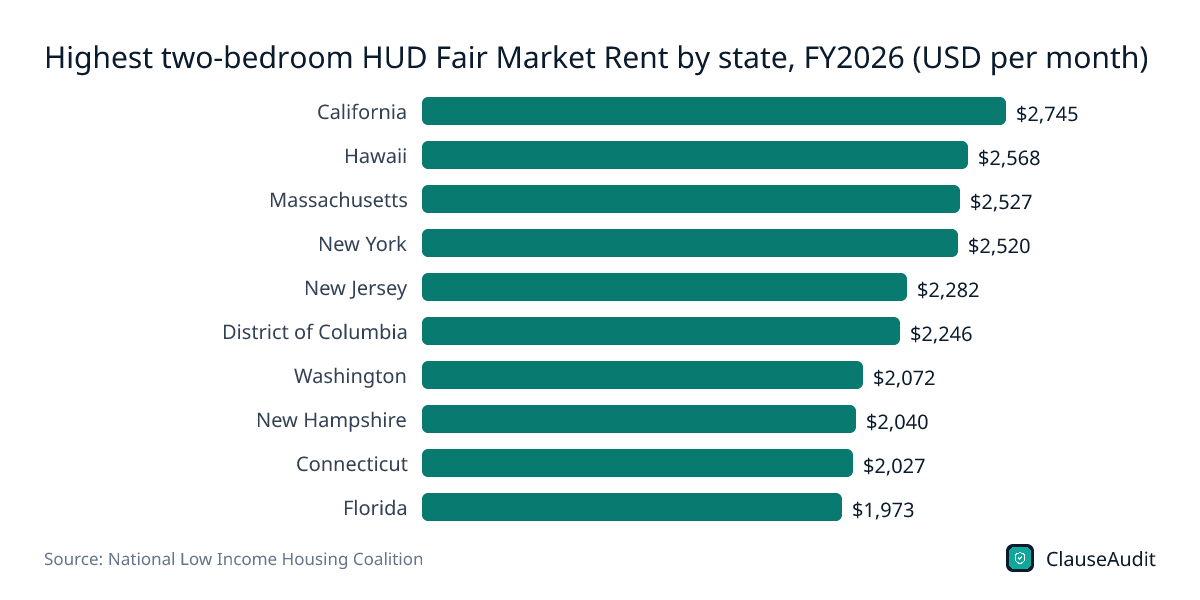
Download this chart (PNG)Highest two-bedroom HUD Fair Market Rent by state, FY2026 (USD per month)
Chart data
| Label | Value |
|---|---|
| California | $2,745 |
| Hawaii | $2,568 |
| Massachusetts | $2,527 |
| New York | $2,520 |
| New Jersey | $2,282 |
| District of Columbia | $2,246 |
| Washington | $2,072 |
| New Hampshire | $2,040 |
| Connecticut | $2,027 |
| Florida | $1,973 |
New York shows up here at $2,520 even though its Census median is only $1,634. The FMR prices a two-bedroom unit, while the Census median covers every unit size and every renter, including long-time tenants. The state FMR is also a weighted average, so the New York City area pulls it up.
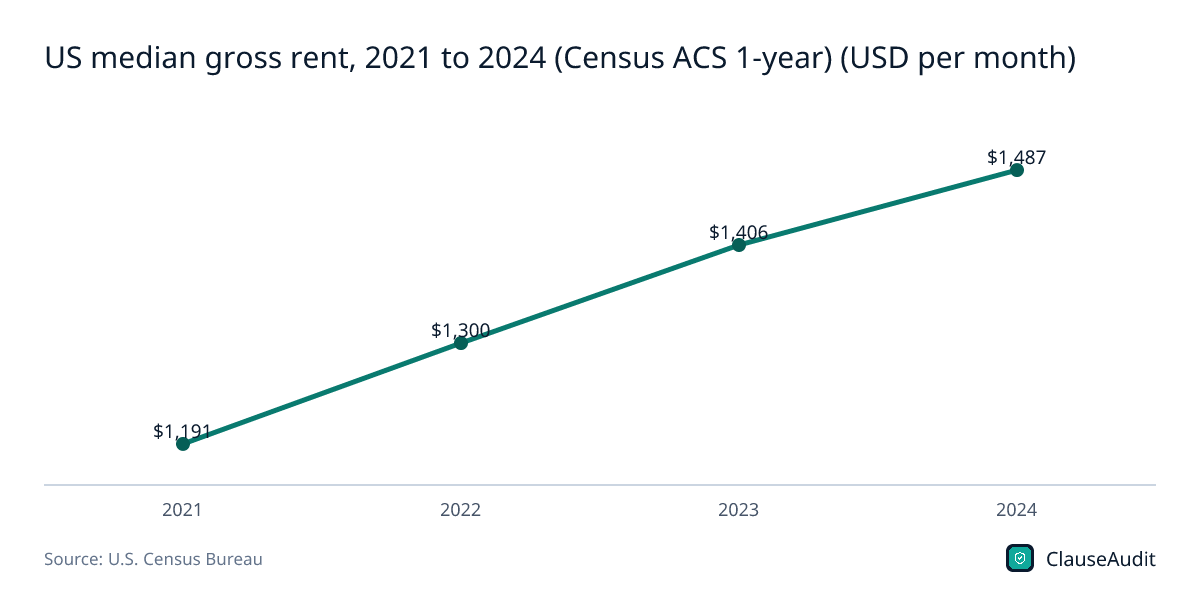
Download this chart (PNG)US median gross rent, 2021 to 2024 (Census ACS 1-year) (USD per month)
Chart data
| Label | Value (USD per month) |
|---|---|
| 2021 | $1,191 |
| 2022 | $1,300 |
| 2023 | $1,406 |
| 2024 | $1,487 |
The national median climbed every year in this series, from $1,191 in 2021 to $1,487 in 2024. The 2025 figures are due out on October 29, 2026.
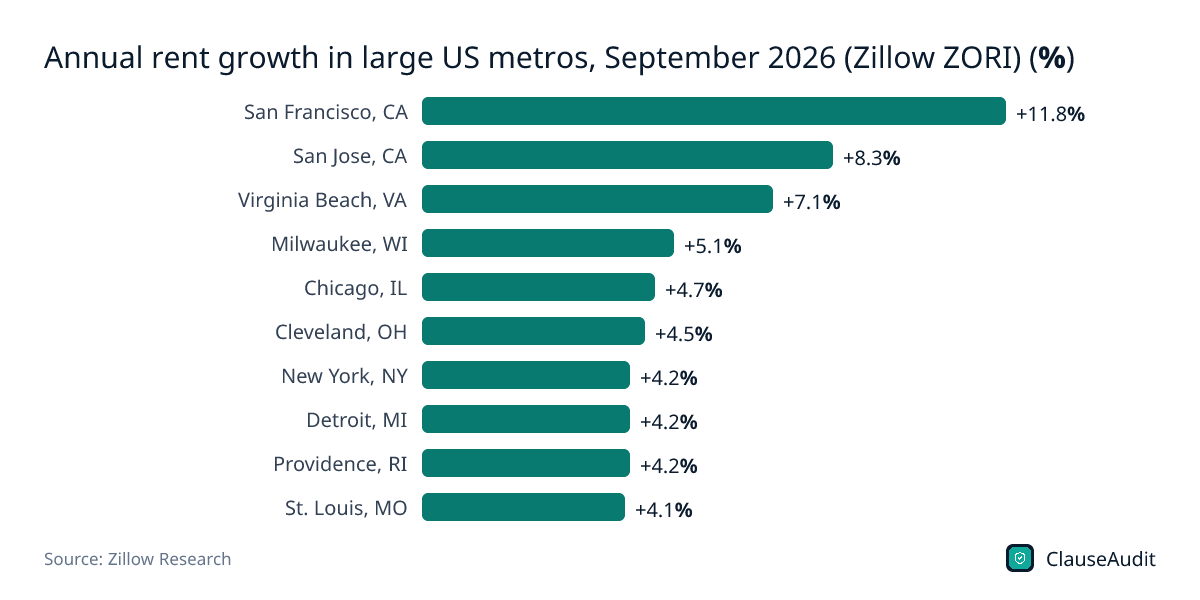
Download this chart (PNG)Annual rent growth in large US metros, September 2026 (Zillow ZORI) (%)
Chart data
| Label | Value |
|---|---|
| San Francisco, CA | +11.8% |
| San Jose, CA | +8.3% |
| Virginia Beach, VA | +7.1% |
| Milwaukee, WI | +5.1% |
| Chicago, IL | +4.7% |
| Cleveland, OH | +4.5% |
| New York, NY | +4.2% |
| Detroit, MI | +4.2% |
| Providence, RI | +4.2% |
| St. Louis, MO | +4.1% |
San Francisco's 11.8% jump stands far above the national 2.7%. Midwestern metros like Milwaukee, Cleveland and St. Louis also beat the national pace, which runs against the idea that only the coasts are getting pricier.
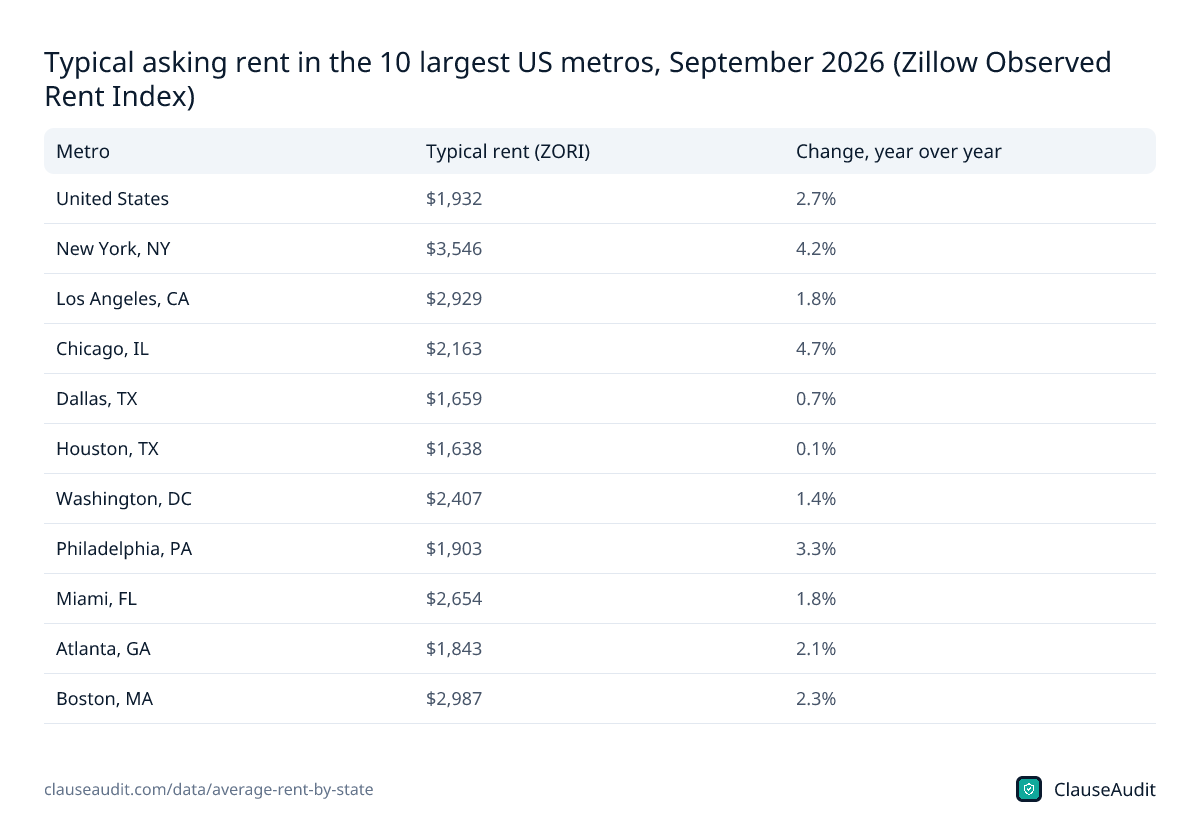
Download this chart (PNG)Typical asking rent in the 10 largest US metros, September 2026 (Zillow Observed Rent Index)
| Metro | Typical rent (ZORI) | Change, year over year |
|---|---|---|
| United States | $1,932 | 2.7% |
| New York, NY | $3,546 | 4.2% |
| Los Angeles, CA | $2,929 | 1.8% |
| Chicago, IL | $2,163 | 4.7% |
| Dallas, TX | $1,659 | 0.7% |
| Houston, TX | $1,638 | 0.1% |
| Washington, DC | $2,407 | 1.4% |
| Philadelphia, PA | $1,903 | 3.3% |
| Miami, FL | $2,654 | 1.8% |
| Atlanta, GA | $1,843 | 2.1% |
| Boston, MA | $2,987 | 2.3% |
Source: Zillow Research, Winter Has Arrived Early in the Housing Market as Newly Pending Sales Fall 8.5% (Zillow September Market Report). Download as image
Median gross rent, 2024 by state
- 8$1,800 or more
- 11$1,500 to $1,799
- 12$1,200 to $1,499
- 12$1,000 to $1,199
- 8Under $1,000
- $1,800 or more8
- $1,500 to $1,79911
- $1,200 to $1,49912
- $1,000 to $1,19912
- Under $1,0008
What is the average rent in each state?
The best single answer is the Census Bureau's median gross rent. It covers rent plus utilities and fuel the tenant pays, and it comes from the American Community Survey, a large yearly survey of households in every state. For 2024 the national figure was $1,487, up 2.7% from 2023 after adjusting for inflation.
The top of the list is no surprise. California led at $2,104, followed by Hawaii at $1,942 and DC at $1,931. The bottom is mostly rural and southern or plains states: West Virginia at $883, North Dakota at $980, Iowa at $981 and Arkansas at $982.
Keep one thing in mind. A median includes people who signed their lease years ago and have only seen small renewals since. That makes it a fair picture of what renters pay on average, and a low estimate of what you will be quoted if you move this month.
If you are comparing states for a move, look at the whole table rather than the extremes. Plenty of states sit in the middle band, and some, such as Georgia at $1,506 or Texas at $1,475, have big metros where asking rents run higher. Atlanta's typical asking rent was $1,843 in September 2026.
Why is my rent quote higher than the state average?
Because you are shopping in a different market than the median measures. Zillow's index tracks asking rents for homes that are actually listed. In September 2026 the typical US asking rent was $1,932, well above the Census median of $1,487 for 2024. Part of that gap is time. Part of it is that a new lease prices at today's market, while a tenant who has renewed for years often pays less.
Location inside a state matters even more. New York's statewide median was $1,634 in 2024, but the typical asking rent in the New York metro hit $3,546 in September 2026. Illinois had a median of $1,322 while the Chicago metro asked $2,163. If you are moving to a big city, use the metro figure, not the state one.
Size matters too. HUD's national Fair Market Rent was $1,518 for a one-bedroom and $1,806 for a two-bedroom in FY2026. If a landlord quotes you far above the FMR for your state and unit size, ask what you are getting for it.
How much do you need to earn to afford rent in your state?
The National Low Income Housing Coalition answers this with a housing wage: the hourly pay a full-time worker needs to afford a two-bedroom home at Fair Market Rent without spending more than a standard share of income on housing. Nationally it was $34.73 an hour in 2026.
The spread by state is huge. California needs $52.79 an hour. Hawaii needs $49.38 and Massachusetts $48.59. At the other end, West Virginia needs $19.23 and Mississippi $20.01.
For a freelancer this is a useful sanity check on your rates. Say you bill hourly and live in New Jersey, where the housing wage is $43.89. Your billable rate has to clear that number by a wide margin, because you also cover unpaid admin time, self-employment tax and gaps between clients. If your rate sits close to the housing wage, either the rate or the apartment needs to change.
Is rent still going up in 2026?
Yes, at a modest pace nationally. Zillow's typical asking rent was up 2.7% year over year in September 2026. Some big metros were flat: Houston rose 0.1% and Dallas 0.7%. Others ran hot, led by San Francisco at 11.8% and San Jose at 8.3%.
The Census data shows big state swings between 2023 and 2024, measured in current dollars rather than adjusted for inflation. Delaware's median rose 12.7%. Idaho rose 10.2%, and so did Mississippi, one of the cheapest states. HUD's FY2026 numbers moved in mixed directions: Maine's two-bedroom FMR rose 13.7% while Arizona's fell 3.9%.
What this means for you: a renewal increase near the national pace is normal right now. A much bigger one is worth pushing back on, especially if your metro is in the flat group. Pull up the metro table, point to the number, and ask for a smaller bump or a longer lease at the current rate.
How to use these numbers before you sign a lease
Data only helps if you bring it into the conversation. Landlords quote prices with confidence. You can answer with the same confidence if you have checked a few figures first. Here is a simple routine that takes about as long as a coffee.
- Find your state in the table and note the median gross rent and the Fair Market Rent for your unit size. The median shows what renters around you already pay, and the FMR is a check on what a modest unit should cost.
- Look up your metro in the Zillow table if it is listed. In a big city, that asking rent is the price you are really competing against.
- Add expected utilities to the advertised rent before comparing. The Census median already includes them, so a bare base rent will always look cheaper than it is.
- Compare the quoted renewal increase with the 2.7% national asking-rent change for September 2026 and with your metro's own rate. A much higher number is a reason to negotiate.
- Check the housing wage for your state against your own hourly pay or billing rate. If the apartment needs more than you earn, a longer commute or a roommate may beat a stretched budget.
- Read the fee and renewal clauses, not just the rent line. A low rent with a steep late fee or an automatic increase can cost more over a year than a slightly higher rent with fair terms.
Which number should a business or employer use?
If you are setting a relocation stipend or a housing allowance, use HUD's Fair Market Rent for the unit size your hire needs. It is published for every area of the country, it updates every year, and HUD's FY2027 figures took effect October 1, 2026. It is also the figure housing programs rely on, so it holds up when someone asks where your number came from.
If you are a small landlord pricing a unit, the Census median tells you what neighbors with sitting tenants pay, and Zillow's metro data tells you what new tenants will accept. Price near the second, and write your renewal terms clearly so the increase is predictable for both sides.
How ClauseAudit helps
The rent number on the first page of a lease is only part of what you pay. Fees, utility splits and renewal terms can add a lot over a year, and those live in the fine print.
Upload your lease and ClauseAudit's automated review flags the clauses that change your real monthly cost, explains them in plain English, and suggests what to ask for before you sign.
- Rent amount and what it includes: which utilities, parking or amenity fees sit on top of base rent
- Renewal and rent increase terms: how much notice you get and whether any cap applies
- Late fees and grace period: whether the charge is reasonable and allowed in your state
- Auto-renewal and notice to vacate: how far ahead you must give notice to leave
- Security deposit: the amount, where it is held and when it must be returned
- Early termination: what breaking the lease costs if your job or income changes
Frequently asked questions
What is the average rent in the US right now?
It depends on which measure you use. The Census median gross rent, which includes utilities, was $1,487 a month in 2024. Zillow's typical asking rent for listed homes was $1,932 in September 2026. The first reflects what all renters pay. The second is closer to what you will be quoted on a new lease.
Which state has the highest rent?
California, by both main measures. Its median gross rent was $2,104 in 2024, and its two-bedroom Fair Market Rent was $2,745 in FY2026, the highest of any state. Hawaii came second on both lists. DC also ranks near the top if you count it alongside the states.
Which state has the cheapest rent?
West Virginia. Its median gross rent was $883 in 2024, and its two-bedroom Fair Market Rent was $1,000 in FY2026, the lowest of any state. North Dakota, Iowa and Arkansas follow closely, each with a 2024 median under $1,000 a month.
What is HUD Fair Market Rent?
It is HUD's yearly estimate of what a modest rental of a given size costs in an area. Housing vouchers and many housing programs use it to set payment limits. Nationally, the FY2026 Fair Market Rent was $1,518 for a one-bedroom and $1,806 for a two-bedroom. HUD's FY2027 figures took effect October 1, 2026.
Does median gross rent include utilities?
Yes. The Census Bureau's gross rent is contract rent plus the utilities and fuel the renter pays. That makes it a better budgeting figure than base rent alone. When you compare it to a listing, add your expected utility bills to the advertised rent first, or the listing will look cheaper than it is.
Why do Census, HUD and Zillow rent numbers differ?
They measure different things. Census surveys a large sample of all renters, including long-time tenants. HUD estimates the cost of a modest unit for program limits. Zillow tracks asking rents on listings. In New York, for example, the 2024 Census median was $1,634, the FY2026 two-bedroom FMR was $2,520, and the metro asking rent was $3,546 in September 2026.
How much did rent go up from 2023 to 2024?
Nationally, the Census median gross rent rose 2.7% after adjusting for inflation, reaching $1,487 in 2024. By state, in current dollars, Delaware had the largest jump at 12.7%, followed by Idaho and Mississippi at 10.2% each. A few states, including Hawaii and Wyoming, barely moved, and their changes fall within the survey's margin of error.
When will 2025 rent data by state come out?
The Census Bureau has scheduled its 2025 one-year American Community Survey estimates for release on October 29, 2026. Until then, the 2024 figures on this page are the latest official state medians. For a more current read on asking rents, the Zillow metro data from September 2026 is the better guide.
Use this data
Every chart and card below is free to reuse under CC BY 4.0. Download what you need and link back to this page.
 Stat cards
 Key findings card
 Infographic
 States with the highest median gross rent, 2024 (Census ACS) (USD per month)
 States with the lowest median gross rent, 2024 (Census ACS) (USD per month)
 Largest increases in median gross rent by state, 2023 to 2024 (%)
 Highest two-bedroom HUD Fair Market Rent by state, FY2026 (USD per month)
 US median gross rent, 2021 to 2024 (Census ACS 1-year) (USD per month)
 Annual rent growth in large US metros, September 2026 (Zillow ZORI) (%)
 Typical asking rent in the 10 largest US metros, September 2026 (Zillow Observed Rent Index)
Embed the infographic
Free to share on your site, blog or slides under CC BY 4.0. Please keep the credit link.
Sources and method
Every number on this page comes from the sources below, each opened and read on or before October 17, 2026. A second, independent review checked every figure against its source and corrected anything that did not match. 51 of 51 state entries were confirmed; any that could not be are marked "Not yet confirmed" and left out of every count and chart.
- U.S. Census Bureau, American Community Survey 2024 1-year estimates, table B25064 Median Gross Rent (Dollars), table-based summary file (2024 ACS 1-year, released September 11, 2025)
- U.S. Census Bureau, American Community Survey 2023 1-year estimates, table B25064 Median Gross Rent (Dollars), table-based summary file (2023 ACS 1-year)
- U.S. Census Bureau, American Community Survey 2022 1-year estimates, table B25064 Median Gross Rent (Dollars), table-based summary file (2022 ACS 1-year)
- U.S. Census Bureau, American Community Survey 2021 1-year estimates, table B25064 Median Gross Rent (Dollars), table-based summary file (2021 ACS 1-year)
- U.S. Census Bureau, The Cost of Homeownership Continues to Rise (2024 ACS 1-year estimates press release) (September 11, 2025)
- U.S. Census Bureau, Census Bureau Announces Release Dates, Webinars, and Embargo of 2025 American Community Survey 1-Year Estimates (Press Release CB26-164) (October 13, 2026)
- U.S. Census Bureau, ACS User Note: Change to Monthly Contract Rent Estimates (2025 (applies to 2024 data))
- National Low Income Housing Coalition, Out of Reach 2026: The High Cost of Housing (report and state pages) (2026 edition, July 23, 2026 (HUD FY2026 FMRs))
- National Low Income Housing Coalition, Out of Reach 2025 (full report) (2025 edition, July 2025 (HUD FY2025 FMRs))
- U.S. Department of Housing and Urban Development (Federal Register), Fair Market Rents for the Housing Choice Voucher Program, Moderate Rehabilitation Single Room Occupancy Program, and Other Programs, Fiscal Year 2027 (FR Doc. 2026-17891) (September 1, 2026; FY2027 FMRs effective October 1, 2026)
- Zillow Research, Winter Has Arrived Early in the Housing Market as Newly Pending Sales Fall 8.5% (Zillow September Market Report) (October 6, 2026 (September 2026 data))
Cite this page
ClauseAudit, “Average Rent by State 2026: Median Rent, HUD Fair Market Rent and Year-Over-Year Change”, updated October 17, 2026, https://clauseaudit.com/data/average-rent-by-state. Free to reuse with a link back (CC BY 4.0).
This page summarises published data and law as checked on October 17, 2026. Figures are updated as new editions are released, and your own situation may differ. It is general information, not legal, tax or financial advice.