Renters Insurance Statistics 2026: How Many Renters Have It, What It Costs and What Claims Look Like
By ClauseAudit Research · 2 sources ·
What do the latest renters insurance statistics show?
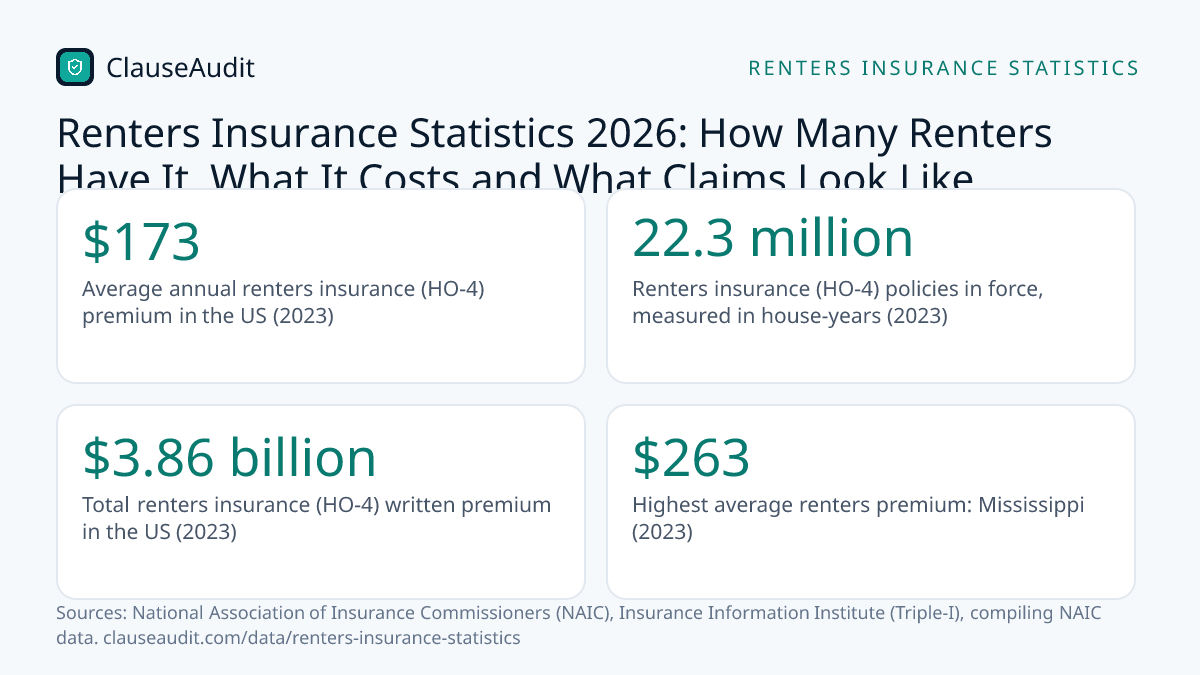
Renters insurance is cheap, but most policies are thin. The average HO-4 policy cost $173 a year in 2023, across 22.3 million house-years of coverage and $3.86 billion in premium. Yet 67.1% of renters and condo policies carried less than $35,000 in coverage.

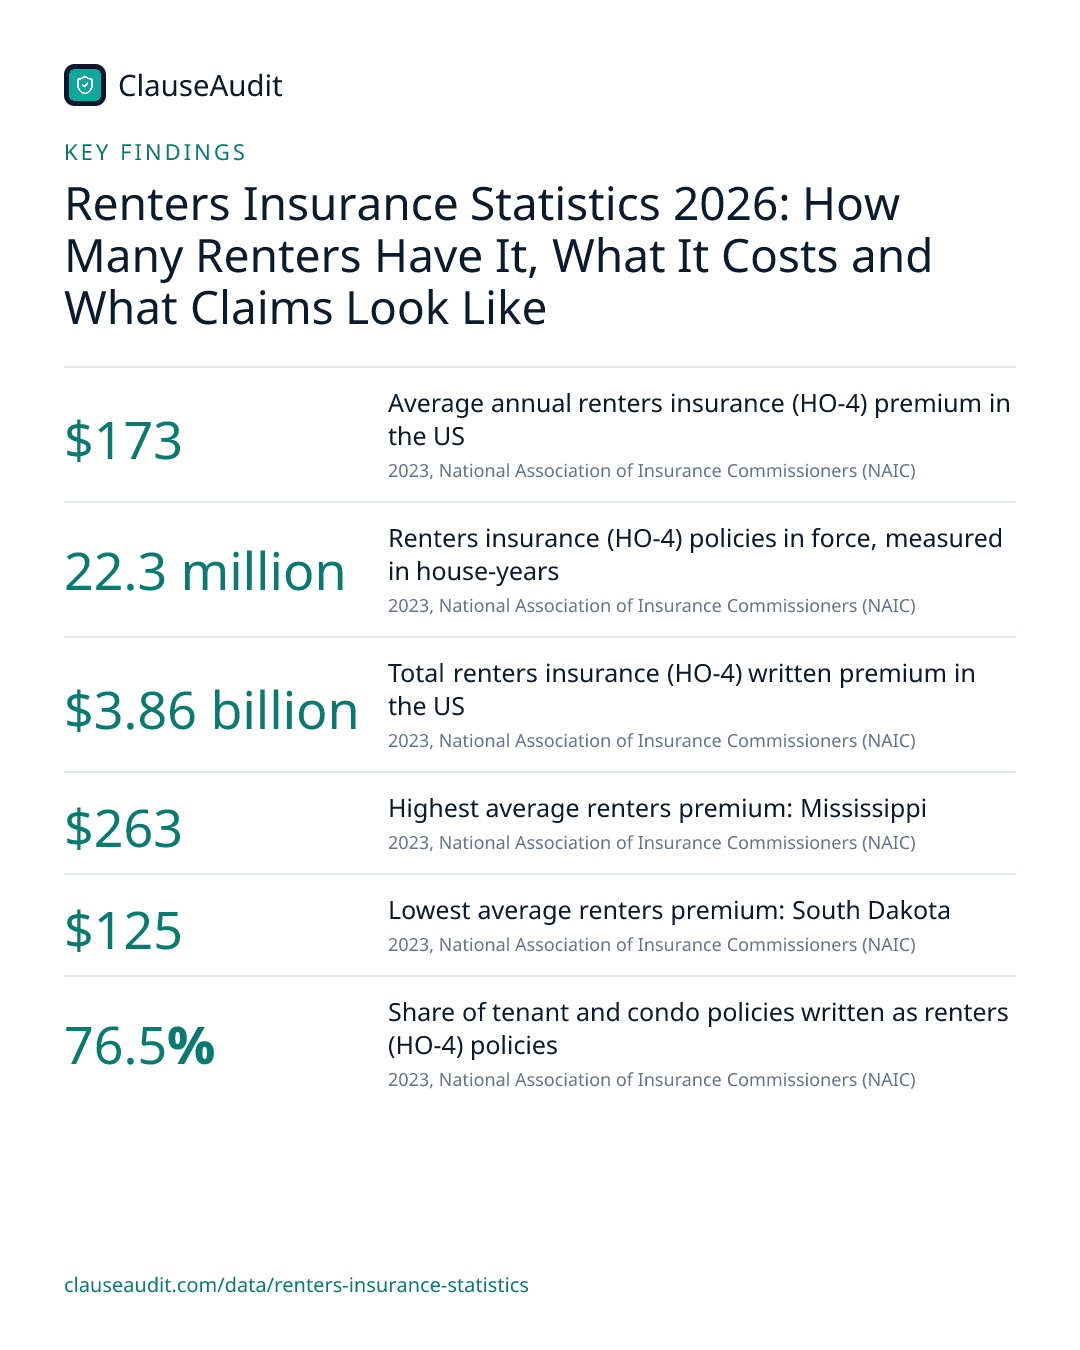
- Average annual renters insurance (HO-4) premium in the US (2023, National Association of Insurance Commissioners (NAIC))
- $173
- Renters insurance (HO-4) policies in force, measured in house-years (2023, National Association of Insurance Commissioners (NAIC))
- 22.3 million
- Total renters insurance (HO-4) written premium in the US (2023, National Association of Insurance Commissioners (NAIC))
- $3.86 billion
- Highest average renters premium: Mississippi (2023, National Association of Insurance Commissioners (NAIC))
- $263
- Lowest average renters premium: South Dakota (2023, National Association of Insurance Commissioners (NAIC))
- $125
- Share of tenant and condo policies written as renters (HO-4) policies (2023, National Association of Insurance Commissioners (NAIC))
- 76.5%
- Share of renters and condo policies with coverage below $35,000 (2023, National Association of Insurance Commissioners (NAIC))
- 67.1%
- Rise in average renters premium in 2022, ending seven annual declines (2022, Insurance Information Institute (Triple-I), compiling NAIC data)
- 0.6%
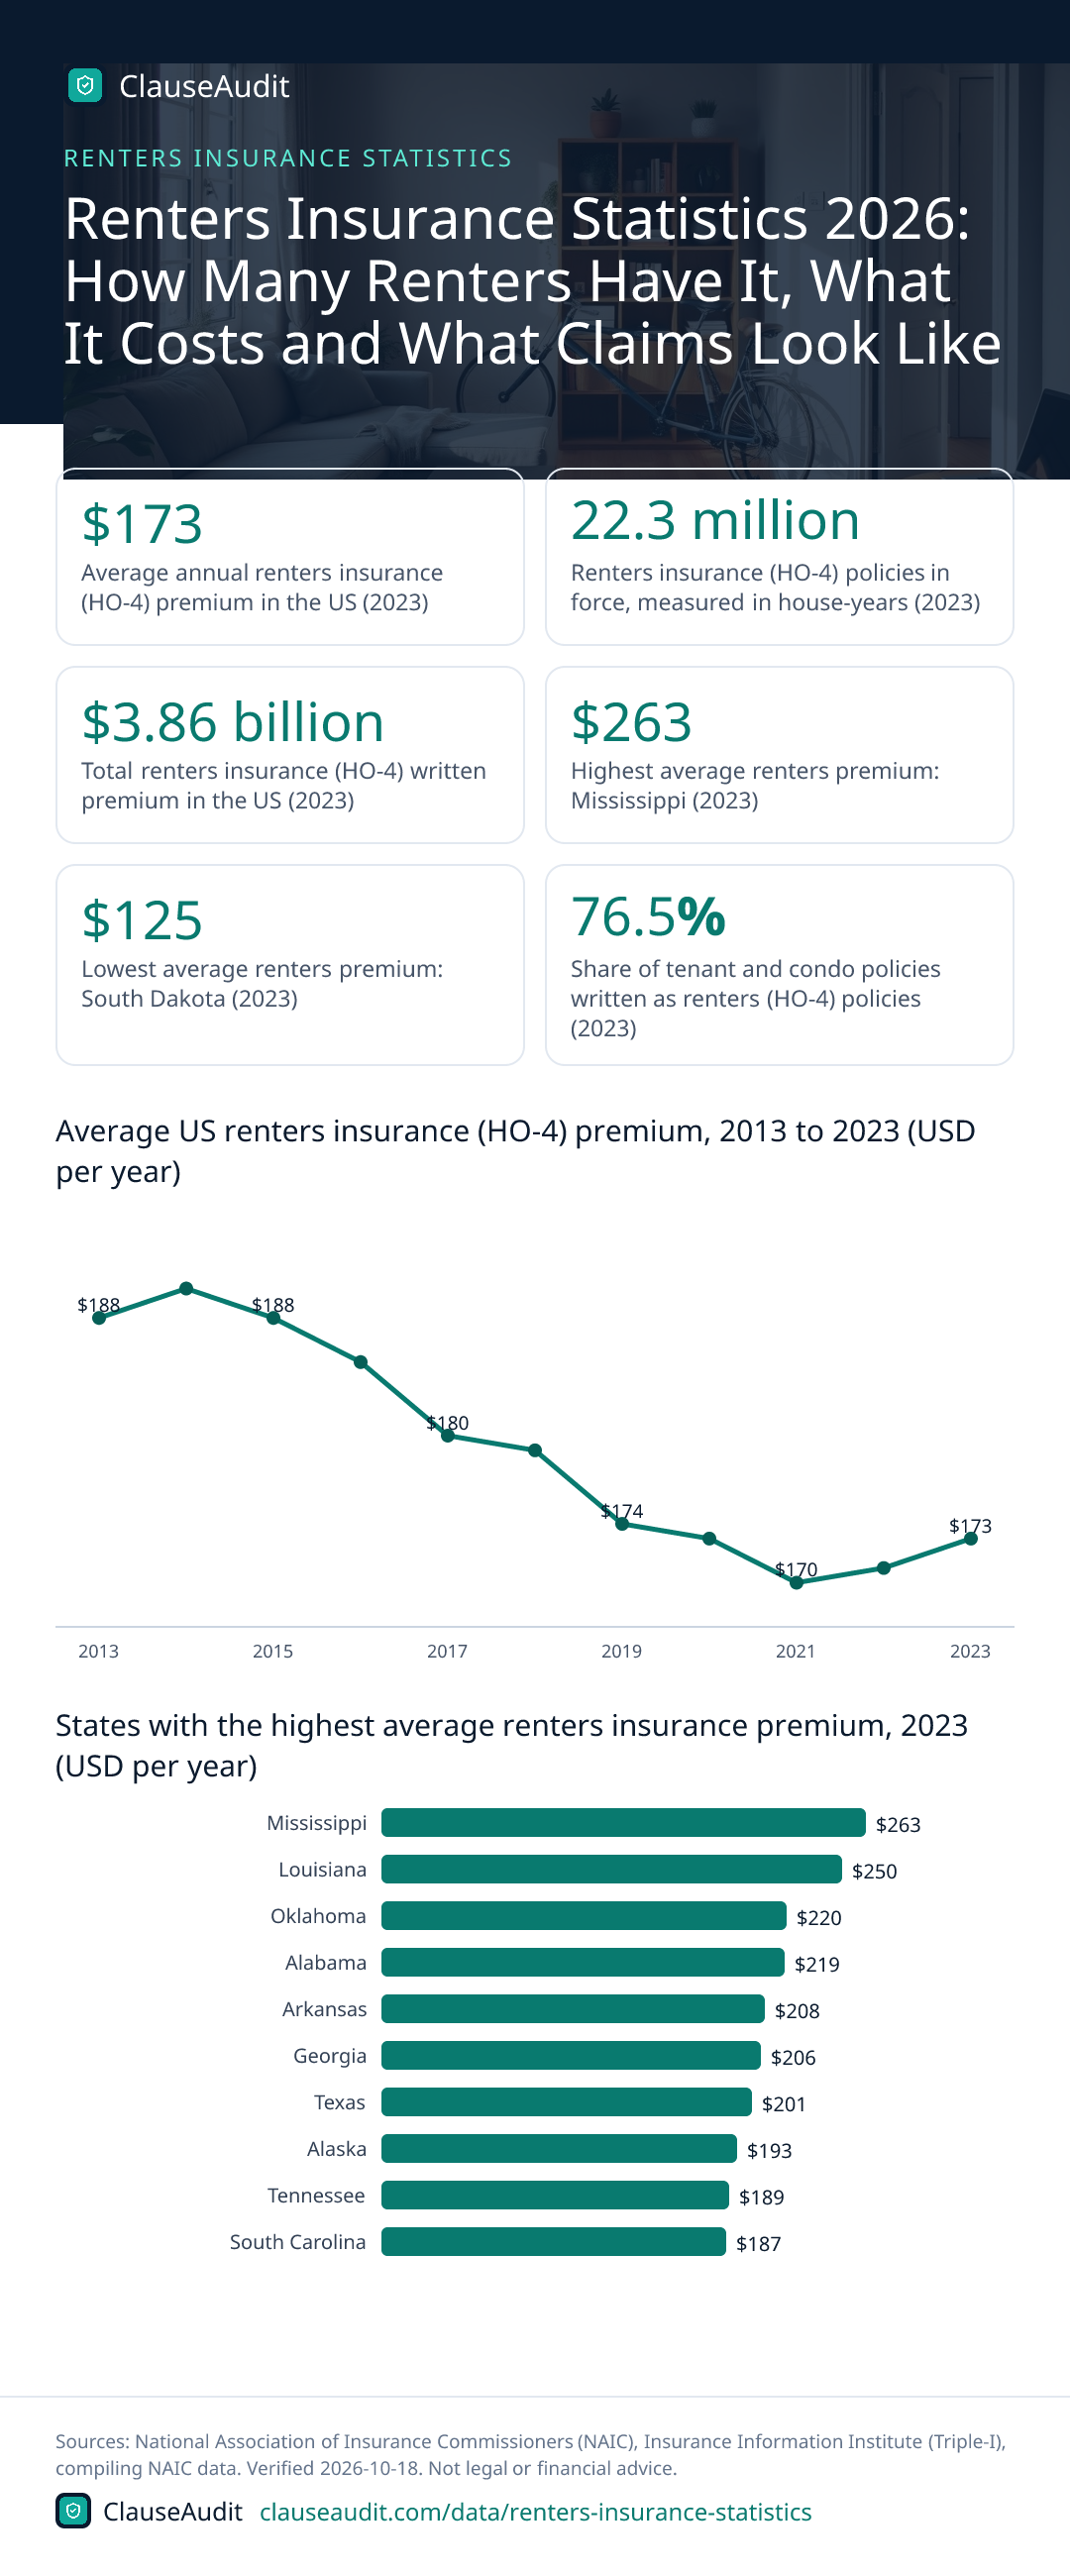
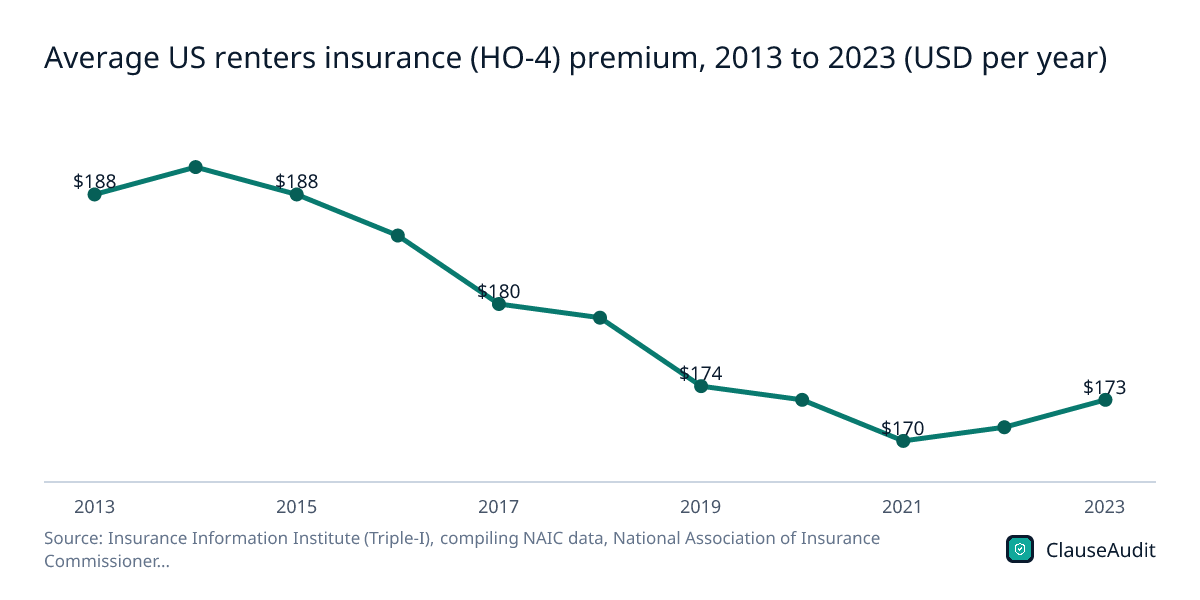
Renters insurance costs less than it did a decade ago. The national average was $188 in 2013 and $173 in 2023, according to NAIC data built from figures insurers report to state regulators.
The bigger story is coverage. Most renters buy a small policy, and the numbers below show how small. Read on for what the figures mean, what a claim actually pays for, and which lease clauses decide how much insurance you need.
The average fell every year from $190 in 2014 to $170 in 2021. It rose 0.6% in 2022, the first increase after seven annual declines, and reached $173 in 2023.
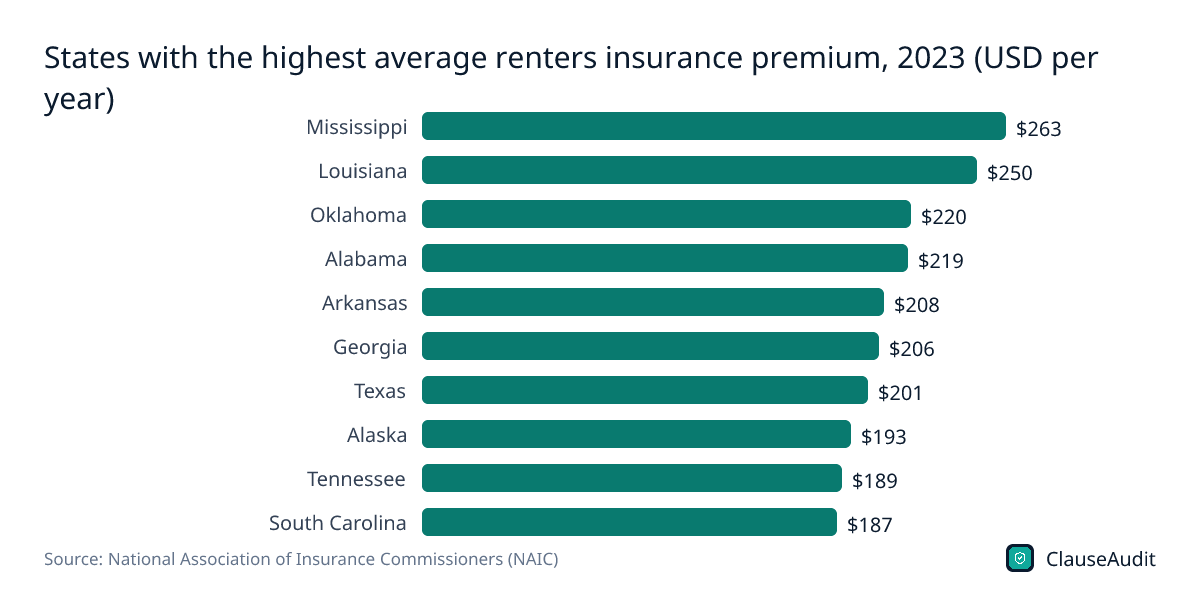
Download this chart (PNG)States with the highest average renters insurance premium, 2023 (USD per year)
Chart data
| Label | Value |
|---|---|
| Mississippi | $263 |
| Louisiana | $250 |
| Oklahoma | $220 |
| Alabama | $219 |
| Arkansas | $208 |
| Georgia | $206 |
| Texas | $201 |
| Alaska | $193 |
| Tennessee | $189 |
| South Carolina | $187 |
The priciest states cluster in the South. Mississippi ($263) and Louisiana ($250) lead, and Texas, the second-largest renters market by policies, still averaged $201.
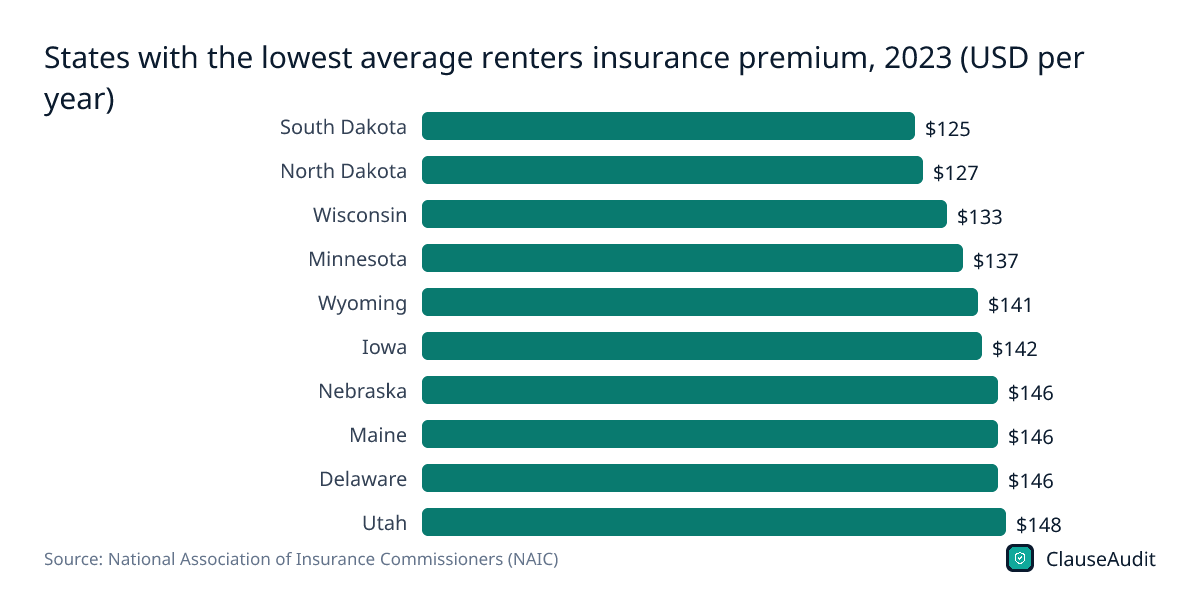
Download this chart (PNG)States with the lowest average renters insurance premium, 2023 (USD per year)
Chart data
| Label | Value |
|---|---|
| South Dakota | $125 |
| North Dakota | $127 |
| Wisconsin | $133 |
| Minnesota | $137 |
| Wyoming | $141 |
| Iowa | $142 |
| Nebraska | $146 |
| Maine | $146 |
| Delaware | $146 |
| Utah | $148 |
The cheapest states sit mostly in the upper Midwest and Plains. South Dakota ($125) and North Dakota ($127) lead, with Wisconsin ($133) and Minnesota ($137) close behind.
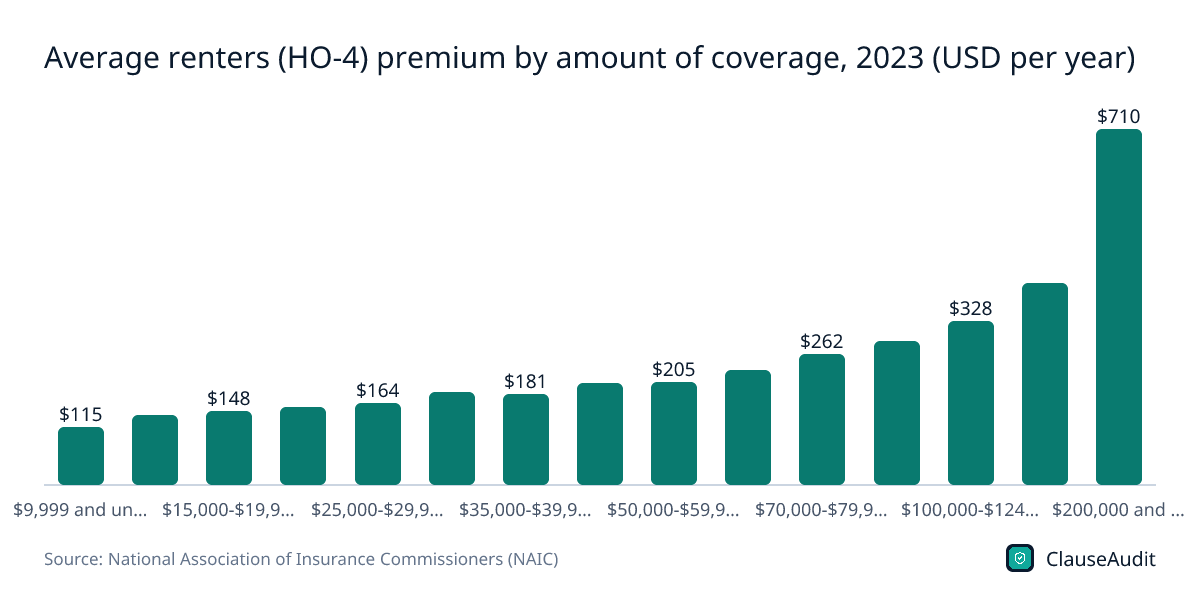
Download this chart (PNG)Price climbs slowly through the middle bands. A policy in the $20,000 to $24,999 band averaged $156, while doubling coverage to the $50,000 to $59,999 band averaged $205.
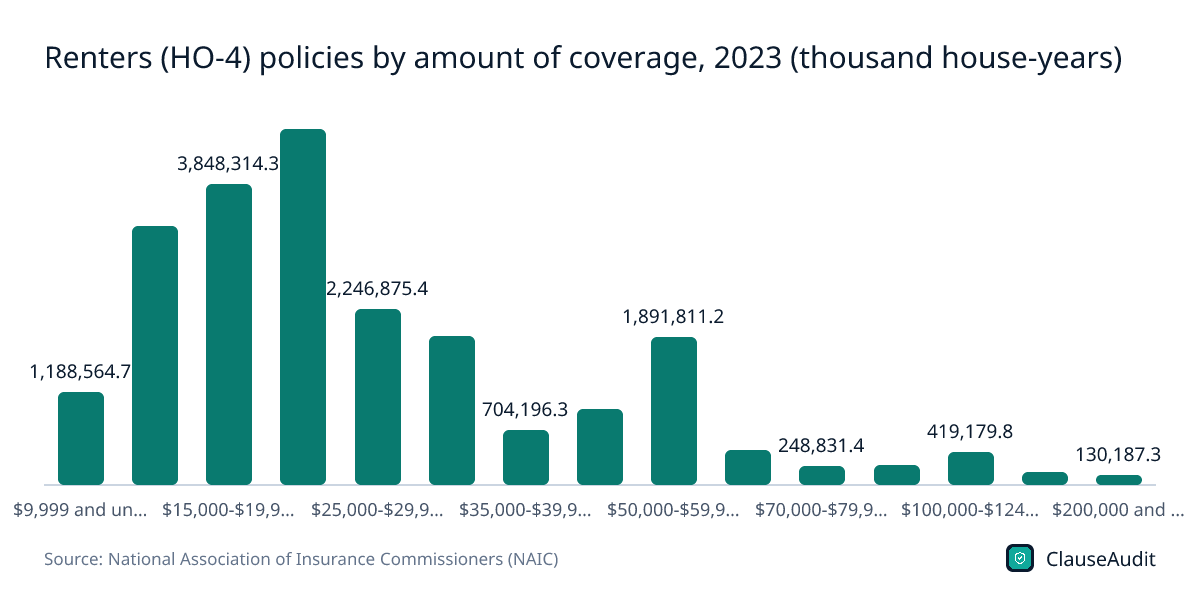
Download this chart (PNG)Renters (HO-4) policies by amount of coverage, 2023 (thousand house-years)
Chart data
| Label | Value (thousand house-years) |
|---|---|
| $9,999 and under | 1,188,564.7 |
| $10,000-$14,999 | 3,317,821.8 |
| $15,000-$19,999 | 3,848,314.3 |
| $20,000-$24,999 | 4,556,087.2 |
| $25,000-$29,999 | 2,246,875.4 |
| $30,000-$34,999 | 1,905,403.8 |
| $35,000-$39,999 | 704,196.3 |
| $40,000-$49,999 | 967,725.2 |
| $50,000-$59,999 | 1,891,811.2 |
| $60,000-$69,999 | 450,957.4 |
| $70,000-$79,999 | 248,831.4 |
| $80,000-$99,999 | 256,318.8 |
| $100,000-$124,999 | 419,179.8 |
| $125,000-$199,999 | 169,658.8 |
| $200,000 and over | 130,187.3 |
The most common band was $20,000 to $24,999. Very few renters insure for $100,000 or more.
Download this chart (PNG)Average renters insurance (HO-4) premium and policies by state, 2023
| State | Average HO-4 premium | HO-4 house-years | Rank (1 = highest) |
|---|---|---|---|
| Mississippi | $263 | 78,889.8 | 1 |
| Louisiana | $250 | 161,964.5 | 2 |
| Oklahoma | $220 | 182,087.2 | 3 |
| Alabama | $219 | 221,095.2 | 4 |
| Arkansas | $208 | 115,933.3 | 5 |
| Georgia | $206 | 747,276.1 | 6 |
| Texas | $201 | 2,274,574.8 | 7 |
| Alaska | $193 | 39,933.3 | 8 |
| Tennessee | $189 | 428,684.4 | 9 |
| South Carolina | $187 | 299,068.8 | 10 |
| Florida | $186 | 1,140,303.5 | 11 |
| Rhode Island | $184 | 55,050.6 | 12 |
| Massachusetts | $180 | 452,864.6 | 13 |
| Hawaii | $178 | 88,185.9 | 14 |
| Michigan | $178 | 616,684.5 | 14 |
| Connecticut | $177 | 232,372.2 | 16 |
| New Mexico | $177 | 89,602.9 | 16 |
| New York | $176 | 1,132,785.3 | 18 |
| Nevada | $174 | 271,388.5 | 19 |
| North Carolina | $174 | 625,767.3 | 19 |
| Missouri | $173 | 430,413.7 | 21 |
| West Virginia | $172 | 61,462.8 | 22 |
| California | $171 | 2,994,585.4 | 23 |
| Indiana | $167 | 388,826.8 | 24 |
| Arizona | $166 | 513,541.4 | 25 |
| Colorado | $166 | 555,939.3 | 25 |
| Washington | $165 | 769,175.3 | 27 |
| Kansas | $163 | 220,699.7 | 28 |
| Montana | $163 | 82,196.3 | 28 |
| Ohio | $163 | 756,037.5 | 28 |
| Maryland | $162 | 519,838.2 | 31 |
| Kentucky | $160 | 277,122.5 | 32 |
| Oregon | $160 | 399,820.0 | 32 |
| Virginia | $158 | 717,775.2 | 34 |
| District of Columbia | $155 | 120,378.4 | 35 |
| Illinois | $155 | 686,696.8 | 35 |
| Vermont | $155 | 36,823.9 | 35 |
| New Hampshire | $153 | 87,383.2 | 38 |
| Pennsylvania | $153 | 894,456.8 | 38 |
| Idaho | $152 | 119,440.3 | 40 |
| New Jersey | $151 | 554,176.8 | 41 |
| Utah | $148 | 217,866.6 | 42 |
| Delaware | $146 | 74,538.7 | 43 |
| Maine | $146 | 74,844.0 | 43 |
| Nebraska | $146 | 162,143.3 | 43 |
| Iowa | $142 | 200,819.3 | 46 |
| Wyoming | $141 | 30,343.3 | 47 |
| Minnesota | $137 | 473,452.6 | 48 |
| Wisconsin | $133 | 474,095.8 | 49 |
| North Dakota | $127 | 79,173.3 | 50 |
| South Dakota | $125 | 73,354.1 | 51 |
| United States | $173 | 22,301,933.3 | - |
Source: National Association of Insurance Commissioners (NAIC), Dwelling Fire, Homeowners Owner-Occupied, and Homeowners Tenant and Condominium/Cooperative Unit Owner's Insurance Report: Data for 2023. Download as image
How many renters have renters insurance?
Regulators don't count people. They count house-years, which means one home insured for one full year. In 2023 there were 22.3 million house-years of renters (HO-4) coverage in the US, and those policies brought in $3.86 billion in premium.
That measures insured homes over time, not the share of renters who have coverage. A household that moved twice in a year and bought a new policy each time shows up as parts of a house-year, not as extra people.
Renters policies are the clear majority of their category. HO-4 made up 76.5% of tenant and condo unit policies in 2023, with the rest written for condo and co-op unit owners. If you rent and have a policy, you are in the bigger group, not a niche one.
For a landlord or property manager, the size of this market is a signal that renters insurance is a normal ask. A lease requirement is easier to live with when the required limits are reasonable and clearly stated.
How much does renters insurance cost per year?
The average US renters policy cost $173 in 2023. Your state matters more than you might expect. Mississippi averaged $263 and South Dakota averaged $125, so the same apartment and the same belongings can cost twice as much to insure depending on where they sit.
Big states pull the national number around. California averaged $171, New York $176, Florida $186 and Texas $201. If you are moving from Minnesota ($137) to Georgia ($206), expect your quote to climb even with the same stuff and the same coverage.
Your own choices move the price too. The coverage limit you pick is one of the biggest levers you control, followed by your deductible and any riders you add for things like jewelry or bikes.
A useful habit: look up your state in the table above before you shop. If your quote sits far above your state's average, ask why. It may be a high coverage limit, a low deductible, a past claim or simply an insurer that prices your ZIP code harder than its competitors.
Are most renters underinsured?
Probably. In 2023, 67.1% of renters and condo policies carried less than $35,000 in coverage. The single most common band for renters was $20,000 to $24,999.
Try a quick count. Add up your laptop, phone, bed, couch, clothes, kitchen gear and anything with a cord. You may land above the $20,000 to $24,999 band, especially once you price replacing it all new rather than what you could sell it for secondhand.
The cost of closing that gap is small. The average premium for a $20,000 to $24,999 policy was $156. For $50,000 to $59,999 it was $205. That is a modest step up for roughly twice the protection.
Underinsurance hurts most after a total loss, like a fire that takes the whole unit. A small theft rarely tests your limit. A burned-out apartment does, and that is when a $20,000 policy can run out halfway through replacing a household.
Why does renters insurance cost more in some states?
Look at the top of the list and a pattern jumps out. Mississippi, Louisiana, Oklahoma, Alabama and Arkansas all averaged $208 or more in 2023. Storms, hail and wind drive many claims across the South, and those losses flow into the price of every policy written there.
Local costs matter too. Theft rates, the price of contractors and hotel stays, and how often people sue over injuries all feed into what an insurer charges. State rules on how insurers file and justify rates also play a part.
Population does not explain it. California has the most renters policies in the country and averaged $171, close to the national figure. Wisconsin and Minnesota, both sizable markets, sit near the bottom at $133 and $137.
What do renters insurance claims look like?
The NAIC figures on this page cover policies and premiums, not claim counts, so treat this part as a practical guide rather than a statistic. A typical renters policy pays in three ways.
Watch the gaps. Flood and earthquake damage are usually excluded and need separate coverage. Your landlord's policy covers the building, not your belongings, which surprises a lot of first-time renters after a burst pipe.
- Personal property: theft, fire, smoke and many kinds of sudden water damage to your belongings, at home or away.
- Liability: if a guest is hurt in your unit or you accidentally damage someone else's property, such as water leaking into the unit below.
- Loss of use: hotel and extra living costs if your apartment becomes unlivable after a covered event.
What should a renter or small business owner do with these numbers?
The national numbers are a starting point. What matters is how your policy and your lease fit together. A few steps cover most of it.
- Price your belongings at replacement cost, then pick a limit above that total. The most common band is probably too low for you.
- Ask for replacement cost coverage instead of actual cash value, so an old laptop pays out what a new one costs.
- Check your lease for a required liability amount and whether the landlord must be listed as an interested party.
- If you run a business from your apartment, ask your insurer if business equipment and client visits are covered. Many renters policies limit both, and a freelancer with two monitors and a camera kit can hit that cap fast.
- Compare quotes each renewal. Prices vary a lot by state and by company, and the national average only tells you where the middle is.
- Keep a simple inventory: a phone video walking through each room and a folder of receipts makes any claim faster and less of a fight.
How ClauseAudit helps
Your lease often decides how much insurance you need and who pays when something breaks. A clause can require a policy, set a minimum liability limit, or quietly shift repair and damage costs onto you.
Upload your lease and our automated review flags these terms in plain English, with suggested changes you can bring to your landlord before you sign.
- Insurance requirement: if you must carry a policy, the minimum liability amount, and if the landlord must be named on it
- Repair and damage clauses that make you pay for appliances or building damage your policy may not cover
- Liability and indemnity language that holds you responsible for the landlord's own negligence
- Waivers of the landlord's duty to keep the unit livable, which many states void
- Late fees and charges tied to insurance lapses or proof-of-coverage deadlines
- Subletting and guest rules that could affect who is covered in the unit
Frequently asked questions
How much is renters insurance on average?
The average US renters (HO-4) policy cost $173 a year in 2023, based on NAIC data from state insurance filings. Prices ranged from $125 in South Dakota to $263 in Mississippi. Your quote depends on your state, the coverage limit you choose, your deductible and any riders you add.
How many people have renters insurance in the US?
Regulators track policies, not people. In 2023 there were 22.3 million house-years of renters coverage in force, meaning one home insured for one year. That figure tells you the size of the market, but it is not the same as the share of renters who are covered.
Has renters insurance gotten more expensive?
Only slightly, and only recently. The national average fell from $188 in 2013 to $170 in 2021. It rose 0.6% in 2022, ending seven straight years of declines, and stood at $173 in 2023. Next to rent, it is still a small bill.
How much renters insurance coverage do I need?
Enough to replace everything you own at today's prices, plus a liability limit that matches or beats what your lease requires. Most renters fall short: 67.1% of renters and condo policies carried under $35,000 in coverage in 2023. List your belongings room by room to find your real number.
Is it expensive to raise my coverage limit?
Usually not. In 2023 the average premium for a $20,000 to $24,999 policy was $156, while a $50,000 to $59,999 policy averaged $205. You roughly double your protection for a modest increase. Get quotes at a few limits before you settle on one.
Which state has the most expensive renters insurance?
Mississippi, at $263 a year on average in 2023. Louisiana was next at $250, followed by Oklahoma at $220 and Alabama at $219. Weather risk, local claim costs and state rules all push prices up across much of the South.
Can my landlord require renters insurance?
In most states, yes, as long as the lease says so. Landlords often set a minimum liability amount and ask for proof each year. Read the clause closely: check the required limit, the deadline for proof, and any fee if your policy lapses.
Does my landlord's insurance cover my stuff?
No. Your landlord's policy covers the building and their own liability. If a fire, break-in or burst pipe damages your furniture or electronics, your own renters policy is what normally pays. It can also cover hotel costs while your unit is repaired.
Use this data
Every chart and card below is free to reuse under CC BY 4.0. Download what you need and link back to this page.
 Stat cards
 Key findings card
 Infographic
 Average US renters insurance (HO-4) premium, 2013 to 2023 (USD per year)
 States with the highest average renters insurance premium, 2023 (USD per year)
 States with the lowest average renters insurance premium, 2023 (USD per year)
 Average renters (HO-4) premium by amount of coverage, 2023 (USD per year)
 Renters (HO-4) policies by amount of coverage, 2023 (thousand house-years)
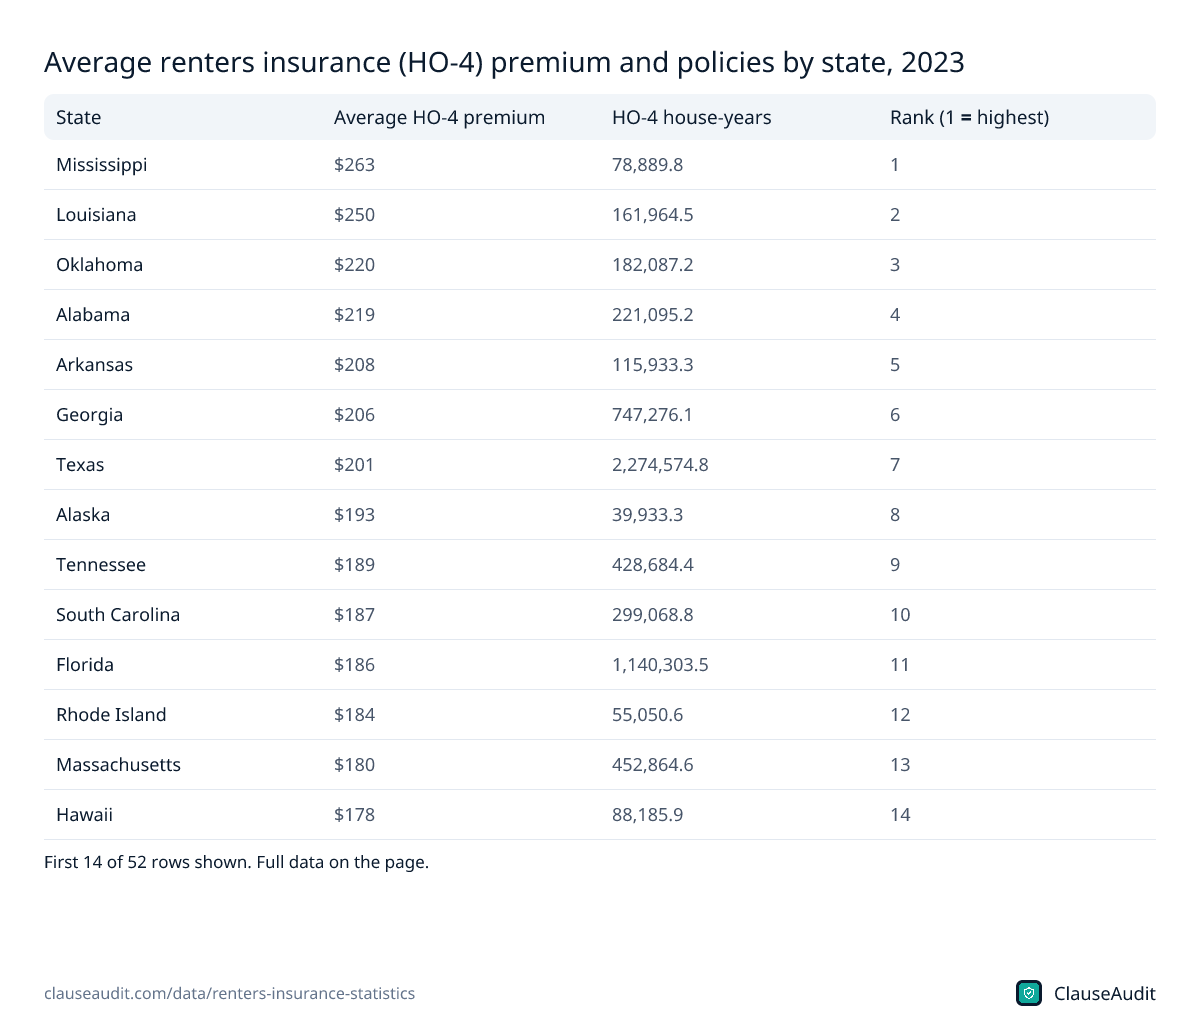 Average renters insurance (HO-4) premium and policies by state, 2023
Embed the infographic
Free to share on your site, blog or slides under CC BY 4.0. Please keep the credit link.
Sources and method
Every number on this page comes from the sources below, each opened and read on or before October 18, 2026. A second, independent review checked every figure against its source and corrected anything that did not match. Figures that could not be confirmed were left out.
- National Association of Insurance Commissioners (NAIC), Dwelling Fire, Homeowners Owner-Occupied, and Homeowners Tenant and Condominium/Cooperative Unit Owner's Insurance Report: Data for 2023 (July 2026 (data for 2023))
- Insurance Information Institute (Triple-I), compiling NAIC data, Facts + Statistics: Homeowners and renters insurance (Accessed 2026-10-18 (NAIC data through 2022))
Cite this page
ClauseAudit, “Renters Insurance Statistics 2026: How Many Renters Have It, What It Costs and What Claims Look Like”, updated October 18, 2026, https://clauseaudit.com/data/renters-insurance-statistics. Free to reuse with a link back (CC BY 4.0).
This page summarises published data and law as checked on October 18, 2026. Figures are updated as new editions are released, and your own situation may differ. It is general information, not legal, tax or financial advice.