Average Renters Insurance Cost by State: What Tenants Paid in 2023
By ClauseAudit Research · 2 sources ·
What is the average renters insurance cost by state?
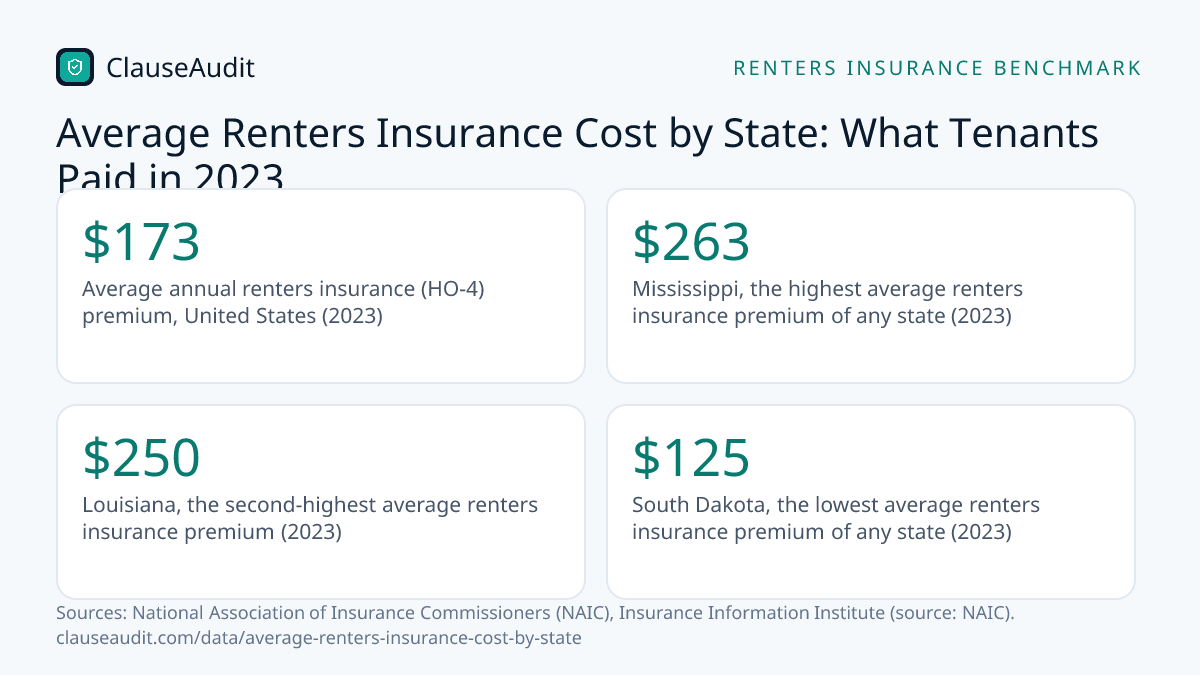
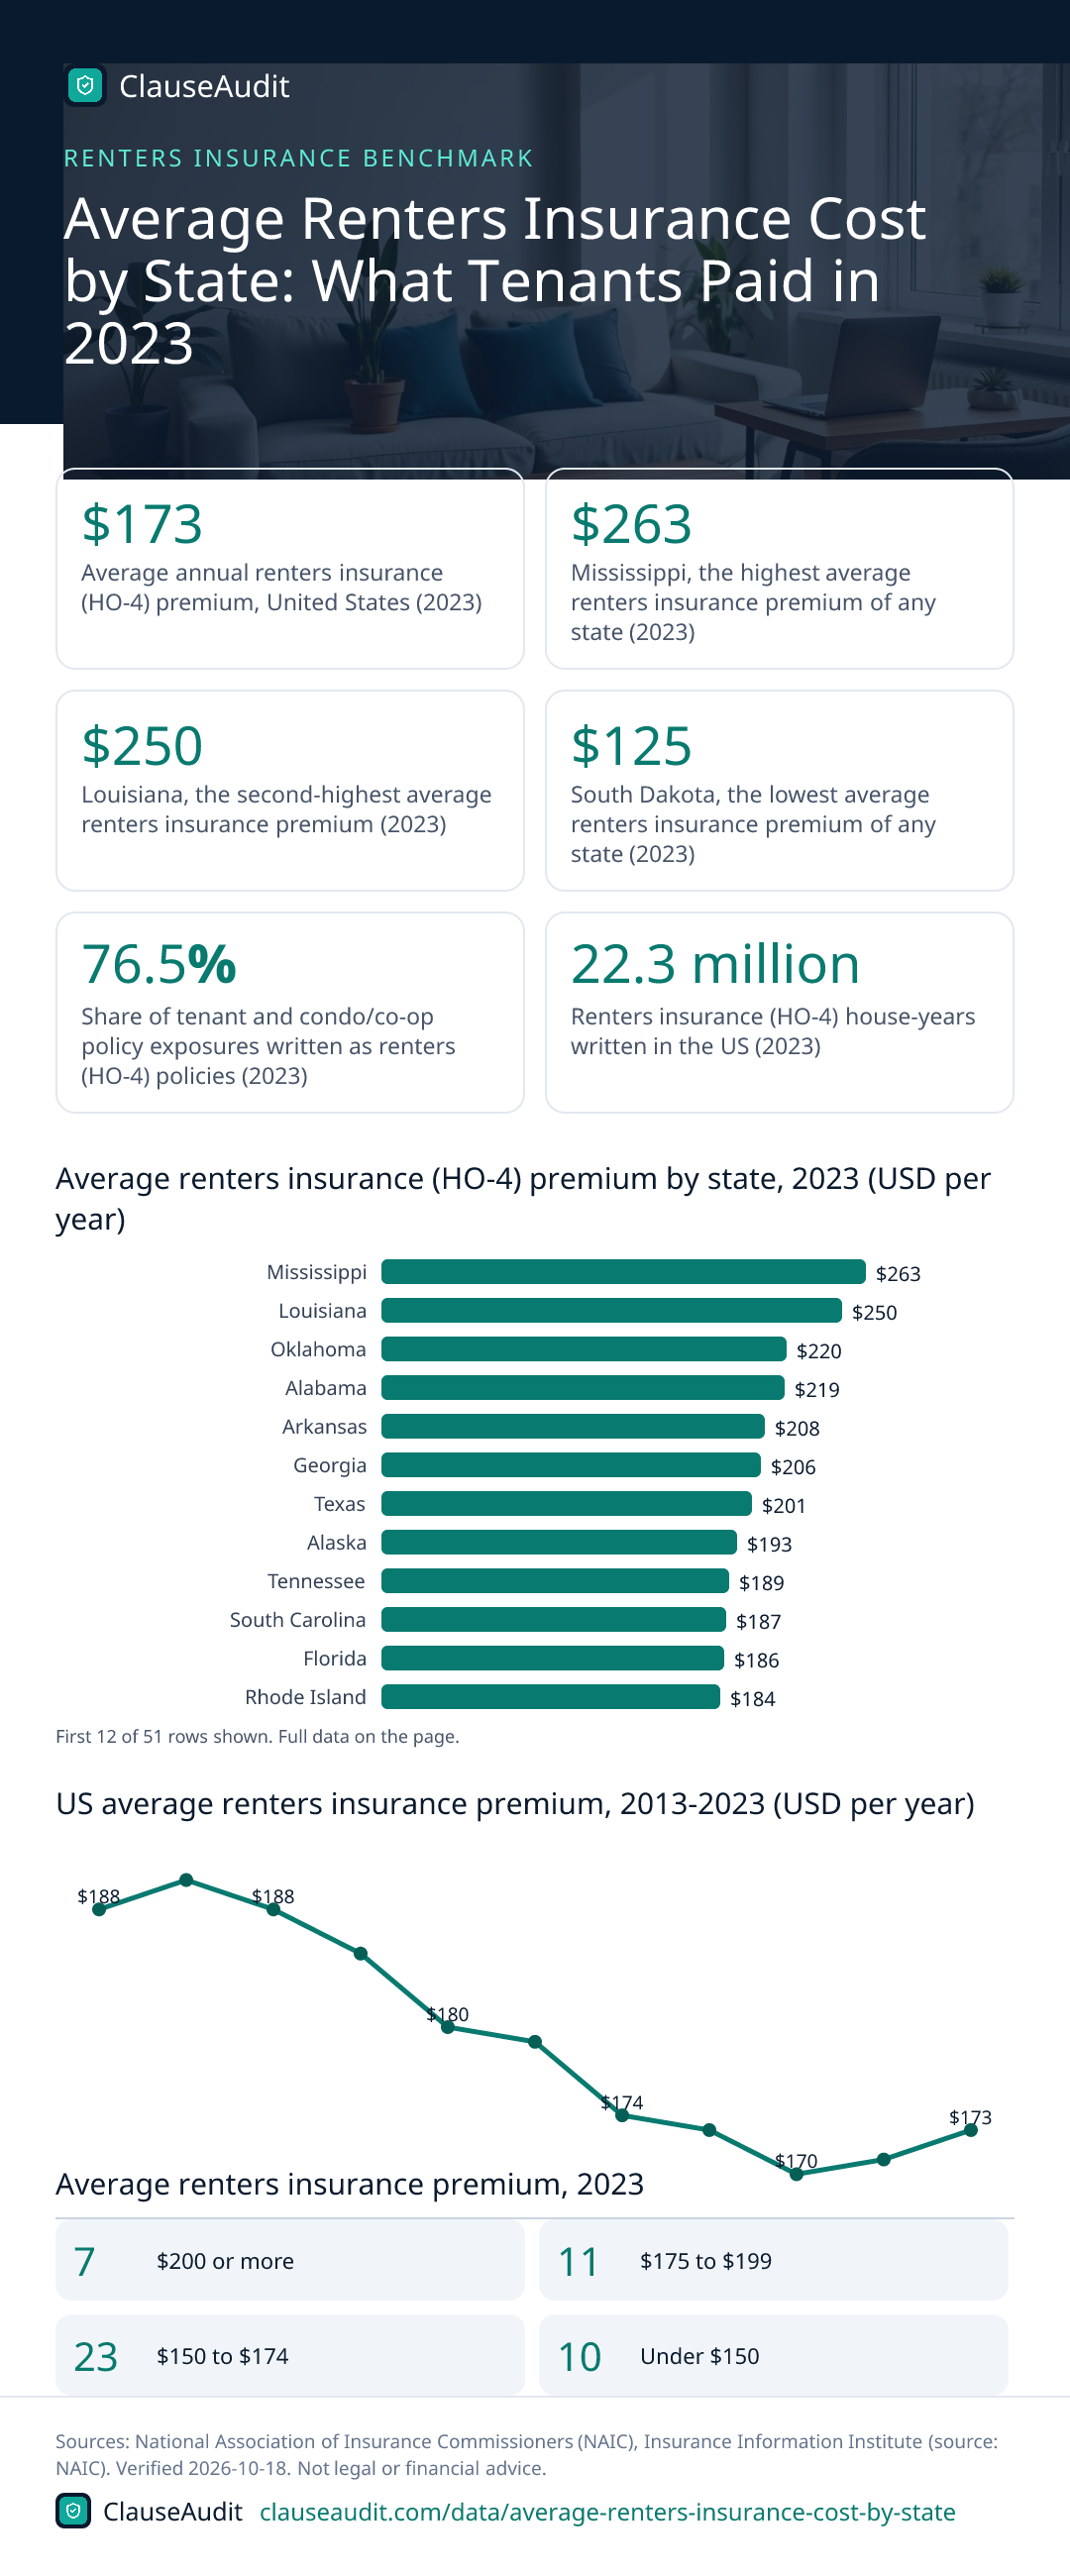
Renters insurance cost $173 a year on average in the US in 2023, per NAIC data, but your state moves that number a lot. Mississippi was the most expensive at $263, followed by Louisiana at $250. South Dakota was the cheapest at $125, with North Dakota close behind at $127.

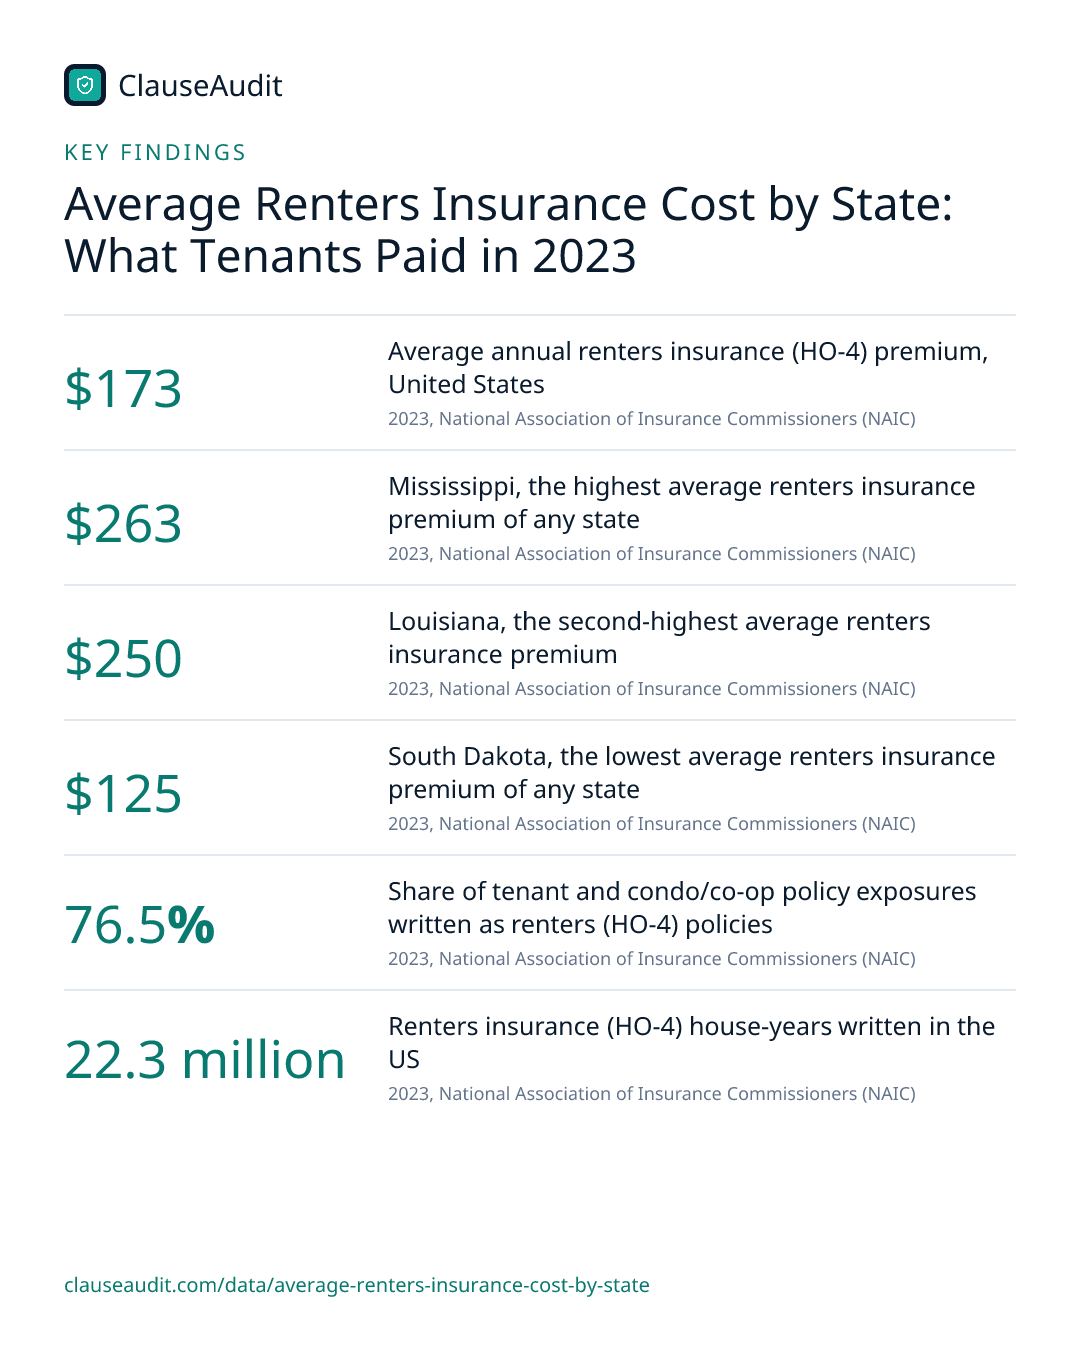
- Average annual renters insurance (HO-4) premium, United States (2023, National Association of Insurance Commissioners (NAIC))
- $173
- Mississippi, the highest average renters insurance premium of any state (2023, National Association of Insurance Commissioners (NAIC))
- $263
- Louisiana, the second-highest average renters insurance premium (2023, National Association of Insurance Commissioners (NAIC))
- $250
- South Dakota, the lowest average renters insurance premium of any state (2023, National Association of Insurance Commissioners (NAIC))
- $125
- Share of tenant and condo/co-op policy exposures written as renters (HO-4) policies (2023, National Association of Insurance Commissioners (NAIC))
- 76.5%
- Renters insurance (HO-4) house-years written in the US (2023, National Association of Insurance Commissioners (NAIC))
- 22.3 million
- Share of renters and condo policy exposures with coverage below $35,000 (2023, National Association of Insurance Commissioners (NAIC))
- 67.1%
- Average annual renters insurance premium, United States, prior year (2022, Insurance Information Institute (source: NAIC))
- $171
Renters insurance is cheap almost everywhere. Where you live still decides if you pay something near $125 or something near $263 a year. Those are the 2023 extremes, South Dakota and Mississippi, from the latest NAIC report, published in July 2026.
Use the map and table to find your state. The rest of this page explains why the gap exists, how much coverage to buy, and what to look for in your lease, since many leases make a policy a condition of renting.
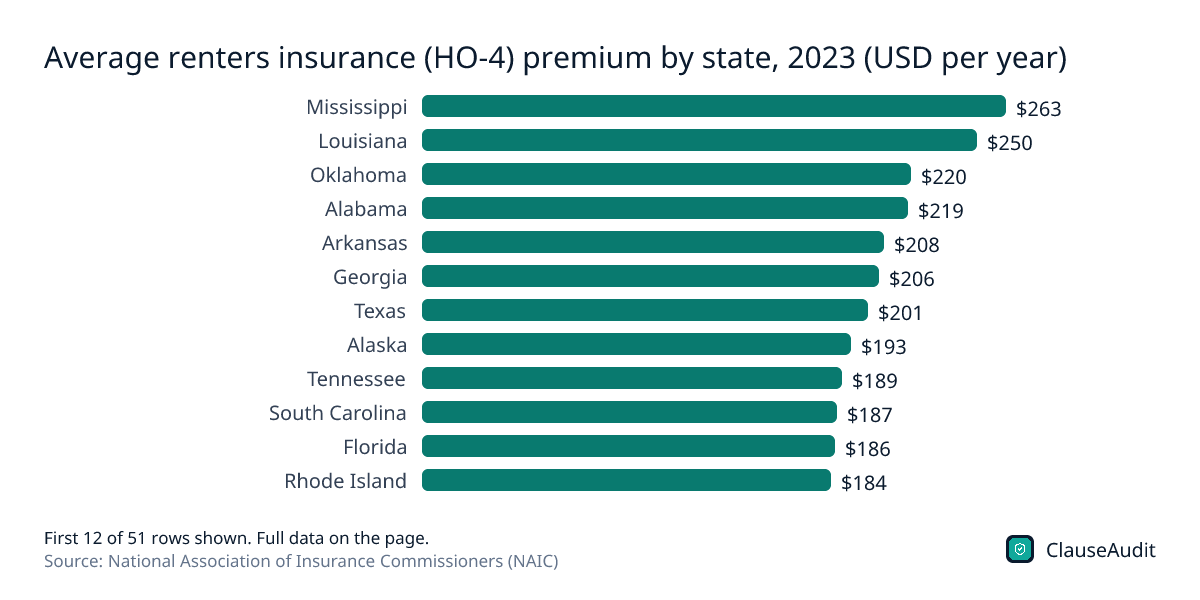
Average renters insurance (HO-4) premium by state, 2023 (USD per year)
Chart data
| Label | Value |
|---|---|
| Mississippi | $263 |
| Louisiana | $250 |
| Oklahoma | $220 |
| Alabama | $219 |
| Arkansas | $208 |
| Georgia | $206 |
| Texas | $201 |
| Alaska | $193 |
| Tennessee | $189 |
| South Carolina | $187 |
| Florida | $186 |
| Rhode Island | $184 |
| Massachusetts | $180 |
| Hawaii | $178 |
| Michigan | $178 |
| Connecticut | $177 |
| New Mexico | $177 |
| New York | $176 |
| Nevada | $174 |
| North Carolina | $174 |
| Missouri | $173 |
| West Virginia | $172 |
| California | $171 |
| Indiana | $167 |
| Arizona | $166 |
| Colorado | $166 |
| Washington | $165 |
| Kansas | $163 |
| Montana | $163 |
| Ohio | $163 |
| Maryland | $162 |
| Kentucky | $160 |
| Oregon | $160 |
| Virginia | $158 |
| District of Columbia | $155 |
| Illinois | $155 |
| Vermont | $155 |
| New Hampshire | $153 |
| Pennsylvania | $153 |
| Idaho | $152 |
| New Jersey | $151 |
| Utah | $148 |
| Delaware | $146 |
| Maine | $146 |
| Nebraska | $146 |
| Iowa | $142 |
| Wyoming | $141 |
| Minnesota | $137 |
| Wisconsin | $133 |
| North Dakota | $127 |
| South Dakota | $125 |
Every state above $200 is in the South: Mississippi, Louisiana, Oklahoma, Alabama, Arkansas, Georgia and Texas. The bottom is the upper Midwest, with Minnesota, Wisconsin, North Dakota and South Dakota all under $140.
Download this chart (PNG)US average renters insurance premium, 2013-2023 (USD per year)
Chart data
| Label | Value (USD per year) |
|---|---|
| 2013 | $188 |
| 2014 | $190 |
| 2015 | $188 |
| 2016 | $185 |
| 2017 | $180 |
| 2018 | $179 |
| 2019 | $174 |
| 2020 | $173 |
| 2021 | $170 |
| 2022 | $171 |
| 2023 | $173 |
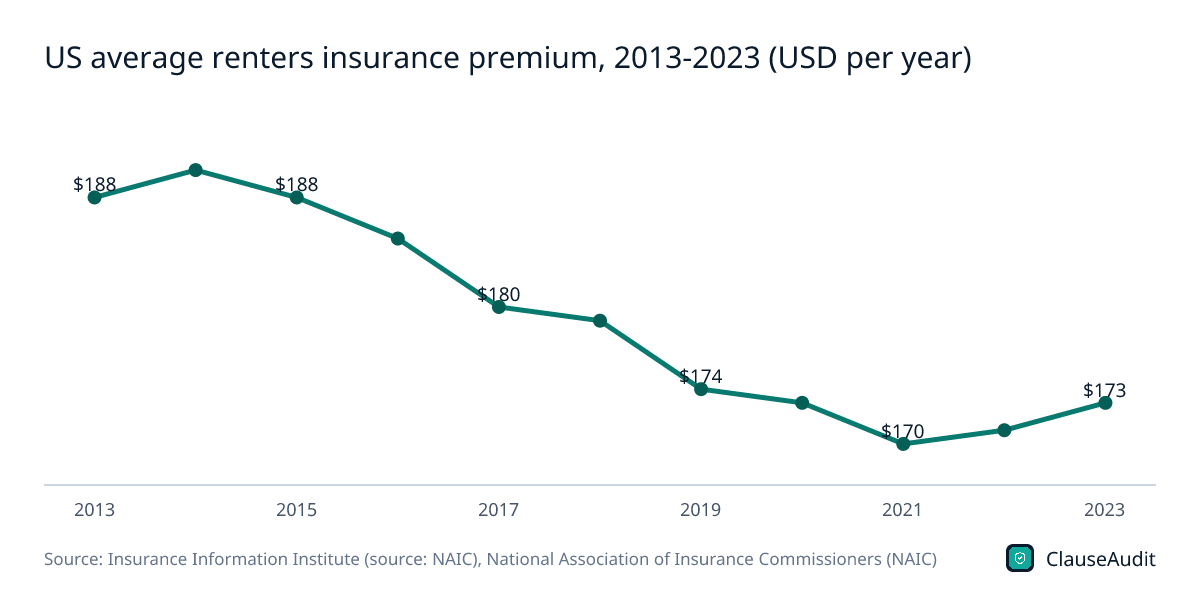
The national average drifted down from $188 in 2013 (after a peak of $190 in 2014) to $170 in 2021, then ticked back up to $173 by 2023. Over a decade when rents climbed, this bill got slightly cheaper.
Download this chart (PNG)US average renters insurance premium by amount of coverage, 2023 (USD per year)
Chart data
| Label | Value (USD per year) |
|---|---|
| $9,999 and under | $115 |
| $10,000-$14,999 | $140 |
| $15,000-$19,999 | $148 |
| $20,000-$24,999 | $156 |
| $25,000-$29,999 | $164 |
| $30,000-$34,999 | $185 |
| $35,000-$39,999 | $181 |
| $40,000-$49,999 | $204 |
| $50,000-$59,999 | $205 |
| $60,000-$69,999 | $230 |
| $70,000-$79,999 | $262 |
| $80,000-$99,999 | $288 |
| $100,000-$124,999 | $328 |
| $125,000-$199,999 | $403 |
| $200,000 and over | $710 |
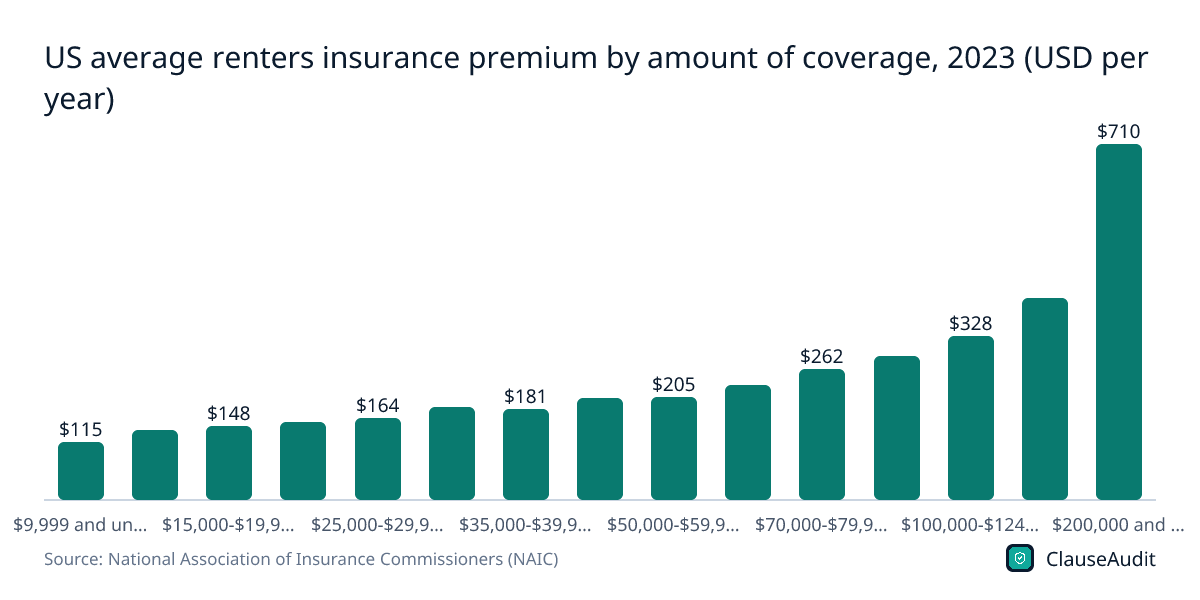
Premiums climb with coverage, but slowly at first. Moving from the $20,000 to $24,999 band ($156) to the $50,000 to $59,999 band ($205) more than doubles your protection for a modest increase in price.
Download this chart (PNG)Change in average renters premium, 2022 to 2023, ten most expensive states (USD per year)
Chart data
| Label | Value |
|---|---|
| Mississippi | +$1 |
| Louisiana | +$7 |
| Oklahoma | +$4 |
| Alabama | $0 |
| Arkansas | +$3 |
| Georgia | +$1 |
| Texas | +$2 |
| Alaska | +$7 |
| Tennessee | +$2 |
| South Carolina | +$1 |
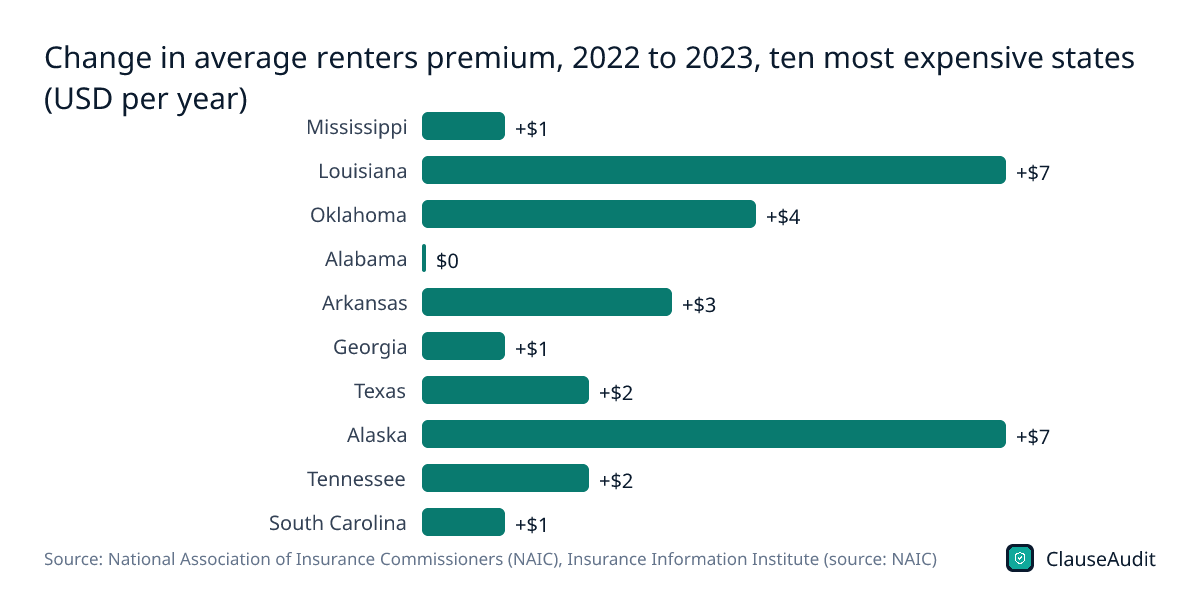
Even in the priciest states, year-over-year moves were small. Louisiana and Alaska rose $7, while Alabama did not change at all.
Download this chart (PNG)US renters insurance (HO-4) by amount of coverage, 2023
| Amount of insurance | House-years | Average premium |
|---|---|---|
| $9,999 and under | 1,188,564.7 | $115 |
| $10,000-$14,999 | 3,317,821.8 | $140 |
| $15,000-$19,999 | 3,848,314.3 | $148 |
| $20,000-$24,999 | 4,556,087.2 | $156 |
| $25,000-$29,999 | 2,246,875.4 | $164 |
| $30,000-$34,999 | 1,905,403.8 | $185 |
| $35,000-$39,999 | 704,196.3 | $181 |
| $40,000-$49,999 | 967,725.2 | $204 |
| $50,000-$59,999 | 1,891,811.2 | $205 |
| $60,000-$69,999 | 450,957.4 | $230 |
| $70,000-$79,999 | 248,831.4 | $262 |
| $80,000-$99,999 | 256,318.8 | $288 |
| $100,000-$124,999 | 419,179.8 | $328 |
| $125,000-$199,999 | 169,658.8 | $403 |
| $200,000 and over | 130,187.3 | $710 |
| Total | 22,301,933.3 | $173 |
Source: National Association of Insurance Commissioners (NAIC), Dwelling Fire, Homeowners Owner-Occupied, and Homeowners Tenant and Condominium/Cooperative Unit Owner's Insurance Report: Data for 2023. Download as image
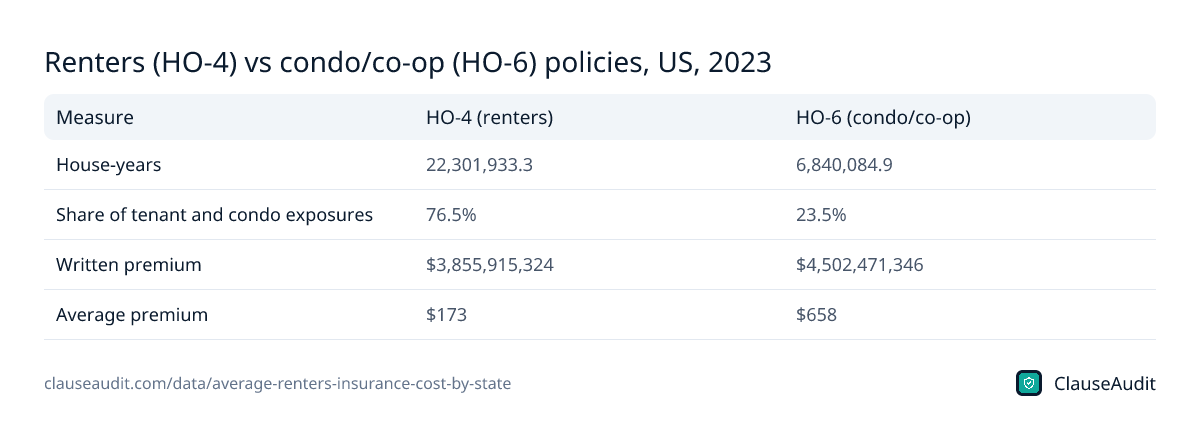
Renters (HO-4) vs condo/co-op (HO-6) policies, US, 2023
| Measure | HO-4 (renters) | HO-6 (condo/co-op) |
|---|---|---|
| House-years | 22,301,933.3 | 6,840,084.9 |
| Share of tenant and condo exposures | 76.5% | 23.5% |
| Written premium | $3,855,915,324 | $4,502,471,346 |
| Average premium | $173 | $658 |
Source: National Association of Insurance Commissioners (NAIC), Dwelling Fire, Homeowners Owner-Occupied, and Homeowners Tenant and Condominium/Cooperative Unit Owner's Insurance Report: Data for 2023. Download as image
Average renters insurance premium, 2023 by state
- 7$200 or more
- 11$175 to $199
- 23$150 to $174
- 10Under $150
- $200 or more7
- $175 to $19911
- $150 to $17423
- Under $15010
What is the average cost of renters insurance in my state?
Start with the national figure: $173 a year for a standard tenant policy, known in the industry as an HO-4. The NAIC gets that by dividing total premium by house-years (one house-year is 12 months of coverage), so it is a true average across 22.3 million house-years, not a quote from one company.
Your state will land somewhere between $125 and $263. Most states cluster tightly around the middle. California sits at $171, New York at $176, Florida at $186 and Texas at $201. Illinois and Pennsylvania come in a bit cheaper at $155 and $153.
Keep in mind that a state average is not your price. Your quote depends on your zip code, the building, your deductible, how much coverage you pick, your claims history and in many states your credit. Two renters in the same city can see very different numbers. Treat the state figure as a sanity check. If a quote is far above it, ask why before you buy.
Here is a simple example. Say you just moved from Illinois, where the average was $155, to Georgia, where it was $206. If your new quote comes in around the Georgia figure, that is normal for the market, not a sign you are being overcharged. If it comes in far higher, look at the coverage amount, the deductible and any add-ons first.
Why is renters insurance so expensive in Mississippi and Louisiana?
The NAIC does not explain the gap, but the expensive states share a pattern. Mississippi ($263), Louisiana ($250), Oklahoma ($220), Alabama ($219) and Arkansas ($208) all deal with hurricanes, tornadoes, hail or some mix of them. Renters insurance covers your belongings and your personal liability, not the building, but a storm that tears through an apartment complex can still produce a pile of claims for belongings, and insurers price that risk in.
At the other end, North Dakota at $127 and South Dakota at $125 are the cheapest, with Wisconsin ($133) and Minnesota ($137) not far behind. Theft, liability claims and local repair costs all feed into what insurers charge, so even neighboring states can differ.
Two NAIC footnotes matter here. California's numbers come from the California Department of Insurance, and Texas uses its own policy forms that are similar to, but not the same as, the national ones. Comparisons across states are close, not perfect.
How much renters insurance coverage do I need?
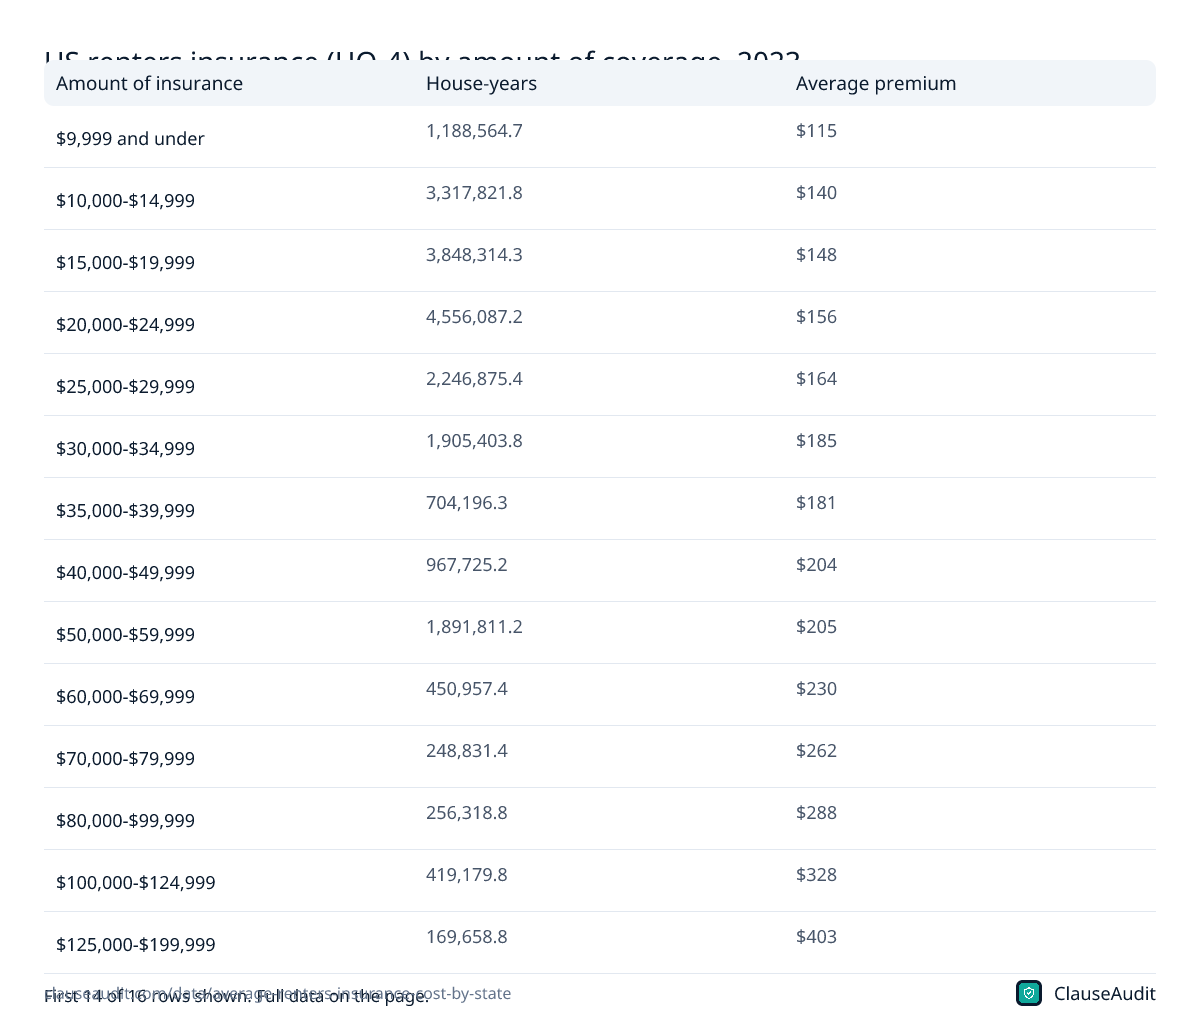
Most renters buy less than they probably should. In 2023, 67.1% of renters and condo policy exposures carried under $35,000 of coverage. The single most popular band was $20,000 to $24,999, which averaged $156 a year.
Do a quick room-by-room count before you pick a number. Price out what it would cost to replace your bed, couch, clothes, kitchen gear, TV and computer at today's prices. People are routinely surprised at how fast it adds up.
The good news is that extra coverage is cheap. A policy in the $50,000 to $59,999 band averaged $205, against $156 for $20,000 to $24,999.
If you freelance or run a small business from your apartment, read the policy closely. Standard renters policies usually cap coverage for business property and often exclude business liability entirely. A laptop you use for client work, a camera kit or inventory stored in a closet may need a home business endorsement or a separate policy.
Does my landlord's insurance cover my stuff?
No, and this is the most common misunderstanding among renters. Your landlord's policy covers the building and the landlord's own liability. If a pipe bursts and ruins your couch, or someone breaks in and takes your laptop, the landlord's insurer generally will not pay you for it.
Your renters policy also covers your personal liability. If a guest trips in your apartment, or you leave the bath running and water pours into the unit below, liability coverage can pay the claim and the legal costs. Many policies also pay for a hotel and meals if a covered loss forces you out while repairs happen.
That liability piece is why landlords care. A lease that requires renters insurance is often really asking you to carry your own liability coverage so small accidents do not land on the owner's policy.
Is renters insurance getting more expensive?
Not much. The national average was $188 in 2013 and $173 in 2023. Between 2022 and 2023 it rose just $2, from $171.
State moves were small in both directions. Colorado rose $8 to $166, and Alaska, Louisiana, Maryland, Massachusetts, Montana and New York each rose $7. Wisconsin fell $8 to $133, and South Dakota slipped $4. Compare that with rent, which for most tenants went up far faster over the same years. For a lot of households, renters insurance is one of the smallest bills tied to their apartment.
That stability is useful when you budget a move. If you are relocating for a job or a new client base, the insurance line will barely change unless you are moving between the cheap Midwest and the expensive Gulf states. Rent, deposits and move-in fees are where the real money goes, so put your negotiating energy there.
What to do before you buy or renew
- Check your state's average on this page, then get at least three quotes. If one is well above the state figure, ask what is driving it.
- Pick a coverage amount from a real inventory of your stuff, not from whatever default the app suggests.
- Ask for replacement cost coverage instead of actual cash value, so a claim pays what it costs to buy new rather than the depreciated value.
- Raise your deductible if you have savings to cover it. It is one of the quickest ways to bring a premium down, and small claims are often not worth filing anyway.
- Bundle with your car insurance if the discount is real, and compare the bundle price against buying each separately.
- Read your lease before you buy. If it sets a liability minimum or asks for the landlord to be listed on the policy, your policy has to match.
How ClauseAudit helps
A lot of leases now say you must carry renters insurance, and the details sit in a clause most people skim. That clause can set a coverage minimum, require proof by move-in day, or let the landlord buy coverage for you and charge you for it.
Upload your lease and the automated review flags the insurance terms and the clauses around them, so you know what you are agreeing to before you sign.
- Required liability limit and if your planned policy meets it
- If the landlord must be named as an additional insured or interested party
- Fees or forced-placement charges if your policy lapses or you miss a proof deadline
- Clauses that push building or appliance damage onto you beyond what insurance covers
- Indemnity and waiver language that shifts the landlord's own negligence to you
- Late fees and penalties that could be triggered by an insurance paperwork issue
Frequently asked questions
Which state has the cheapest renters insurance?
South Dakota had the lowest average renters insurance premium in 2023 at $125 a year, according to NAIC data. North Dakota was a close second at $127. Minnesota and Wisconsin were also among the cheapest. Your own price can still differ, since insurers price by zip code, coverage amount and deductible, not just by state.
Which state has the most expensive renters insurance?
Mississippi, at $263 a year on average in 2023. Louisiana was second at $250, then Oklahoma at $220 and Alabama at $219. These states see frequent hurricanes, tornadoes and hail, which likely push up claims on belongings. Even there, renters insurance usually costs far less than a month of rent.
How much is renters insurance a month?
The NAIC reports averages by year, and the US average was $173 for 2023. Many companies let you pay monthly, so you would split your annual premium across twelve payments. Some charge a small installment fee for that, so paying the full year up front can be slightly cheaper.
How much is renters insurance in Texas?
The average Texas renters insurance premium was $201 a year in 2023, seventh highest in the country and up $2 from $199 in 2022. Texas data come from the Texas Department of Insurance, and the state uses its own policy forms, so coverage terms can differ a little from policies sold in other states.
How much is renters insurance in California?
California renters paid an average of $171 a year in 2023, a little under the national average of $173. That was up $2 from $169 in 2022. It has more insured renters than any other state, so its average is built on a very large pool of policies.
Can my landlord require renters insurance?
Usually, yes. In most of the country a landlord can make renters insurance a condition of the lease, as long as the requirement is written into it. Rules can vary by state and city, so check local law if a requirement looks unusual. Read the insurance clause before signing so you know the minimums and deadlines.
Does renters insurance cover my business equipment?
Only partly, in most cases. Standard renters policies usually set a low cap on business property and may exclude business liability. If you freelance or run a business from home, ask your insurer about a home business endorsement, or look at a small business policy for equipment and client liability.
Is renters insurance getting more expensive?
Barely. The national average was $188 in 2013, fell to $170 in 2021 and was $173 in 2023. The rise from 2022 to 2023 was just $2. Most states moved by single digits, and a few, including Wisconsin and South Dakota, got cheaper.
Use this data
Every chart and card below is free to reuse under CC BY 4.0. Download what you need and link back to this page.
 Stat cards
 Key findings card
 Infographic
 Average renters insurance (HO-4) premium by state, 2023 (USD per year)
 US average renters insurance premium, 2013-2023 (USD per year)
 US average renters insurance premium by amount of coverage, 2023 (USD per year)
 Change in average renters premium, 2022 to 2023, ten most expensive states (USD per year)
 US renters insurance (HO-4) by amount of coverage, 2023
 Renters (HO-4) vs condo/co-op (HO-6) policies, US, 2023
Embed the infographic
Free to share on your site, blog or slides under CC BY 4.0. Please keep the credit link.
Sources and method
Every number on this page comes from the sources below, each opened and read on or before October 18, 2026. A second, independent review checked every figure against its source and corrected anything that did not match. 51 of 51 state entries were confirmed; any that could not be are marked "Not yet confirmed" and left out of every count and chart.
- National Association of Insurance Commissioners (NAIC), Dwelling Fire, Homeowners Owner-Occupied, and Homeowners Tenant and Condominium/Cooperative Unit Owner's Insurance Report: Data for 2023 (July 2026 (Data for 2023))
- Insurance Information Institute (source: NAIC), Facts + Statistics: Homeowners and renters insurance (Average premiums for homeowners and renters insurance by state, 2022; 2013-2022) (Data year 2022, based on NAIC study (May 2025); accessed 2026-10-18)
Cite this page
ClauseAudit, “Average Renters Insurance Cost by State: What Tenants Paid in 2023”, updated October 18, 2026, https://clauseaudit.com/data/average-renters-insurance-cost-by-state. Free to reuse with a link back (CC BY 4.0).
This page summarises published data and law as checked on October 18, 2026. Figures are updated as new editions are released, and your own situation may differ. It is general information, not legal, tax or financial advice.