Freelance Statistics 2026: 150+ Numbers on US and Global Freelancers
By ClauseAudit Research · 152 statistics · 84 sources ·
What are the key freelance statistics for 2026?
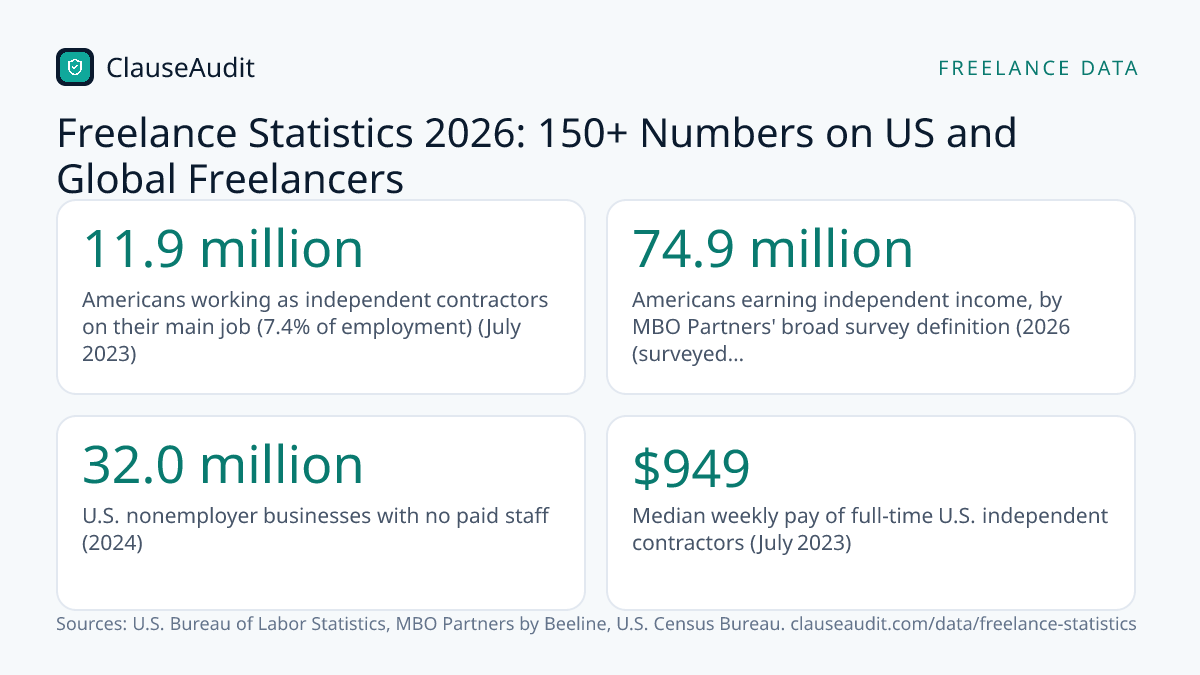
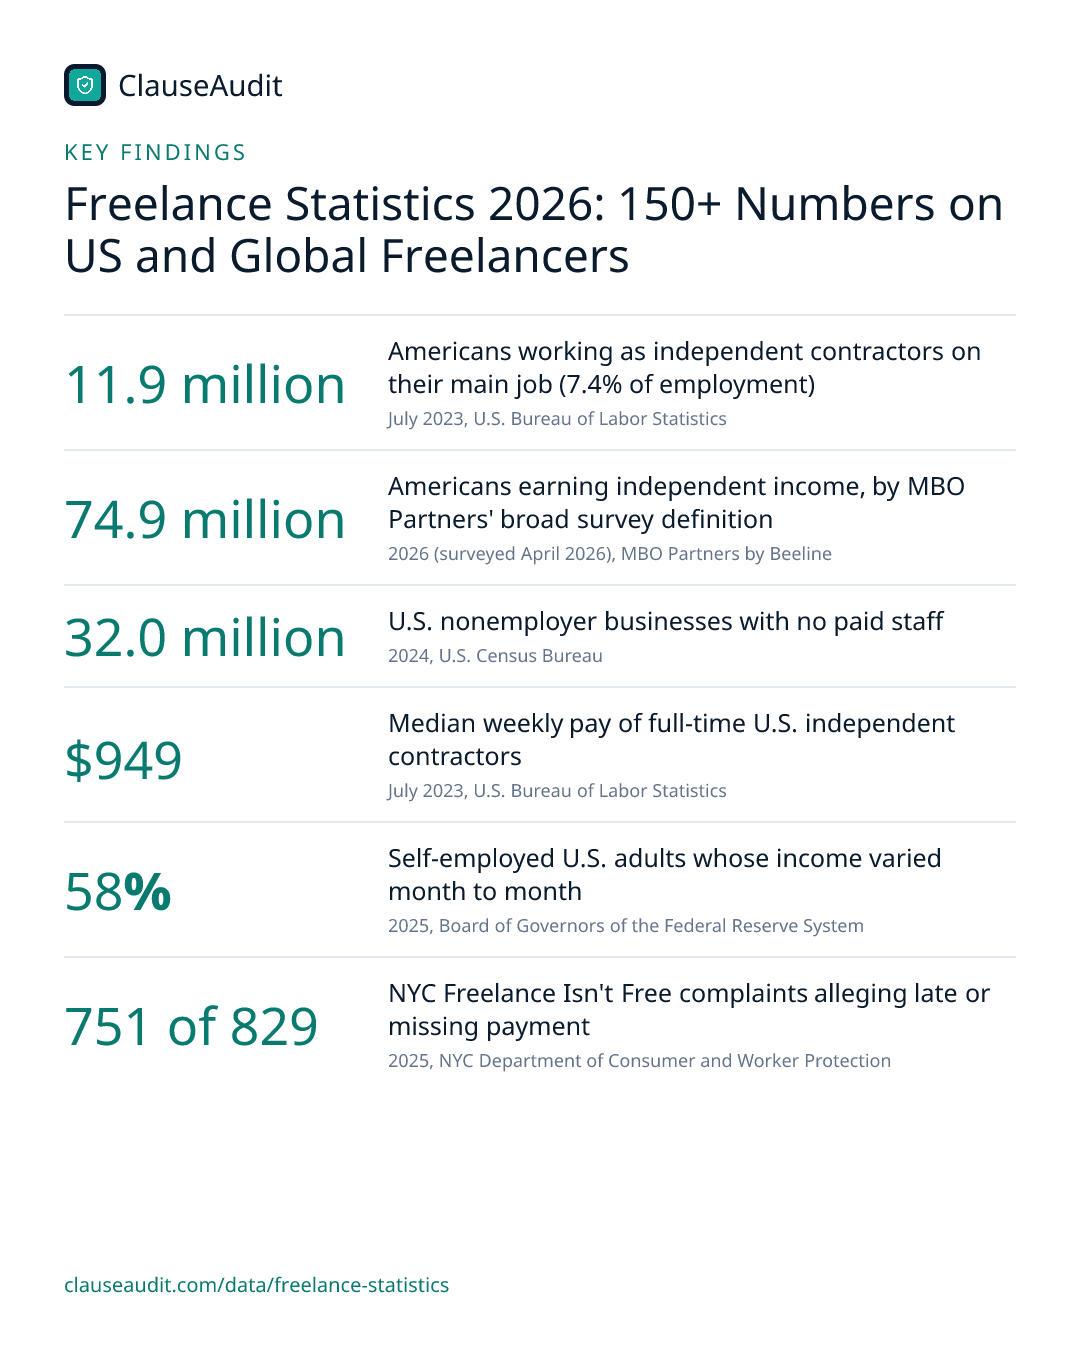
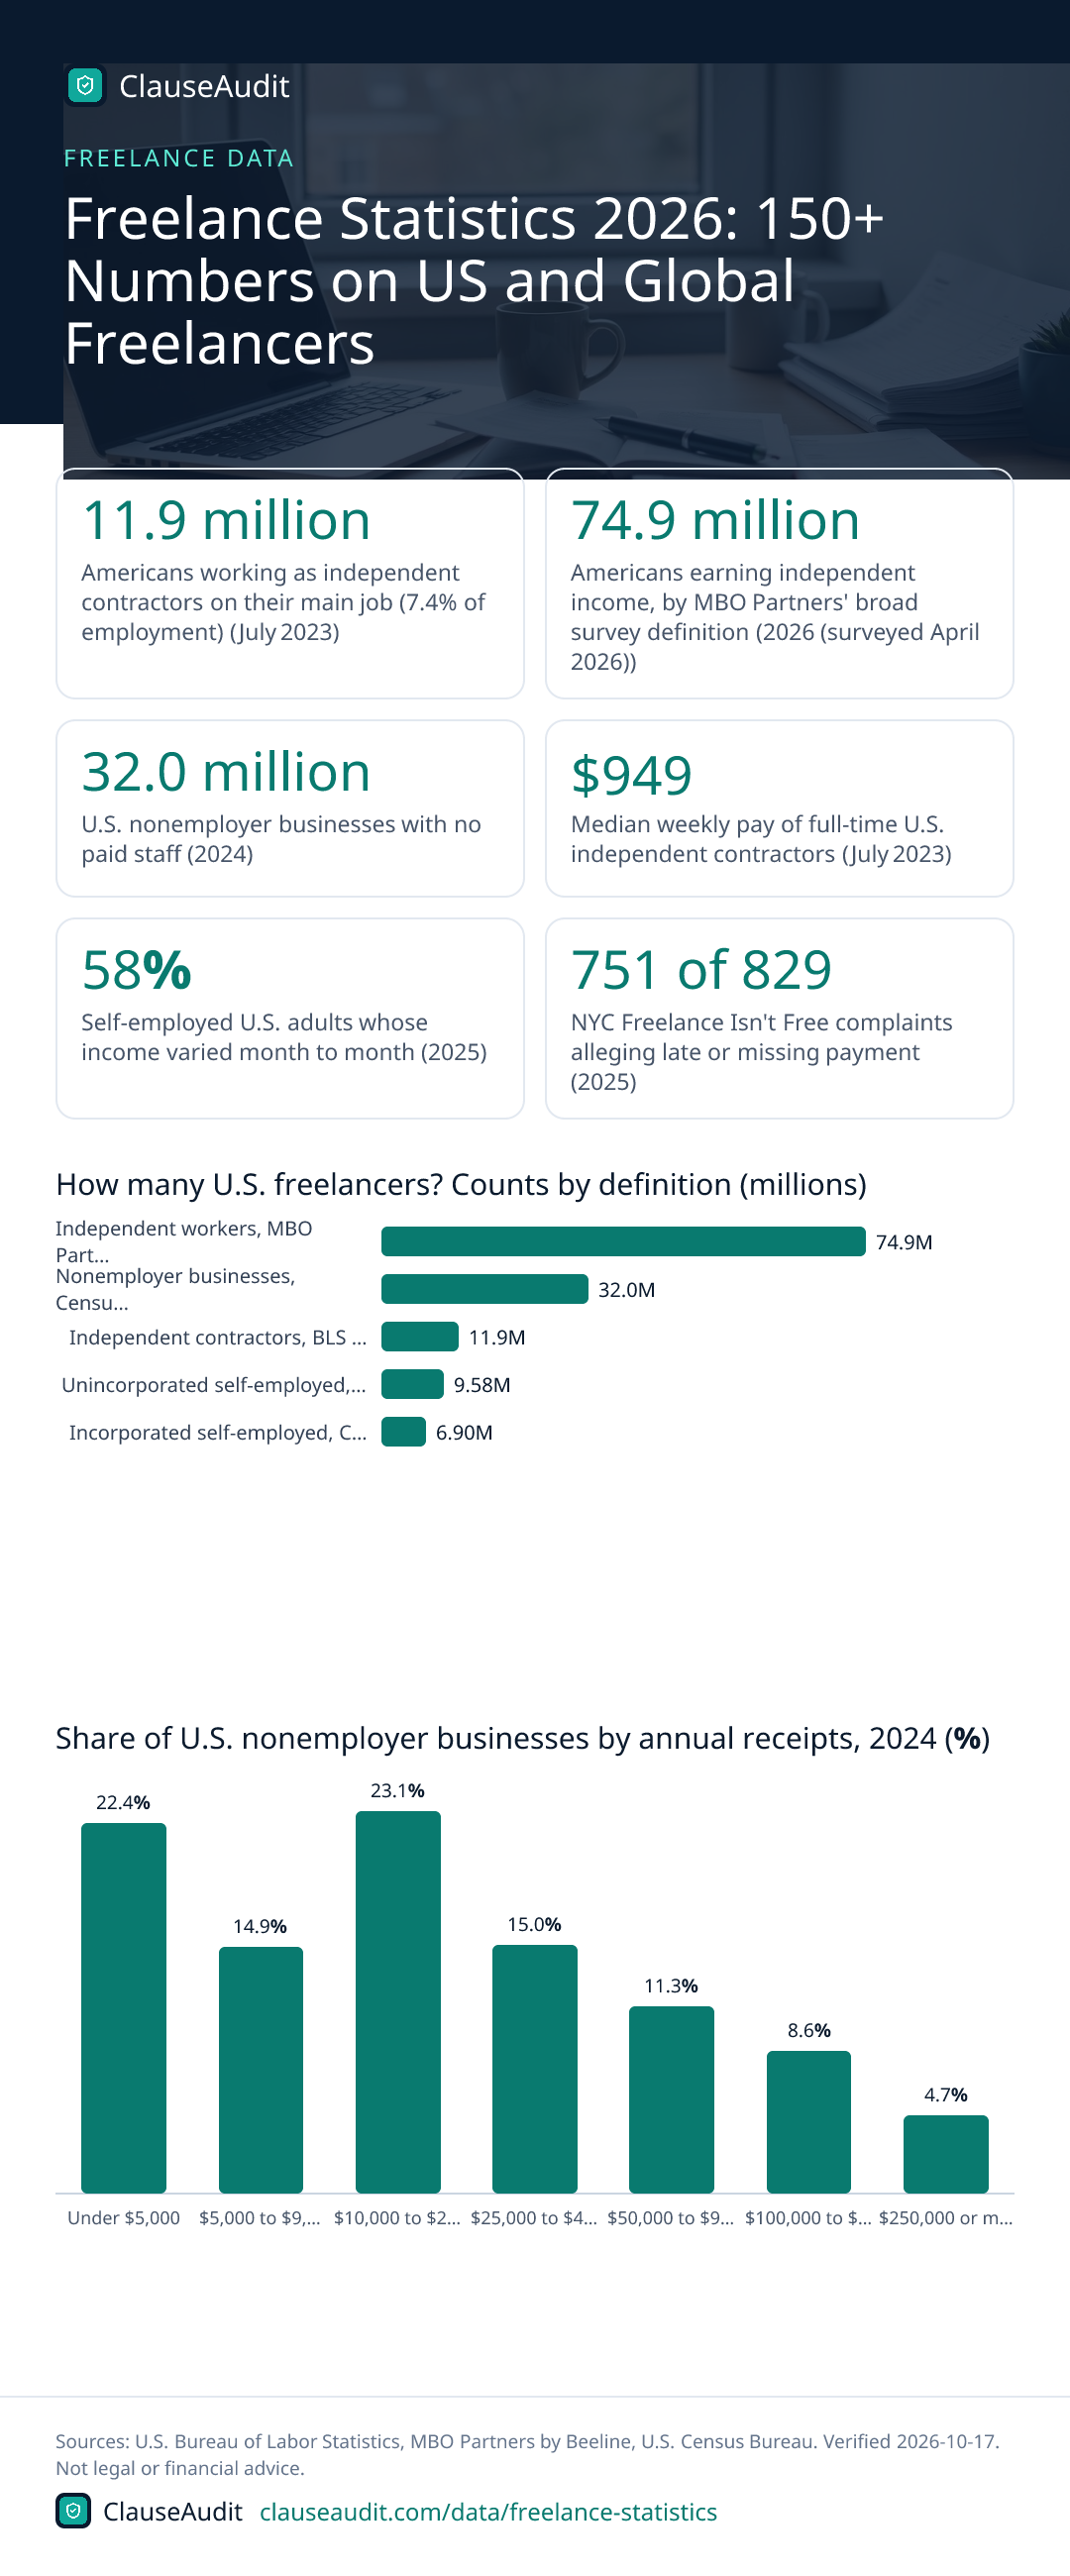
There is no single count. BLS found 11.9 million Americans worked as independent contractors on their main job in July 2023, 7.4% of employment. Census counted 32.0 million nonemployer businesses in 2024, and MBO Partners put independent earners at 74.9 million in 2026. Full-time contractors earned a median $949 a week.

- Americans working as independent contractors on their main job (7.4% of employment) (July 2023, U.S. Bureau of Labor Statistics)
- 11.9 million
- Americans earning independent income, by MBO Partners' broad survey definition (2026 (surveyed April 2026), MBO Partners by Beeline)
- 74.9 million
- U.S. nonemployer businesses with no paid staff (2024, U.S. Census Bureau)
- 32.0 million
- Median weekly pay of full-time U.S. independent contractors (July 2023, U.S. Bureau of Labor Statistics)
- $949
- Self-employed U.S. adults whose income varied month to month (2025, Board of Governors of the Federal Reserve System)
- 58%
- NYC Freelance Isn't Free complaints alleging late or missing payment (2025, NYC Department of Consumer and Worker Protection)
- 751 of 829
- Federal self-employment tax rate on net earnings (2026, Internal Revenue Service)
- 15.3%
- People worldwide doing online gig work, World Bank estimate (2023, World Bank)
- 154M to 435M
This page collects more than 150 freelance statistics in twelve groups: how many freelancers there are, growth trends, demographics, income, late payment, contracts and legal protections, taxes, financial security, platforms, AI, India and the rest of the world.
Each figure comes from a named source, mostly government agencies such as the Bureau of Labor Statistics, the Census Bureau, the IRS and the Federal Reserve, plus company filings and industry surveys. Each one carries its source and period, and the data was checked on October 17, 2026.
How Many Freelancers Are There in the US? Key Freelance Statistics
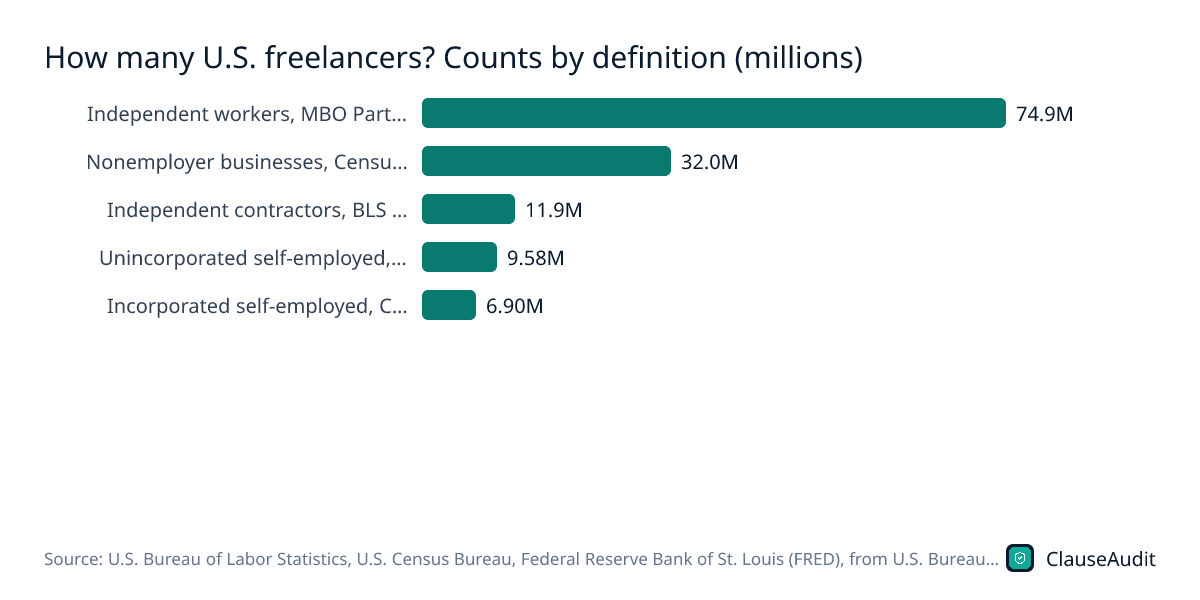
Counts of US freelancers range from 6.9 million to 74.9 million, depending on the definition: self-employed people, main jobs only, businesses filing taxes, or anyone with independent income. The figures below show each definition side by side.
- 11.9 million Americans were independent contractors on their sole or main job in July 2023, 7.4% of total employment, in the latest published BLS contingent work survey. (U.S. Bureau of Labor Statistics, Contingent and Alternative Employment Arrangements, July 2023 (USDL-24-2267), July 2023)
- 1.9 million more Americans worked as independent contractors on a second job in July 2023, equal to 22.8% of all multiple jobholders. (U.S. Bureau of Labor Statistics, Contingent and Alternative Employment Arrangements, July 2023 (USDL-24-2267), July 2023)
- 9.58 million Americans were unincorporated self-employed workers in September 2026, not seasonally adjusted, according to Current Population Survey data. (Federal Reserve Bank of St. Louis (FRED), from U.S. Bureau of Labor Statistics data, Employment Level - All Industries Self-Employed, Unincorporated (LNU02027714), thousands, not seasonally adjusted, September 2026)
- 6.9 million Americans were incorporated self-employed, people working for their own corporations, in September 2026, according to BLS Current Population Survey data. (U.S. Bureau of Labor Statistics, Current Population Survey series LNU02048984: Employment Level, Total wage and salary, incorporated self employed (thousands, not seasonally adjusted), September 2026)
- 31,985,874 U.S. nonemployer businesses, with no paid staff, operated in 2024, a Census count that includes freelancers but also landlords and side businesses. (U.S. Census Bureau, 2024 Nonemployer Statistics, U.S. file (nonemp24us), 2024)
- 74.9 million Americans earned income independently in 2026, a record high under MBO Partners' broad, survey-based definition of independent work. (MBO Partners by Beeline, U.S. Independent Workforce Reaches Record 74.9 Million as Full-Time Independence Accelerates (State of Independence 2026 press release), 2026 (surveyed April 2026))
- 22% of all full-time U.S. workers were full-time independents in 2026, nearly twice their 2019 share, according to MBO Partners. (MBO Partners by Beeline, U.S. Independent Workforce Reaches Record 74.9 Million as Full-Time Independence Accelerates (State of Independence 2026 press release), 2026)
- 38% of skilled U.S. knowledge workers freelanced in 2026, up from 28% a year earlier, in Upwork's survey of 2,400 skilled workers. (Upwork Inc., Upwork's Future Workforce Index 2026: How AI is Redefining the Value of Work as Skilled Freelancing Accelerates (press release), March to April 2026)
- 20% of U.S. adults did some gig activity in the month before the Fed's October 2024 survey, but only 21% of them called it their main job. (Board of Governors of the Federal Reserve System, Economic Well-Being of U.S. Households in 2024: Employment and Gig Work, October 2024)
- 1.6% of U.S. adults did digital platform work as their primary job in the past week, and 4.4% did some in six months, an NBER chapter estimates. (National Bureau of Economic Research, Understanding the Digital Platform Workforce in the US: Evidence from the Entrepreneurship in the Population Survey (Atkins, Brummet and Johnson), Draft May 2025)
- 16% of Americans had ever earned money from an online gig platform in 2021, and 9% had done so in the prior 12 months, Pew Research found. (Pew Research Center, The State of Gig Work in 2021, 2021)
- Under 5% to over 30% of the U.S. workforce is the range of estimates for nonstandard work arrangements, depending on definition and method, GAO reported in December 2023. (U.S. Government Accountability Office, Work Arrangements: Improved Collaboration Could Enhance Labor Force Data (GAO-24-105651), December 2023)
- 13.9% of developers answering Stack Overflow's 2025 survey described themselves as independent contractors, freelancers or self-employed. (Stack Overflow, 2025 Developer Survey: Work (employment status), 2025)
Figure 1: How many U.S. freelancers? Counts by definition (millions)
Chart data
| Label | Value |
|---|---|
| Independent workers, MBO Partners (2026) | 74.9M |
| Nonemployer businesses, Census (2024) | 32.0M |
| Independent contractors, BLS (Jul 2023) | 11.9M |
| Unincorporated self-employed, CPS (Sep 2026) | 9.58M |
| Incorporated self-employed, CPS (Sep 2026) | 6.90M |
Freelance Workforce Growth Statistics and Trends
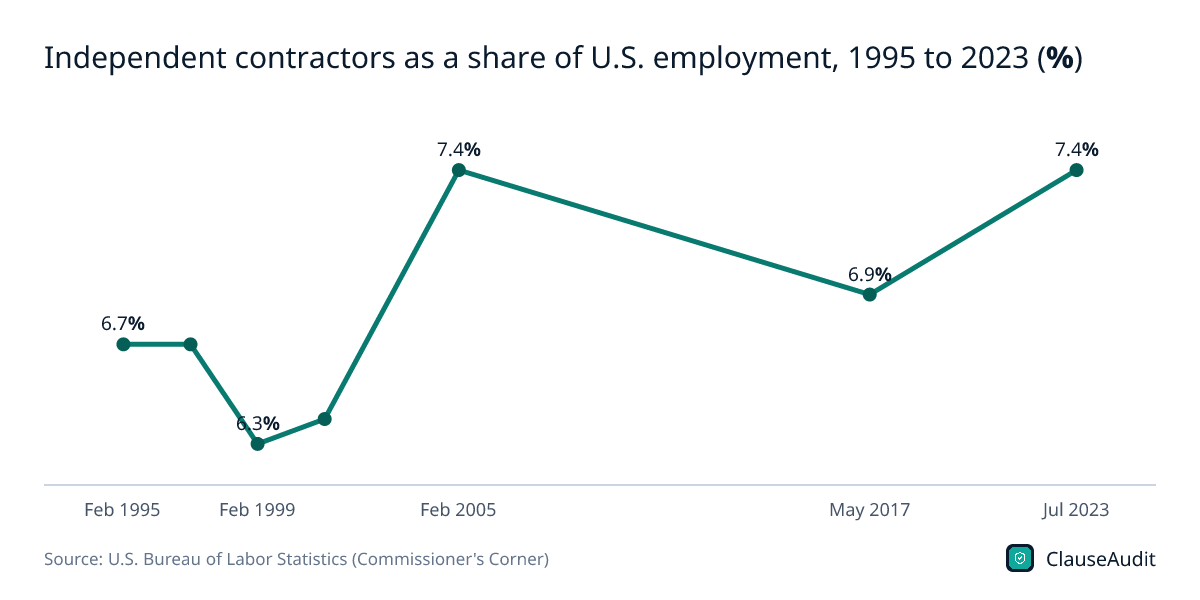
The government's measure of independent contracting has moved slowly, from 6.9% of workers in 2017 to 7.4% in 2023, while private surveys report faster growth in full-time independent work.
- 6.9% of U.S. workers were independent contractors on their main job in May 2017; by July 2023 the share had climbed to 7.4%. (U.S. Bureau of Labor Statistics, Contingent and Alternative Employment Arrangements, July 2023 (USDL-24-2267), May 2017 to July 2023)
- 4.3% of U.S. workers held contingent jobs they did not expect to last in July 2023, up from 3.8% in May 2017. (U.S. Bureau of Labor Statistics (Commissioner's Corner), Contingent jobs and alternative work arrangements: what you need to know, July 2023)
- July 2026 is when BLS proposed fielding its next Contingent Work Supplement, after earlier rounds in May 2017, July 2023 and May 2025, per a February 2026 notice. (Bureau of Labor Statistics, via the Federal Register, Proposed Revision of Information Collection; Contingent Work Supplement to the Current Population Survey (FR Doc. 2026-02629), Proposed in February 2026)
- 24 questions questions made up the single, streamlined digital platform work section BLS proposed for its July 2026 supplement, about half of them new. (Bureau of Labor Statistics, via the Federal Register, Proposed Revision of Information Collection; Contingent Work Supplement to the Current Population Survey (FR Doc. 2026-02629), 2026)
- 114% growth in the number of full-time independent professionals in the U.S. since 2020, according to MBO Partners' 2026 survey. (MBO Partners by Beeline, U.S. Independent Workforce Reaches Record 74.9 Million as Full-Time Independence Accelerates (State of Independence 2026 press release), 2020 to 2026)
- One-third of U.S. independent professionals served customers outside the United States in 2026, nearly three times the share in 2012. (MBO Partners by Beeline, U.S. Independent Workforce Reaches Record 74.9 Million as Full-Time Independence Accelerates (State of Independence 2026 press release), 2026)
- 72.7 million U.S. independents were counted in 2024, essentially flat from 72.1 million in 2023 after a 2020 low of 38.2 million. (MBO Partners, 2024 State of Independence in America, 2020 to 2024)
- 2.7% average annual growth in U.S. nonemployer businesses from 2012 to 2023, versus 1.1% a year for businesses with employees. (U.S. Census Bureau (America Counts), Number of U.S. Nonemployers Grew Faster Than Employer Businesses Nearly Every Year From 2012 to 2023, 2012 to 2023)
- 2.1% growth in U.S. nonemployer establishments in 2023, slowing after jumps of 4.9% in 2021 and 4.7% in 2022. (U.S. Census Bureau (America Counts), Number of U.S. Nonemployers Grew Faster Than Employer Businesses Nearly Every Year From 2012 to 2023, 2021 to 2023)
- 1,587,042 courier and messenger sole proprietorships existed in the U.S. in 2024, slightly more than the 1,578,508 in taxi and limousine service. (U.S. Census Bureau, The Gig Picture: 2024 Nonemployer Statistics Provide Insight Into the Gig Economy, 2024)
- 534,947 U.S. business applications were filed in September 2026, seasonally adjusted, up 0.5% from August 2026. (U.S. Census Bureau, Business Formation Statistics, September 2026 (CB26-163), September 2026)
- Nearly 8% of U.S. families earned income from the online platform economy in the year before the pandemic (2019 to early 2020), per Chase account data. (JPMorgan Chase Institute, The Online Platform Economy through the Pandemic, 2019 to early 2020)
Freelancer Demographics: Age, Gender, Education and Occupation
Independent contracting is more common among older workers, men and people in creative and real estate fields. Census owner data adds detail on women-owned, Hispanic-owned and veteran-owned nonemployer businesses.
- 11.5% of U.S. workers age 55 and over were independent contractors on their main job, versus 6.9% of those 25 to 54 and 2.2% of those 16 to 24. (U.S. Bureau of Labor Statistics, Contingent and Alternative Employment Arrangements, July 2023 (USDL-24-2267), July 2023)
- 36% of all U.S. independent contractors were age 55 or older, compared with 22% of workers in traditional jobs. (U.S. Bureau of Labor Statistics, Contingent and Alternative Employment Arrangements, July 2023 (USDL-24-2267), July 2023)
- 8.7% of employed men were independent contractors, compared with 5.8% of employed women. (U.S. Bureau of Labor Statistics, Contingent and Alternative Employment Arrangements, July 2023 (USDL-24-2267), July 2023)
- 7.9% of White workers were independent contractors, compared with 7.4% of Hispanic or Latino workers and 5.4% of both Black and Asian workers. (U.S. Bureau of Labor Statistics, Contingent and Alternative Employment Arrangements, July 2023 (USDL-24-2267), July 2023)
- 70.7% of U.S. independent contractors worked full time, even though part-time workers were about twice as likely to be contractors. (U.S. Bureau of Labor Statistics, Contingent and Alternative Employment Arrangements, July 2023 (USDL-24-2267), July 2023)
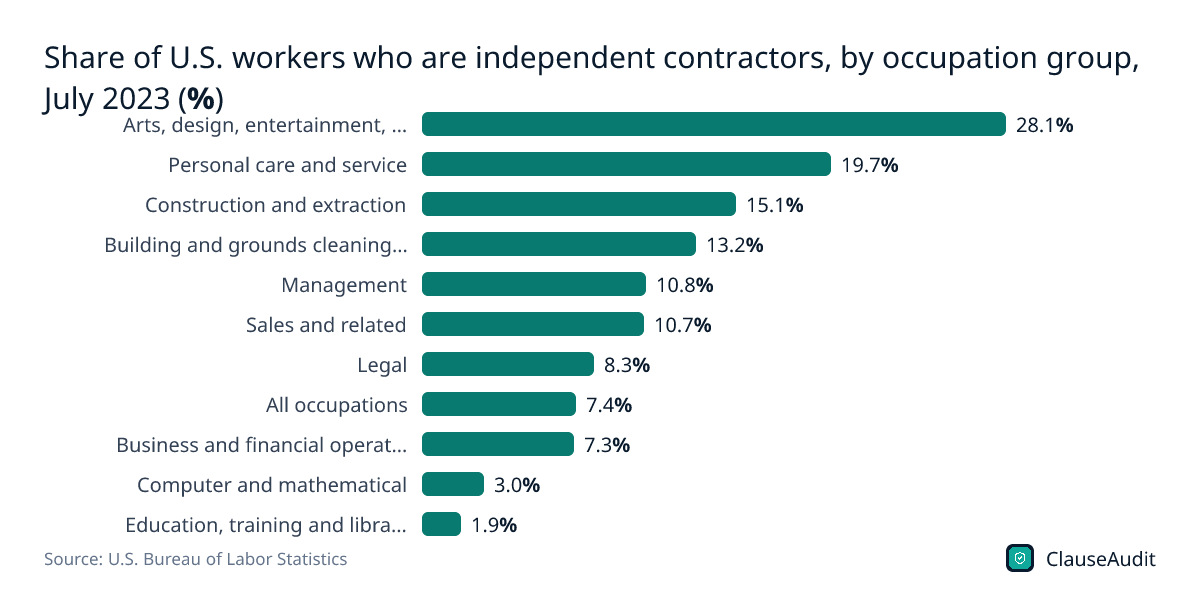
- 28.1% of workers in arts, design, entertainment, sports and media occupations were independent contractors, the highest rate of any occupation group. (U.S. Bureau of Labor Statistics, Table 6. Employed workers with alternative and traditional work arrangements by occupation, industry and other characteristics, July 2023, July 2023)
- 24.2% of workers in real estate and rental and leasing were independent contractors, among the highest rates of any industry. (U.S. Bureau of Labor Statistics, Table 6. Employed workers with alternative and traditional work arrangements by occupation, industry and other characteristics, July 2023, July 2023)
- 42.3% of U.S. nonemployer businesses, 12.9 million, were owned by women in 2023. (U.S. Census Bureau, Census Bureau Releases New Data About Characteristics of Employer and Nonemployer Business Owners (2023 NES-D), 2023 (released Nov. 2025))
- 17.5% of U.S. nonemployer businesses, about 5.3 million, were Hispanic-owned in 2023. (U.S. Census Bureau, Census Bureau Releases New Data About Characteristics of Employer and Nonemployer Business Owners (2023 NES-D), 2023 (released Nov. 2025))
- 4.5% of U.S. nonemployer businesses, about 1.4 million, were owned by veterans in 2023. (U.S. Census Bureau, Census Bureau Releases New Data About Characteristics of Employer and Nonemployer Business Owners (2023 NES-D), 2023 (released Nov. 2025))
- Three-in-ten U.S. adults ages 18 to 29 had ever earned money through an online gig platform in 2021, versus 16% of all adults. (Pew Research Center, The State of Gig Work in 2021, 2021)
- 30% of self-employed U.S. adults worked entirely from home in 2025, including 22% of business owners with paid employees. (Board of Governors of the Federal Reserve System, Economic Well-Being of U.S. Households in 2025: Employment and Job Quality, 2025 (surveyed Oct. 2025))
Figure 3: Share of U.S. workers who are independent contractors, by occupation group, July 2023 (%)
Chart data
| Label | Value |
|---|---|
| Arts, design, entertainment, sports and media | 28.1% |
| Personal care and service | 19.7% |
| Construction and extraction | 15.1% |
| Building and grounds cleaning and maintenance | 13.2% |
| Management | 10.8% |
| Sales and related | 10.7% |
| Legal | 8.3% |
| All occupations | 7.4% |
| Business and financial operations | 7.3% |
| Computer and mathematical | 3.0% |
| Education, training and library | 1.9% |
Freelance Income Statistics: How Much Do Freelancers Earn?
Freelance income is spread unevenly. Most nonemployer businesses report modest receipts, while a smaller group of independent professionals earns six figures.
- $949 was the median weekly pay of full-time independent contractors in July 2023, versus $1,132 for full-time workers in traditional arrangements, per BLS. (U.S. Bureau of Labor Statistics, Contingent and Alternative Employment Arrangements, July 2023 (USDL-24-2267), July 2023)
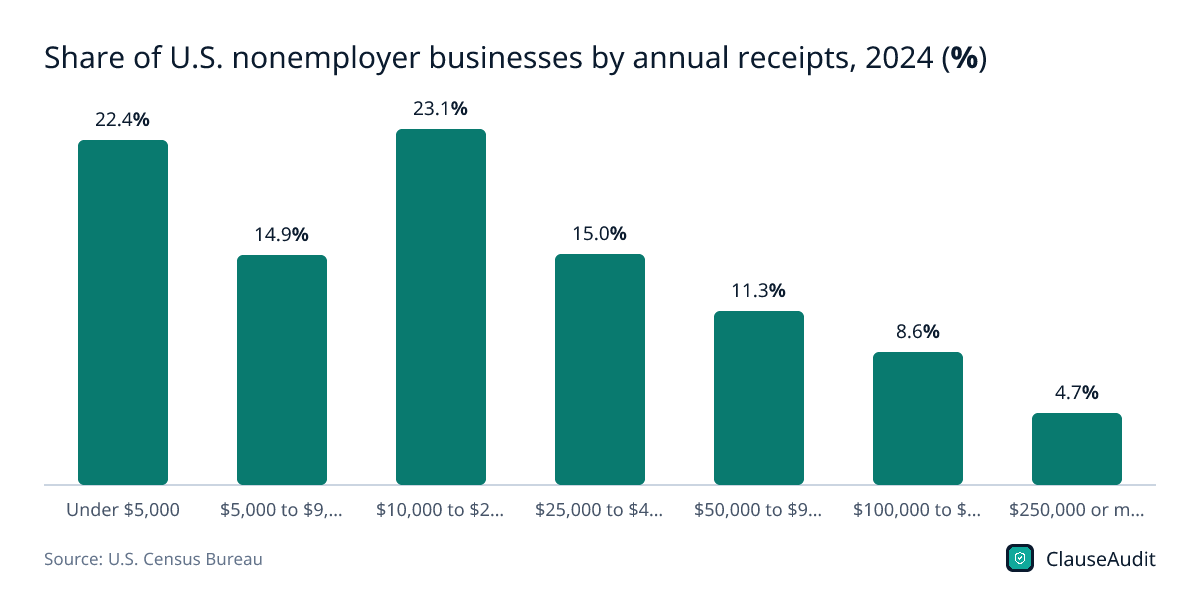
- 22.4% of U.S. nonemployer businesses took in less than $5,000 in 2024, and 60.4% took in under $25,000, per Census receipts size classes. (U.S. Census Bureau, 2024 Nonemployer Statistics, U.S. file (nonemp24us), 2024)
- $1.86 trillion in combined receipts was reported by U.S. nonemployer businesses in 2024; receipts are gross revenue before expenses, not take-home pay. (U.S. Census Bureau, 2024 Nonemployer Statistics, U.S. file (nonemp24us), 2024)
- 1,115,783 independent artists, writers and performers ran nonemployer businesses in 2024, with $35.7 billion in combined receipts. (U.S. Census Bureau, 2024 Nonemployer Statistics, U.S. file (nonemp24us), 2024)
- 4,233,838 nonemployer businesses in professional, scientific and technical services, a sector that includes consultants, designers and developers, took in $249.5 billion in 2024. (U.S. Census Bureau, 2024 Nonemployer Statistics, U.S. file (nonemp24us), 2024)
- 5.8 million independent professionals earned more than $100,000 a year in 2026, nearly double the number in 2020, MBO Partners estimates. (MBO Partners by Beeline, U.S. Independent Workforce Reaches Record 74.9 Million as Full-Time Independence Accelerates (State of Independence 2026 press release), 2026)
- 59% of independent workers said they earn more working independently, and 84% said they are happier, in MBO Partners' 2025 State of Independence study. (MBO Partners, State of Independence 2025 report, 2025)
- 88.7% of nonfarm sole proprietor tax returns showed business receipts of $100,000 or less in tax year 2022, yet they earned just 30.1% of profits. (Internal Revenue Service, Statistics of Income Division, Sole Proprietorship Returns, Tax Year 2022 (Statistics of Income Bulletin, Dungan and Snyder), Tax year 2022)
- $423.1 billion in receipts went to women-owned nonemployer businesses in 2023, out of $1.8 trillion for all 30.4 million U.S. nonemployer businesses. (U.S. Census Bureau, Census Bureau Releases New Data About Characteristics of Employer and Nonemployer Business Owners (2023 NES-D), 2023 (released Nov. 2025))
- $40–$50 per hour is the rate range the Editorial Freelancers Association's 2026 chart lists for fiction copyediting, based on 2025 rates from over 1,100 members. (Editorial Freelancers Association, Editorial Rates, 2026 Rate Chart, 2025 rates)
- $2,000 was the median 2022 book income for all U.S. authors, including part-timers, in the Authors Guild's survey of 5,699 published authors. (The Authors Guild, Key Takeaways from the 2023 Author Income Survey, 2022)
- 31% of Americans who did gig activities in 2024 said they would have trouble making ends meet without that income, the Federal Reserve found. (Board of Governors of the Federal Reserve System, Economic Well-Being of U.S. Households in 2024: Employment and Gig Work, October 2024)
Figure 4: Share of U.S. nonemployer businesses by annual receipts, 2024 (%)
Chart data
| Label | Value (%) |
|---|---|
| Under $5,000 | 22.4% |
| $5,000 to $9,999 | 14.9% |
| $10,000 to $24,999 | 23.1% |
| $25,000 to $49,999 | 15.0% |
| $50,000 to $99,999 | 11.3% |
| $100,000 to $249,999 | 8.6% |
| $250,000 or more | 4.7% |
Freelancer Late Payment and Nonpayment Statistics
New York City publishes detailed public data on freelancer payment complaints. Invoicing platforms and UK government research add context on how often and how late small businesses get paid.
- 829 complaints were filed under New York City's Freelance Isn't Free Act in 2025. (NYC Department of Consumer and Worker Protection, Worker Protection Metrics at the New York City Department of Consumer and Worker Protection, 2025, 2025)
- 751 of those 2025 NYC complaints alleged unlawful payment practices such as late or missing payment, by far the most common allegation. (NYC Department of Consumer and Worker Protection, Worker Protection Metrics at the New York City Department of Consumer and Worker Protection, 2025, 2025)
- 207 2025 complaints in New York City alleged a hiring party failed or refused to enter into a written contract with the freelancer. (NYC Department of Consumer and Worker Protection, Worker Protection Metrics at the New York City Department of Consumer and Worker Protection, 2025, 2025)
- $549,241 in restitution was secured for 366 freelancers in 2025 through New York City's Freelance Isn't Free pattern-and-practice enforcement. (NYC Department of Consumer and Worker Protection, Worker Protection Metrics at the New York City Department of Consumer and Worker Protection, 2025, 2025)
- 145 days was the median time to resolve a case in New York City's Freelance Isn't Free navigation service in 2025. (NYC Department of Consumer and Worker Protection, Worker Protection Metrics at the New York City Department of Consumer and Worker Protection, 2025, 2025)
- 49% of NYC freelancers answering a follow-up survey in fiscal 2019 to 2023 said they were not paid anything after complaining; 40% were paid in full. (NYC Department of Consumer and Worker Protection, Freelance Isn't Free Act Five-Year Report, FY2019 to FY2023)
- 30 days is the deadline for paying an Illinois freelancer when the contract names no due date, for contracts taking effect after July 1, 2024. (Illinois Department of Labor, Freelance Worker Protection Act, 2024 onward)
- 8.5 days was how late U.S. small businesses on Xero were paid on average in the June 2026 quarter, with invoices taking 29.3 days overall. (Xero, Xero Small Business Insights: United States, June 2026 quarter, April to June 2026)
- 59% of U.S. small businesses had invoices more than 30 days overdue in QuickBooks' 2026 survey, up from 47% a year earlier. (Intuit QuickBooks, 2026 Small Business Late Payments Report, 2026)
- $17.7K was the average amount owed to U.S. small businesses with unpaid invoices in QuickBooks' 2026 late payments report. (Intuit QuickBooks, 2026 Small Business Late Payments Report, 2026)
- 31% of female freelancers' invoices on Bonsai were paid late, versus 24% for men and 23% for studios, across three years of invoicing data. (Bonsai, How often do freelancers get paid late? It depends if you're a woman or man, Three years of invoicing data (published January 2026))
- 14,000 UK businesses close each year because of late payments, about 38 a day, in a 2025 government-commissioned estimate. (London Economics for the UK Department for Business and Trade and the Office of the Small Business Commissioner, Late Payments Research: Estimating the total economic cost of late payments and their impact on the UK economy, 2025)
- 15% of invoices from UK large businesses were paid late in 2025, down from 25% in 2018. (UK Office of the Small Business Commissioner, Payment times are improving as new legislation dawns, 2025)
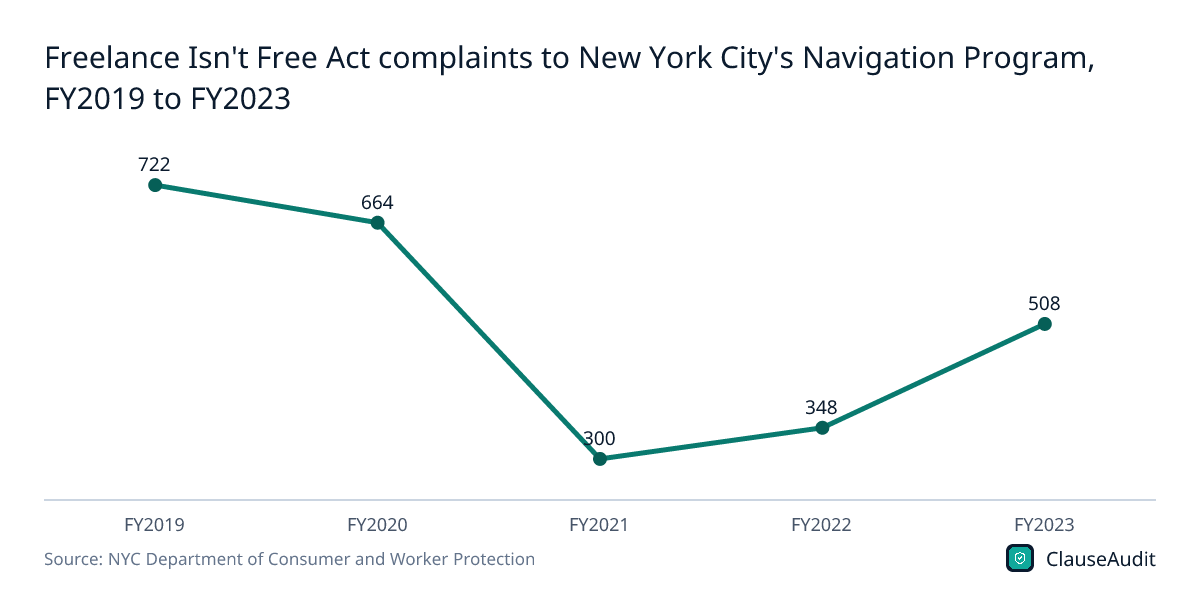
Figure 5: Freelance Isn't Free Act complaints to New York City's Navigation Program, FY2019 to FY2023
Chart data
| Label | Value |
|---|---|
| FY2019 | 722 |
| FY2020 | 664 |
| FY2021 | 300 |
| FY2022 | 348 |
| FY2023 | 508 |
Freelance Contract and Legal Protection Statistics
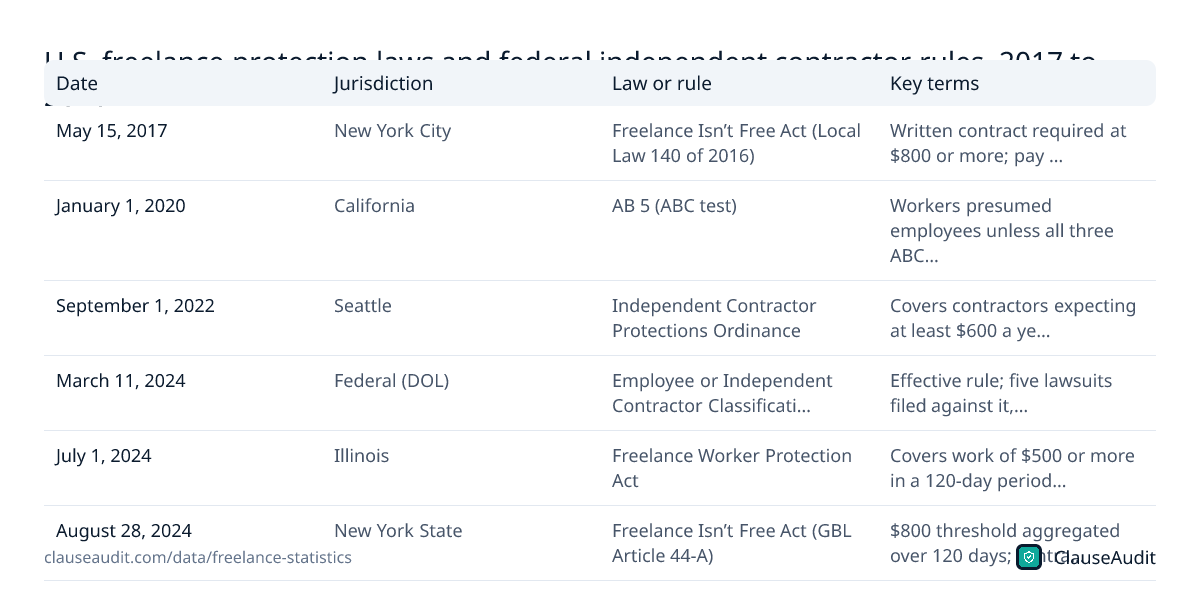
A handful of cities and states now require written freelance contracts and set payment deadlines. Federal rules on who counts as an independent contractor are under review again in 2026.
- $800 is the contract value at or above which New York City’s Freelance Isn’t Free Act, in effect since May 15, 2017, requires a written contract. (NYC Department of Consumer and Worker Protection, Freelance Isn't Free Act Five-Year Report, Since May 15, 2017)
- 264 of 2,542 freelancer complaints to NYC’s Navigation Program in fiscal years 2019 to 2023 alleged failure to enter into a written contract. (NYC Department of Consumer and Worker Protection, Freelance Isn't Free Act Five-Year Report, FY2019-FY2023)
- 16% of NYC freelancers who filed complaints later pursued their claim in court, and 9% used alternative dispute resolution such as mediation or arbitration. (NYC Department of Consumer and Worker Protection, Freelance Isn't Free Act Five-Year Report, FY2019-FY2023)
- 51% of contracts behind NYC freelance complaints were worth $5,000 or less, and 22% were worth $1,000 or less. (NYC Department of Consumer and Worker Protection, Freelance Isn't Free Act Five-Year Report, FY2019-FY2023)
- August 28, 2024 is when New York State’s Freelance Isn’t Free Act took effect statewide, adding Article 44-A to the General Business Law. (New York State Department of Labor, Freelance Isn’t Free Act, 2024)
- $800 is the threshold for New York State freelance protections, counting a single contract or all contracts with the same client over 120 days. (New York State Senate, New York General Business Law Section 1410 (Definitions), Current law)
- Six years is the minimum time New York State hiring parties must keep a freelancer’s written contract. (New York State Senate, New York General Business Law Section 1412 (Written contracts), Current law)
- $500 in work over a 120-day period triggers Illinois Freelance Worker Protection Act coverage, which applies to contracts taking effect after July 1, 2024. (Illinois Department of Labor, Freelance Worker Protection Act, Since July 1, 2024)
- $600 in expected yearly pay from one hiring entity brings Seattle independent contractors under the city’s protections ordinance, in effect since September 1, 2022. (Seattle Office of Labor Standards, Independent Contractor Protections Ordinance, Since September 1, 2022)
- $5,000 to $25,000 per violation is the civil penalty range California agencies may assess for willful misclassification under Labor Code section 226.8. (California Department of Industrial Relations, Labor Commissioner’s Office, Independent Contractor versus Employee (FAQ), Current law)
- March 11, 2024 is when the U.S. Labor Department’s current independent contractor rule took effect; a February 2026 proposal would replace it. (U.S. Department of Labor, Wage and Hour Division, Employee or Independent Contractor Classification Under the FLSA: Rulemaking, 2024)
- $682.7 million in yearly cost savings is what the Labor Department estimates its February 2026 independent contractor proposal would produce if finalized. (U.S. Department of Labor via Federal Register (GovInfo), Employee or Independent Contractor Status Under the FLSA, FMLA and MSPA (proposed rule, 91 FR 9932), February 2026 (proposed))
- Five lawsuits were filed challenging the 2024 independent contractor rule; all were stayed while the Labor Department reconsiders it. (U.S. Department of Labor via Federal Register (GovInfo), Employee or Independent Contractor Status Under the FLSA, FMLA and MSPA (proposed rule, 91 FR 9932), As of February 2026)
| Date | Jurisdiction | Law or rule | Key terms |
|---|---|---|---|
| May 15, 2017 | New York City | Freelance Isn’t Free Act (Local Law 140 of 2016) | Written contract required at $800 or more; pay by due date or within 30 days of completion |
| January 1, 2020 | California | AB 5 (ABC test) | Workers presumed employees unless all three ABC conditions are met; $5,000 to $25,000 per willful misclassification violation |
| September 1, 2022 | Seattle | Independent Contractor Protections Ordinance | Covers contractors expecting at least $600 a year from one hiring entity; pay within 30 days if no date set |
| March 11, 2024 | Federal (DOL) | Employee or Independent Contractor Classification rule (2024 Rule) | Effective rule; five lawsuits filed against it, all stayed |
| July 1, 2024 | Illinois | Freelance Worker Protection Act | Covers work of $500 or more in a 120-day period; pay by due date or within 30 days |
| August 28, 2024 | New York State | Freelance Isn’t Free Act (GBL Article 44-A) | $800 threshold aggregated over 120 days; contracts kept at least six years |
| February 26, 2026 | Federal (DOL) | Proposed rule to replace the 2024 Rule (91 FR 9932) | Two core factors: control and opportunity for profit or loss; comments closed April 28, 2026 |
Freelancer Tax Statistics: Self-Employment Tax, 1099s and IRS Data
Freelancers pay both the Social Security and Medicare portions of payroll tax themselves. IRS data shows that income with little or no information reporting, such as sole proprietor income, is misreported far more often than wages, and how much self-employment tax goes unreported.
- 15.3% is the federal self-employment tax rate on net earnings: 12.4% for Social Security plus 2.9% for Medicare. (Internal Revenue Service, Self-employment tax (Social Security and Medicare taxes), 2026)
- $400 or more in net self-employment earnings for the year means a freelancer must file a return and owe self-employment tax. (Internal Revenue Service, Self-employment tax (Social Security and Medicare taxes), 2026)
- 0.9% Additional Medicare Tax applies to self-employment income above $200,000 for single filers and $250,000 for married couples filing jointly. (Internal Revenue Service, Self-employment tax (Social Security and Medicare taxes), 2026)
- $2,000 is the Form 1099-NEC reporting threshold for nonemployee compensation paid after 2025, and it may be adjusted for inflation from 2027. (Internal Revenue Service, Instructions for Forms 1099-MISC and 1099-NEC, 2026)
- $20,000 in payments across more than 200 transactions is again the federal trigger for Form 1099-K from payment apps and marketplaces, the IRS confirmed in October 2025. (Internal Revenue Service, IR-2025-107: IRS issues FAQs on Form 1099-K threshold under the One, Big, Beautiful Bill; dollar limit reverts to $20,000, October 2025)
- 31.1 million individual tax returns reported nonfarm sole proprietorship (Schedule C) activity in tax year 2023, the latest IRS Statistics of Income figures. (Internal Revenue Service, Statistics of Income Division, Table 1. Nonfarm Sole Proprietorships: Business Receipts, Selected Deductions, Payroll, and Net Income, by Industrial Sectors, Tax Year 2023 (23sp01br.xls), Tax year 2023)
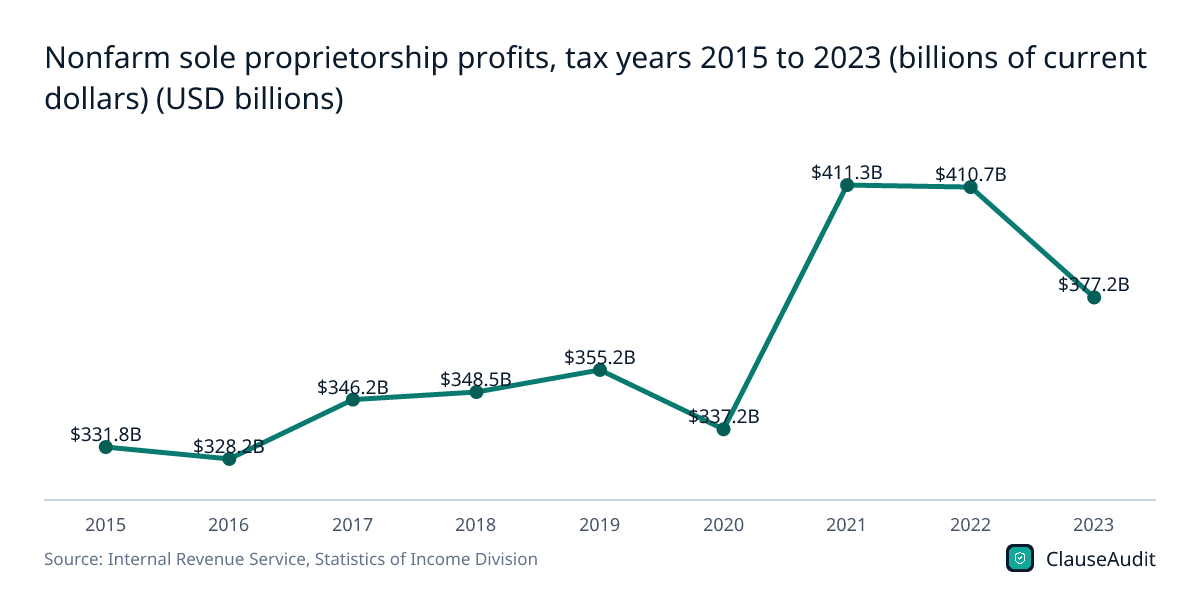
- $377.2 billion in profits (net income less deficit) was reported by nonfarm sole proprietors for tax year 2023, on $2,063.2 billion in business receipts. (Internal Revenue Service, Statistics of Income Division, Table 1. Nonfarm Sole Proprietorships: Business Receipts, Selected Deductions, Payroll, and Net Income, by Industrial Sectors, Tax Year 2023 (23sp01br.xls), Tax year 2023)
- 18.3% was the profit margin of nonfarm sole proprietorships in tax year 2023: $377.2 billion in net income on $2,063.2 billion in receipts (calculated from IRS SOI Table 1). (Internal Revenue Service, Statistics of Income Division, Table 1. Nonfarm Sole Proprietorships: Business Receipts, Selected Deductions, Payroll, and Net Income, by Industrial Sectors, Tax Year 2023 (23sp01br.xls), Tax year 2023)
- $194 billion of the projected tax year 2022 tax gap came from underreported individual business income, 28% of the $696 billion gross gap, IRS projects. (Internal Revenue Service, Tax Gap Projections for Tax Year 2022 (Publication 5869), Tax year 2022 (projected))
- $71 billion in self-employment tax went underreported in tax year 2022, about 10% of the gross tax gap, according to IRS projections. (Internal Revenue Service, Tax Gap Projections for Tax Year 2022 (Publication 5869), Tax year 2022 (projected))
- 55% of income with little or no information reporting, such as nonfarm sole proprietor income, is misreported, versus 1% of wages, per IRS 2014-2016 estimates. (Internal Revenue Service, Tax Gap Projections for Tax Year 2022 (Publication 5869), Tax years 2014-2016)
- 41 states tax wage and salary income in 2026 (42 levy income taxes, but Washington taxes only capital gains), so location matters for freelancers; top rates run from 2.5% to 13.3%. (Tax Foundation, State Individual Income Tax Rates and Brackets, 2026, 2026)
- 1.5 million to 2 million U.S. platform workers were active in recent years, GAO estimated in 2020, when it called for more IRS income reporting on platform work. (U.S. Government Accountability Office, Taxpayer Compliance: More Income Reporting Needed for Taxpayers Working through Online Platforms (GAO-20-366), 2020)
Figure 7: Nonfarm sole proprietorship profits, tax years 2015 to 2023 (billions of current dollars) (USD billions)
Chart data
| Label | Value (USD billions) |
|---|---|
| 2015 | $331.8B |
| 2016 | $328.2B |
| 2017 | $346.2B |
| 2018 | $348.5B |
| 2019 | $355.2B |
| 2020 | $337.2B |
| 2021 | $411.3B |
| 2022 | $410.7B |
| 2023 | $377.2B |
Freelancer Financial Security Statistics: Income Volatility, Health Insurance and Retirement
Without an employer, freelancers carry income swings, health insurance and retirement savings on their own. Federal Reserve, Treasury and BLS data measure the gap.
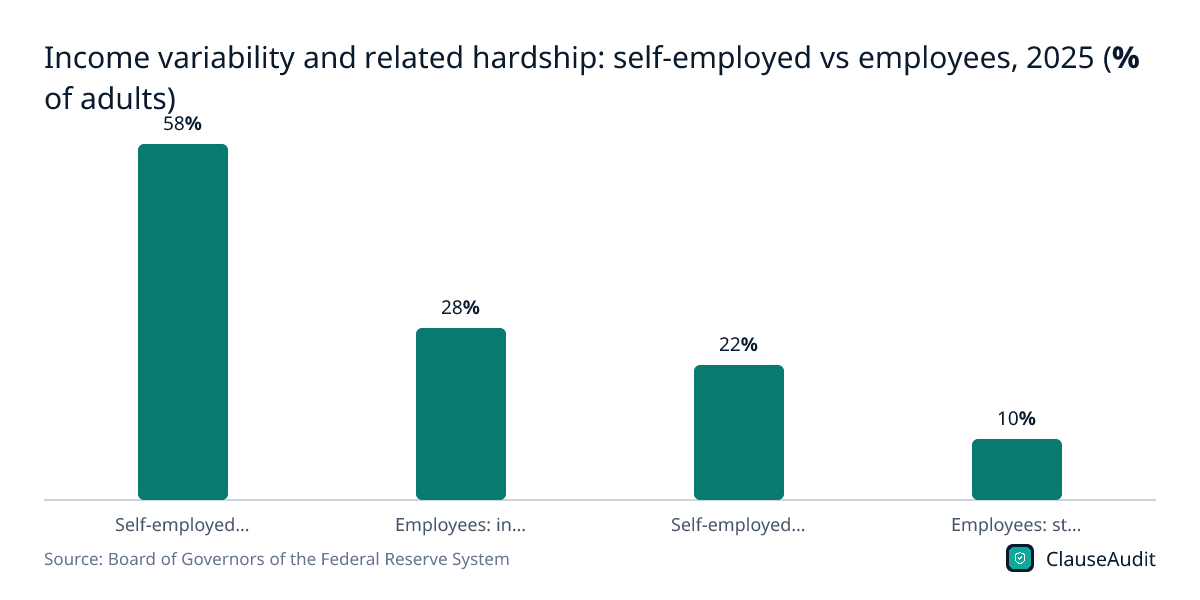
- 58% of self-employed U.S. adults said their income varied from month to month in 2025. (Board of Governors of the Federal Reserve System, Economic Well-Being of U.S. Households in 2025 (Survey of Household Economics and Decisionmaking), 2025)
- 22% of self-employed adults struggled to pay bills in the prior 12 months because their income varied, more than double employees' 10%. (Board of Governors of the Federal Reserve System, Economic Well-Being of U.S. Households in 2025 (Survey of Household Economics and Decisionmaking), 2025)
- 28% of people working for someone else reported income variability in 2025, less than half the rate among the self-employed. (Board of Governors of the Federal Reserve System, Economic Well-Being of U.S. Households in 2025 (Survey of Household Economics and Decisionmaking), 2025)
- 54% of U.S. adults doing short-term gig tasks wished their pay was more consistent in 2024; nearly half of all gig workers agreed. (Board of Governors of the Federal Reserve System, Economic Well-Being of U.S. Households in 2024: Employment and Gig Work, 2024)
- 74.2% of independent contractors had health insurance from any source in July 2023, versus 84.9% of workers in traditional arrangements. (U.S. Bureau of Labor Statistics, Contingent and Alternative Employment Arrangements, July 2023 (USDL-24-2267), July 2023)
- 1,812,990 self-employed workers ages 21 to 64 had ACA Marketplace health coverage in 2023, per IRS tax-form data analyzed by the Treasury. (U.S. Department of the Treasury, Office of Tax Analysis, Affordable Care Act Marketplace Coverage for the Self-Employed and Small Business Owners in 2023, 2023)
- 19% of self-employed workers and small business owners ages 21 to 64 had Marketplace coverage in 2023, versus 7% of other adults. (U.S. Department of the Treasury, Office of Tax Analysis, Affordable Care Act Marketplace Coverage for the Self-Employed and Small Business Owners in 2023, 2023)
- 82% of self-employed workers and small business owners with Marketplace coverage claimed premium tax credits in 2023. (U.S. Department of the Treasury, Office of Tax Analysis, Affordable Care Act Marketplace Coverage for the Self-Employed and Small Business Owners in 2023, 2023)
- 72% of private industry employees had access to employer retirement benefits in March 2026, a benefit freelancers must arrange themselves. (U.S. Bureau of Labor Statistics, Employee Benefits in the United States, March 2026, March 2026)
- $26,993 was the average annual premium for employer-sponsored family health coverage in 2025, coverage freelancers must replace on their own. (KFF, 2025 Employer Health Benefits Survey, 2025)
- $72,000 is the 2026 cap on SEP-IRA contributions, also limited to 25% of compensation; SEP-IRAs are a common self-employed retirement plan. (Internal Revenue Service, SEP contribution limits (including grandfathered SARSEPs), 2026)
- 91% of U.S. nonemployer firms reported at least one financial challenge, such as uneven cash flow, in the prior 12 months in the 2025 Small Business Credit Survey, up from 90% in 2024. (Federal Reserve Banks (Small Business Credit Survey), 2026 Chartbook on Nonemployer Firms: Findings from the 2025 Small Business Credit Survey with Trends over Time, 2025 survey (published July 2026))
Figure 8: Income variability and related hardship: self-employed vs employees, 2025 (% of adults)
Chart data
| Label | Value (% of adults) |
|---|---|
| Self-employed: income varied month to month | 58% |
| Employees: income varied month to month | 28% |
| Self-employed: struggled to pay bills due to varying income | 22% |
| Employees: struggled to pay bills due to varying income | 10% |
Freelance Platform Statistics and Freelance Market Size
Upwork and Fiverr report results in their SEC filings, which makes them the clearest window into platform freelancing. Market size figures from research firms are estimates and vary widely.
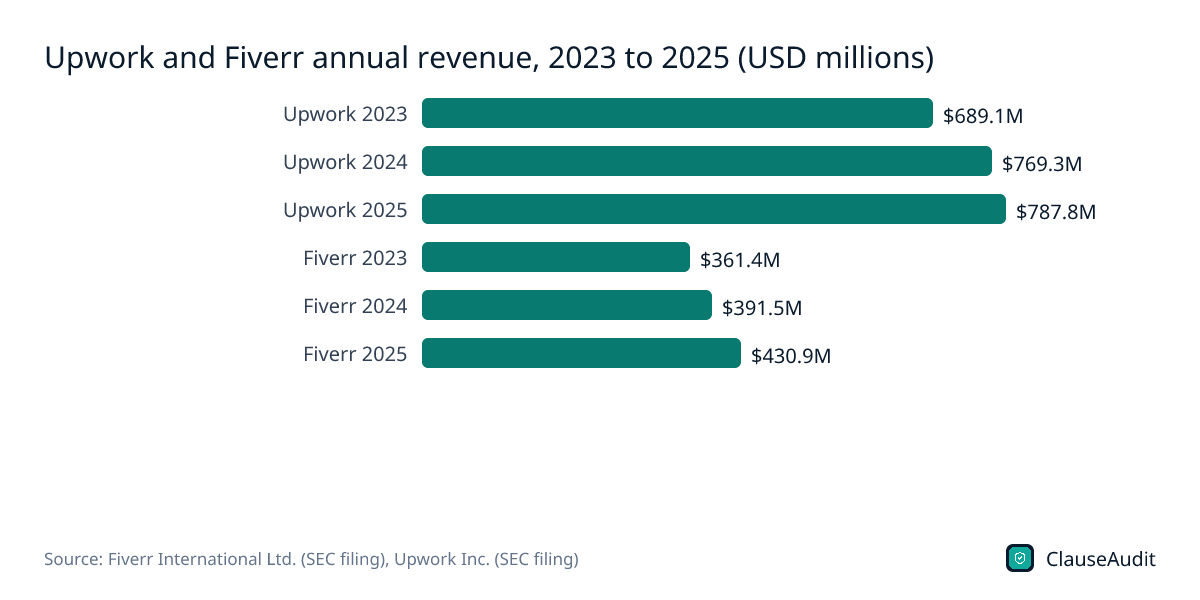
- $787.8 million was Upwork’s total revenue in 2025, up 2% from 2024. (Upwork Inc. (SEC filing), Upwork Inc. Form 10-K for fiscal year ended December 31, 2025, FY2025)
- $4.0 billion in gross services volume flowed through Upwork’s platforms in 2025, from customers in more than 180 countries. (Upwork Inc. (SEC filing), Upwork Inc. Form 10-K for fiscal year ended December 31, 2025, FY2025)
- 18.7% was Upwork’s marketplace take rate in 2025, up from 18.0% in 2024 and 15.4% in 2023. (Upwork Inc. (SEC filing), Upwork Inc. Form 10-K for fiscal year ended December 31, 2025, FY2025)
- 785,000 active clients used Upwork at the end of 2025, down 6% from 832,000 a year earlier. (Upwork Inc. (SEC filing), Upwork Inc. Form 10-K for fiscal year ended December 31, 2025, Dec. 31, 2025)
- $5,129 was Upwork’s gross services volume per active client in 2025, up 7% from $4,815 in 2024. (Upwork Inc. (SEC filing), Upwork Inc. Form 10-K for fiscal year ended December 31, 2025, FY2025)
- $430.9 million was Fiverr’s revenue in 2025, a 10.1% increase over 2024. (Fiverr International Ltd. (SEC filing), Fiverr International Ltd. Form 20-F for fiscal year ended December 31, 2025, FY2025)
- 3.1 million annual active buyers used Fiverr in 2025, down from about 3.6 million in 2024, while marketplace GMV reached $1,073.0 million. (Fiverr International Ltd. (SEC filing), Fiverr International Ltd. Form 20-F for fiscal year ended December 31, 2025, FY2025)
- $342 was Fiverr’s annual spend per buyer at the end of 2025, up from $302 in 2024 and $278 in 2023. (Fiverr International Ltd. (SEC filing), Fiverr International Ltd. Form 20-F for fiscal year ended December 31, 2025, Dec. 31, 2025)
- 27.7% was Fiverr’s marketplace take rate in 2025, compared with 27.6% in 2024. (Fiverr International Ltd. (SEC filing), Fiverr International Ltd. Form 20-F for fiscal year ended December 31, 2025, FY2025)
- 653 active digital labour platforms worldwide were identified by the ILO as of October 2025, including 136 online freelance platforms. (International Labour Organization, Digital labour platforms: Number of platforms and workers (research brief), October 2025)
- $6.4 billion was the estimated global freelance platforms market size in 2025, according to Grand View Research, which projects $24.2 billion by 2033. (Grand View Research, Freelance Platforms Market Size, Share and Trends Report, 2025 (estimate))
- $8.91 billion is Mordor Intelligence’s estimate of the freelance platforms market in 2026, rising to $18.97 billion by 2031. (Mordor Intelligence, Freelance Platforms Market Size and Share Analysis 2026-2031, 2026 (estimate))
- Over 90 million employers and freelancers are registered on Freelancer.com, according to the company's own live site counter (a self-reported figure), checked in October 2026. (Freelancer Technology Pty Limited, About Freelancer.com, October 2026)
Figure 9: Upwork and Fiverr annual revenue, 2023 to 2025 (USD millions)
Chart data
| Label | Value |
|---|---|
| Upwork 2023 | $689.1M |
| Upwork 2024 | $769.3M |
| Upwork 2025 | $787.8M |
| Fiverr 2023 | $361.4M |
| Fiverr 2024 | $391.5M |
| Fiverr 2025 | $430.9M |
AI and Freelancing Statistics: How Generative AI Is Changing Freelance Work
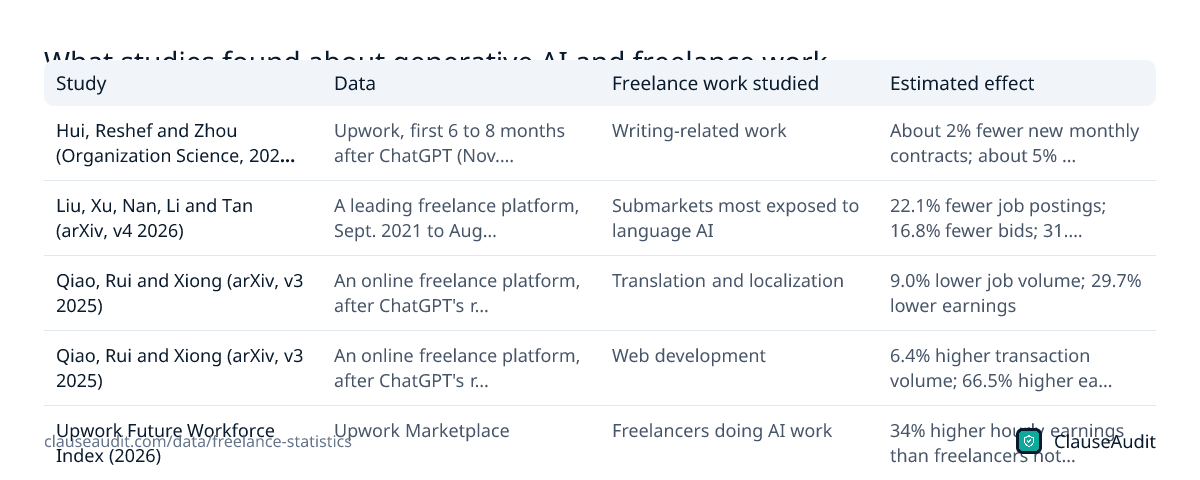
Studies since ChatGPT's launch show losses in writing, translation and image work and gains in technical fields such as web development. Most of these figures come from platform data or company surveys.
- 2% fewer new monthly contracts went to Upwork freelancers in writing-heavy work after ChatGPT's November 2022 launch, Hui, Reshef and Zhou found in a 2024 study. (Brookings Institution, Is generative AI a job killer? Evidence from the freelance market (Hui and Reshef, summarizing Hui, Reshef and Zhou, Organization Science 2024), 2022-2023 data (2024 study))
- 5% lower total monthly earnings hit those writing freelancers in the first months after ChatGPT, and image-generation tools had an identical-sized effect. (Brookings Institution, Is generative AI a job killer? Evidence from the freelance market (Hui and Reshef, summarizing Hui, Reshef and Zhou, Organization Science 2024), 2022-2023 data (2024 study))
- 22.1% decline in job postings hit AI-exposed freelance submarkets after ChatGPT, relative to less-exposed ones, on a leading platform studied by Liu and colleagues. (arXiv (Cornell University), "Generate" the Future of Work through AI: Empirical Evidence from Online Labor Markets (Liu, Xu, Nan, Li and Tan), September 2021 to August 2023 data)
- 31.5% fall in total transaction volume followed in those AI-exposed freelance submarkets, while freelancer bids dropped 16.8%, the same study estimates. (arXiv (Cornell University), "Generate" the Future of Work through AI: Empirical Evidence from Online Labor Markets (Liu, Xu, Nan, Li and Tan), September 2021 to August 2023 data)
- 29.7% drop in earnings hit translation and localization freelancers after ChatGPT's release, while their job volume fell 9.0%, Qiao, Rui and Xiong estimate. (arXiv (Cornell University), AI and Jobs: Has the Inflection Point Arrived? Evidence from an Online Labor Platform (Qiao, Rui and Xiong), Post-ChatGPT (paper v3, December 2025))
- 66.5% rise in earnings went to web development freelancers after ChatGPT, with 6.4% more transactions, suggesting AI helped rather than replaced them. (arXiv (Cornell University), AI and Jobs: Has the Inflection Point Arrived? Evidence from an Online Labor Platform (Qiao, Rui and Xiong), Post-ChatGPT (paper v3, December 2025))
- 34% more per hour is earned by freelancers doing AI work on the Upwork Marketplace than by those not incorporating AI, per Upwork's 2026 Future Workforce Index. (Upwork Inc., Upwork's Future Workforce Index 2026: How AI is Redefining the Value of Work as Skilled Freelancing Accelerates (press release), 2026)
- 45% year-over-year earnings growth went to Upwork freelancers doing more complex work with AI, while per-contract earnings in generative AI creative production fell 13%. (Upwork Inc., Upwork's Future Workforce Index 2026: How AI is Redefining the Value of Work as Skilled Freelancing Accelerates (press release), 2026)
- More than 22% year-over-year growth in Upwork gross services volume came from AI-related work in Q2 2026, even as total GSV fell 4% to $966.4 million. (Upwork Inc. (via SEC EDGAR), Upwork Inc. second quarter 2026 financial results press release (Form 8-K, Exhibit 99.1), Q2 2026)
- Nearly 8 in 10 U.S. independent professionals say AI complements their work and improves productivity, MBO Partners' State of Independence 2026 study found. (MBO Partners by Beeline, U.S. Independent Workforce Reaches Record 74.9 Million as Full-Time Independence Accelerates (State of Independence 2026 press release), 2026 (surveyed April 2026))
- One in four U.S. workers used generative AI as part of their job in the prior month in late 2025, and 81% of users said it saves them time. (Board of Governors of the Federal Reserve System, Economic Well-Being of U.S. Households in 2025 (Survey of Household Economics and Decisionmaking), October 2025)
- 48% of developers in Stack Overflow's 2026 survey said they trust AI when they can easily validate its answers; only 16% trust it for most tasks that are not important work decisions. (Stack Overflow, 2026 Developer Survey: AI, 2026)
- One in four workers worldwide are in an occupation with some generative AI exposure, and 3.3% of global jobs fall in the highest-exposure group, the ILO estimated. (International Labour Organization, Generative AI and Jobs: A Refined Global Index of Occupational Exposure (ILO Working Paper 140), May 2025)
| Study | Data | Freelance work studied | Estimated effect |
|---|---|---|---|
| Hui, Reshef and Zhou (Organization Science, 2024) | Upwork, first 6 to 8 months after ChatGPT (Nov. 2022) | Writing-related work | About 2% fewer new monthly contracts; about 5% lower monthly earnings |
| Liu, Xu, Nan, Li and Tan (arXiv, v4 2026) | A leading freelance platform, Sept. 2021 to Aug. 2023 | Submarkets most exposed to language AI | 22.1% fewer job postings; 16.8% fewer bids; 31.5% lower transaction volume |
| Qiao, Rui and Xiong (arXiv, v3 2025) | An online freelance platform, after ChatGPT's release | Translation and localization | 9.0% lower job volume; 29.7% lower earnings |
| Qiao, Rui and Xiong (arXiv, v3 2025) | An online freelance platform, after ChatGPT's release | Web development | 6.4% higher transaction volume; 66.5% higher earnings |
| Upwork Future Workforce Index (2026) | Upwork Marketplace | Freelancers doing AI work | 34% higher hourly earnings than freelancers not using AI |
India Freelance and Gig Economy Statistics
India counts gig and platform workers through the e-Shram registration portal and NITI Aayog projections. New labour codes add social security contributions from aggregators.
- 11.5 lakh platform workers had registered on India's e-Shram portal by August 2026, according to the Press Information Bureau. (Press Information Bureau, Government of India, 5 Years of e-Shram Portal: Building an Inclusive Social Security Ecosystem, August 2026)
- 31.89 crore unorganised workers were registered on e-Shram by August 18, 2026, and women made up 54.28% of registrants. (Press Information Bureau, Government of India, 5 Years of e-Shram Portal: Building an Inclusive Social Security Ecosystem, August 2026)
- 2.35 crore gig workers, 4.1% of total livelihood in India, were projected for 2029-30 in NITI Aayog's June 2022 report, up from 77 lakh in 2020-21. (NITI Aayog, Government of India, India's Booming Gig and Platform Economy: Perspectives and Recommendations on the Future of Work, Projection to 2029-30 (2022 report))
- 77 lakh Indians worked in the gig economy in 2020-21, 1.5% of the total workforce, NITI Aayog estimated in its June 2022 report. (NITI Aayog, Government of India, India's Booming Gig and Platform Economy: Perspectives and Recommendations on the Future of Work, 2020-21 (2022 report))
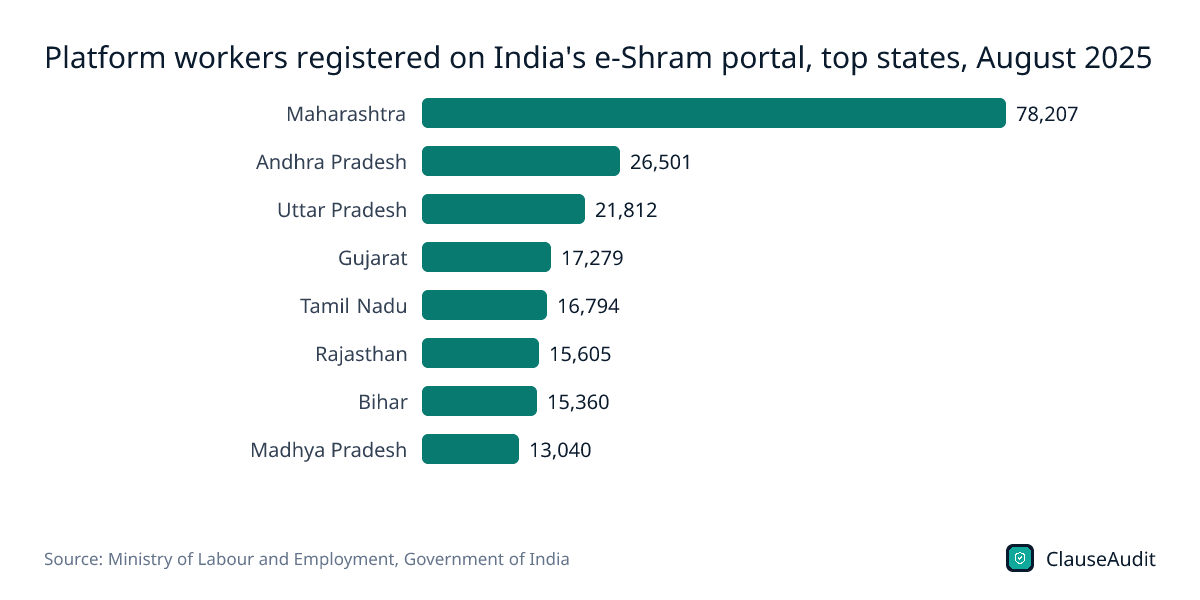
- 78,207 platform workers registered on e-Shram in Maharashtra as of August 6, 2025, the most of any Indian state or union territory. (Ministry of Labour and Employment, Government of India, Lok Sabha Unstarred Question No. 3658: Social Security for Online Platform Gig Workers (with annexure), August 2025)
- 1-2% of annual turnover must go from aggregators to a gig worker Social Security Fund under India's Code on Social Security, capped at 5% of worker payouts. (Press Information Bureau, Government of India, Labour Reforms: Formalising and Safeguarding India's Gig & Platform Workforce, 2025 onward)
- 1% to 5% of each payout to a gig worker is the welfare fee aggregators would pay under Karnataka's 2025 platform gig workers bill. (PRS Legislative Research, Bill Summary: Karnataka Platform-based Gig Workers (Social Security and Welfare) Bill, 2025, 2025)
- Rs. 5 lakh per family per year is the AB-PMJAY health cover promised to platform workers in Budget 2025-26, though that scheme had not launched by August 2025. (Press Information Bureau, Government of India (citing NITI Aayog estimates), Social Security Boost for India's Gig Workers, 2025)
- 56.2% of Indian workers were self-employed in 2025, down from 57.5% in 2024 and 58.2% in 2023, per the Periodic Labour Force Survey. (National Statistics Office, Ministry of Statistics and Programme Implementation, Press Note on Periodic Labour Force Survey Annual Report 2025 (January to December 2025), 2025)
- ₹17,914 was the average earnings of self-employed men in India in 2025, up about 6.0% from ₹16,893 in 2024; self-employed women averaged ₹6,374. (National Statistics Office, Ministry of Statistics and Programme Implementation, Press Note on Periodic Labour Force Survey Annual Report 2025 (January to December 2025), 2025)
- 2,56,892 delayed-payment applications by micro and small enterprises are recorded on India's legacy MSME Samadhaan portal; new filings now go to the MSME ODR Portal and are not included. (Ministry of Micro, Small and Medium Enterprises, Government of India, MSME Samadhaan: Delayed Payment Monitoring System dashboard (legacy portal; new filings now go to the MSME ODR Portal), Legacy Samadhaan total, viewed October 2026)
- Rs 31,720.61 crore was payable in the 1,13,259 delayed-payment cases filed with India's MSE Facilitation Councils on the legacy Samadhaan system; Rs 10,490.36 crore was involved in disposed cases. (Ministry of Micro, Small and Medium Enterprises, Government of India, MSME Samadhaan: Delayed Payment Monitoring System dashboard (legacy portal; new filings now go to the MSME ODR Portal), Legacy Samadhaan total, viewed October 2026)
- 2 of 11 Indian gig platforms rated by Fairwork in 2024 showed all workers earn at least the local minimum wage after work costs. (Fairwork India (CITAPP, IIIT Bangalore, with the Oxford Internet Institute), Fairwork India Ratings 2024: Labour Standards in the Platform Economy, 2024)
Figure 11: Platform workers registered on India's e-Shram portal, top states, August 2025
Chart data
| Label | Value |
|---|---|
| Maharashtra | 78,207 |
| Andhra Pradesh | 26,501 |
| Uttar Pradesh | 21,812 |
| Gujarat | 17,279 |
| Tamil Nadu | 16,794 |
| Rajasthan | 15,605 |
| Bihar | 15,360 |
| Madhya Pradesh | 13,040 |
Global Freelance Statistics: Online Gig Workers Worldwide
Worldwide, online gig work is measured mainly through World Bank and ILO estimates. National surveys in the EU, UK, Brazil, Australia and Singapore fill in local detail.
- 154 million to 435 million people worldwide did online gig work, according to World Bank estimates published in 2023. (World Bank, Working Without Borders: The Promise and Peril of Online Gig Work (overview), 2023)
- 4.4% to 12.5% of the global labor force were online gig workers, by the World Bank’s 2023 estimate. (World Bank, Working Without Borders: The Promise and Peril of Online Gig Work (overview), 2023)
- 132.5 million people worldwide did online gig work as their main job, according to the World Bank’s 2023 survey-based estimate. (World Bank, Working Without Borders: The Promise and Peril of Online Gig Work (overview), 2023)
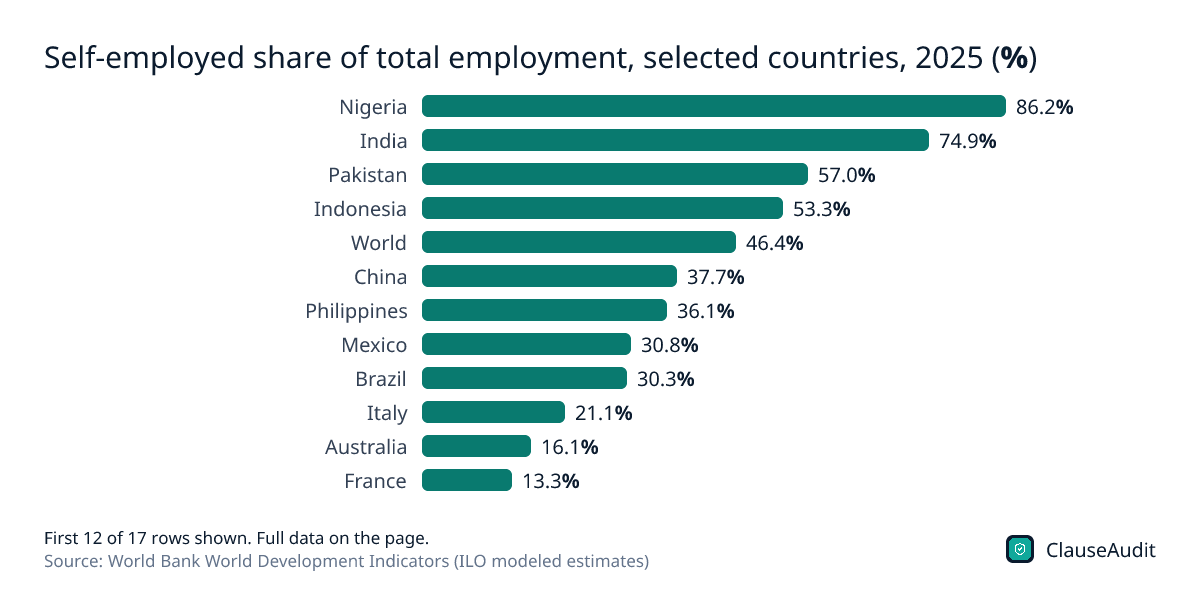
- 46.4% of employed people worldwide were self-employed in 2025, by modeled ILO estimates, compared with 6.1% in the United States. (World Bank World Development Indicators (ILO modeled estimates), Self-employed, total (% of total employment) (modeled ILO estimate), indicator SL.EMP.SELF.ZS, 2025)
- 3.0% of people aged 15 to 64 in 16 EU countries and Norway worked through digital platforms for at least one hour in 2022. (Eurostat, 3% of people worked through digital platforms in 2022, 2022 (published July 2024))
- 62.4% of digital platform workers in Eurostat’s 2022 pilot survey of 16 EU countries and Norway were not covered for unemployment, and 56.3% lacked sickness coverage. (Eurostat, 3% of people worked through digital platforms in 2022, 2022 (published July 2024))
- More than 28 million people in the EU worked through digital labour platforms in 2021, and the European Commission projected at the time that this would reach 43 million in 2025. (European Commission, Commission proposals to improve the working conditions of people working through digital labour platforms (IP/21/6605), 2021 (with a 2021 projection for 2025))
- 554 Members of the European Parliament voted to adopt the Platform Work Directive in April 2024, giving member states two years to transpose it. (European Parliament, Parliament adopts platform work directive, April 2024)
- 4.53 million people in the UK were self-employed in May to July 2026, below the 4.96 million annual average recorded in 2019. (Office for National Statistics (UK), LFS: Self-employed: UK: All: 000s: SA (series MGRQ), May-July 2026)
- 2.0 million people in Brazil worked through digital service platforms in the third quarter of 2025, 1.9% of all employed people. (IBGE (Brazilian Institute of Geography and Statistics), Trabalho por meio de plataformas digitais (PNAD Contínua, 3rd quarter 2025), Q3 2025)
- 0.96% of employed Australians did digital platform work in 2022-23, and 53% of them did it on top of a main job. (Australian Bureau of Statistics, Digital platform workers in Australia, 2022-23 (released Nov. 2023))
- 7% was the average yearly growth from 2016 to 2024 in Singapore platform workers who preferred platform work as their main job. (Singapore Ministry of Manpower, Global Dialogue on Digital Platform Work (press release), 2016-2024)
- 5.7% of Norway’s working-age population had offered a good or service via a digital platform, the highest of the national surveys the ILO compiled. (International Labour Organization, Digital labour platforms: Number of platforms and workers (research brief), Latest national surveys (ILO brief, Feb. 2026))
Figure 12: Self-employed share of total employment, selected countries, 2025 (%)
Chart data
| Label | Value |
|---|---|
| Nigeria | 86.2% |
| India | 74.9% |
| Pakistan | 57.0% |
| Indonesia | 53.3% |
| World | 46.4% |
| China | 37.7% |
| Philippines | 36.1% |
| Mexico | 30.8% |
| Brazil | 30.3% |
| Italy | 21.1% |
| Australia | 16.1% |
| France | 13.3% |
| United Kingdom | 13.1% |
| Canada | 12.9% |
| Japan | 9.1% |
| Germany | 8.1% |
| United States | 6.1% |
What the numbers mean for freelancers
The headline counts vary so much that a single figure is misleading. BLS put independent contractors at 11.9 million in July 2023, while MBO Partners counted 74.9 million Americans with independent income in 2026. Both can be right. The first measures people whose main job is contracting; the second includes anyone with side income. The steady part is the core: about 7.4% of US workers contract as their main job.
Pay is the bigger story. Full-time independent contractors earned a median $949 a week in July 2023, against $1,132 for workers in traditional jobs. That gap widens once you add the costs freelancers cover themselves: the 15.3% self-employment tax, health insurance, and retirement saving. Employer family health coverage averaged $26,993 a year in 2025, and 72% of private industry employees had access to employer retirement benefits in March 2026.
Income is also less predictable. In 2025, 58% of self-employed adults said their income varied from month to month, and 22% struggled to pay bills because of it, more than double the 10% of employees.
Late payment tops the complaint data
Where public complaint data exists, payment problems dominate. Of 829 complaints filed under New York City's Freelance Isn't Free Act in 2025, 751 alleged late or missing payment and 207 alleged the client refused to sign a written contract. In a follow-up survey covering fiscal 2019 to 2023, 49% of freelancers who complained said they were not paid anything after complaining.
Most of these disputes involve small amounts. Over that period, 51% of the contracts behind NYC complaints were worth $5,000 or less, and only 16% of complainants later took their claim to court. For amounts that small, the terms in the contract often matter more than the option to sue.
What to do with this data
- Get every project in writing. New York City and New York State require a written contract for work of $800 or more, Illinois covers $500 over 120 days, and Seattle applies its rules from $600 a year with one client.
- Set a payment date in the contract. In Illinois the default is 30 days when the contract names none, and a clear date gives you something to enforce.
- Price in your own benefits and taxes. A rate that only matches an employee's salary leaves you short once the 15.3% self-employment tax and insurance come out.
- Ask for a deposit on larger jobs, since most complaints involve small contracts that are costly to pursue.
- Keep records. New York State requires hiring parties to keep freelance contracts for six years, and your own copy is your best evidence in a dispute.
- Check classification. California can assess $5,000 to $25,000 per violation for willful misclassification, and federal rules are under review again in 2026.
Check your freelance contract before you sign
The numbers on this page point to the same weak spots: unclear payment terms, no written contract, and work that can be rejected or cancelled without pay. An automated review of your agreement flags those clauses and explains them in plain English, so you know what to ask a client to change.
- Payment due date, late fees and whether payment depends on subjective client approval
- Deposit, milestone payments and a kill fee if the project is cancelled
- Revision limits and a clear definition of the deliverables
- Who owns the work, including drafts, unused concepts and your pre-existing tools
- Non-solicitation or non-compete terms that limit future clients
- Liability, indemnification and how disputes are resolved
Frequently asked questions
How many freelancers are there in the US?
It depends on the definition. BLS counted 11.9 million independent contractors on their main job in July 2023, 7.4% of employment. Census found 32.0 million nonemployer businesses in 2024, and MBO Partners counted 74.9 million Americans with independent income in 2026.
How much do freelancers make on average?
Full-time independent contractors earned a median $949 a week in July 2023, compared with $1,132 for full-time workers in traditional jobs, according to BLS. Among nonemployer businesses, 60.4% took in under $25,000 in 2024.
How common is late payment for freelancers?
Very common where it is tracked. Of 829 complaints under New York City's Freelance Isn't Free Act in 2025, 751 alleged late or missing payment. On Bonsai, 31% of invoices from female freelancers and 24% from male freelancers were paid late.
What tax rate do freelancers pay?
Freelancers pay a 15.3% federal self-employment tax on net earnings, made up of 12.4% for Social Security and 2.9% for Medicare, once net self-employment earnings reach $400 or more. Income tax comes on top, and 41 states tax wage and salary income in 2026.
When does a client have to send a 1099-NEC?
For nonemployee compensation paid after 2025, the Form 1099-NEC reporting threshold is $2,000, and it may be adjusted for inflation from 2027. Payment apps and marketplaces issue Form 1099-K at $20,000 across more than 200 transactions.
Is AI reducing freelance work?
It depends on the field. One study found translation freelancers' earnings fell 29.7% after ChatGPT's release, while web development freelancers saw earnings rise 66.5%. Another found job postings in AI-exposed freelance submarkets fell 22.1%.
How many people do online gig work worldwide?
The World Bank estimated in 2023 that 154 million to 435 million people worldwide do online gig work, 4.4% to 12.5% of the global labor force, with 132.5 million doing it as their main job.
Use this data
Every chart and card below is free to reuse under CC BY 4.0. Download what you need and link back to this page.
 Stat cards
 Key findings card
 Infographic
 How many U.S. freelancers? Counts by definition (millions)
 Share of U.S. nonemployer businesses by annual receipts, 2024 (%)
 Nonfarm sole proprietorship profits, tax years 2015 to 2023 (billions of current dollars) (USD billions)
 Independent contractors as a share of U.S. employment, 1995 to 2023 (%)
 Freelance Isn't Free Act complaints to New York City's Navigation Program, FY2019 to FY2023
 Income variability and related hardship: self-employed vs employees, 2025 (% of adults)
 Platform workers registered on India's e-Shram portal, top states, August 2025
 Share of U.S. workers who are independent contractors, by occupation group, July 2023 (%)
 Upwork and Fiverr annual revenue, 2023 to 2025 (USD millions)
 Self-employed share of total employment, selected countries, 2025 (%)
 What studies found about generative AI and freelance work
 U.S. freelance protection laws and federal independent contractor rules, 2017 to 2026
Embed the infographic
Free to share on your site, blog or slides under CC BY 4.0. Please keep the credit link.
Sources and method
Every number on this page comes from the sources below, each opened and read on or before October 17, 2026. A second, independent review checked every figure against its source and corrected anything that did not match. Figures that could not be confirmed were left out.
- U.S. Bureau of Labor Statistics, Contingent and Alternative Employment Arrangements, July 2023 (USDL-24-2267) (November 8, 2024)
- Federal Reserve Bank of St. Louis (FRED), from U.S. Bureau of Labor Statistics data, Employment Level - All Industries Self-Employed, Unincorporated (LNU02027714), thousands, not seasonally adjusted (Updated October 2, 2026 (data through September 2026))
- U.S. Bureau of Labor Statistics, Current Population Survey series LNU02048984: Employment Level, Total wage and salary, incorporated self employed (thousands, not seasonally adjusted) (Retrieved October 18, 2026 (data through September 2026))
- U.S. Census Bureau, 2024 Nonemployer Statistics, U.S. file (nonemp24us) (2024 data year)
- U.S. Census Bureau, Nonemployer Statistics U.S. record layout (receipts size class and legal form codes) (2017 layout (codes used in later U.S. files))
- MBO Partners by Beeline, U.S. Independent Workforce Reaches Record 74.9 Million as Full-Time Independence Accelerates (State of Independence 2026 press release) (2026 (survey fielded April 2026 by Emergent Research and Radius Insights))
- MBO Partners, State of Independence 2025 report (2025)
- Upwork Inc., Upwork's Future Workforce Index 2026: How AI is Redefining the Value of Work as Skilled Freelancing Accelerates (press release) (July 14, 2026 (survey of 2,400 U.S.-based skilled workers, March to April 2026))
- Upwork Inc. (via SEC EDGAR), Upwork Inc. second quarter 2026 financial results press release (Form 8-K, Exhibit 99.1) (August 10, 2026)
- Board of Governors of the Federal Reserve System, Economic Well-Being of U.S. Households in 2024: Employment and Gig Work (May 2025 (survey fielded October 2024))
- Board of Governors of the Federal Reserve System, Economic Well-Being of U.S. Households in 2025 (Survey of Household Economics and Decisionmaking) (May 2026 (survey fielded October 2025))
- National Bureau of Economic Research, Understanding the Digital Platform Workforce in the US: Evidence from the Entrepreneurship in the Population Survey (Atkins, Brummet and Johnson) (Draft dated May 6, 2025; chapter in The Changing Nature of Work (2026))
- Pew Research Center, The State of Gig Work in 2021 (December 8, 2021)
- U.S. Government Accountability Office, Work Arrangements: Improved Collaboration Could Enhance Labor Force Data (GAO-24-105651) (December 12, 2023)
- U.S. Government Accountability Office, Taxpayer Compliance: More Income Reporting Needed for Taxpayers Working through Online Platforms (GAO-20-366) (May 28, 2020 (publicly released June 29, 2020))
- Stack Overflow, 2025 Developer Survey: Work (employment status) (2025)
- Internal Revenue Service, Self-employment tax (Social Security and Medicare taxes) (Last reviewed June 27, 2026)
- Internal Revenue Service, Instructions for Forms 1099-MISC and 1099-NEC (Rev. December 2026)
- Internal Revenue Service, IR-2025-107: IRS issues FAQs on Form 1099-K threshold under the One, Big, Beautiful Bill; dollar limit reverts to $20,000 (October 23, 2025)
- Internal Revenue Service, Statistics of Income Division, Sole Proprietorship Returns, Tax Year 2022 (Statistics of Income Bulletin, Dungan and Snyder) (Spring 2025)
- Internal Revenue Service, Tax Gap Projections for Tax Year 2022 (Publication 5869) (Rev. October 2024)
- Tax Foundation, State Individual Income Tax Rates and Brackets, 2026 (February 17, 2026 (updated February 19, 2026))
- Editorial Freelancers Association, Editorial Rates, 2026 Rate Chart (2026 (member survey November 2025 to mid-January 2026, 2025 rates))
- The Authors Guild, Key Takeaways from the 2023 Author Income Survey (2023 (2022 income))
- Brookings Institution, Is generative AI a job killer? Evidence from the freelance market (Hui and Reshef, summarizing Hui, Reshef and Zhou, Organization Science 2024) (July 8, 2025)
- arXiv (Cornell University), "Generate" the Future of Work through AI: Empirical Evidence from Online Labor Markets (Liu, Xu, Nan, Li and Tan) (v4, June 25, 2026 (data September 2021 to August 2023))
- arXiv (Cornell University), AI and Jobs: Has the Inflection Point Arrived? Evidence from an Online Labor Platform (Qiao, Rui and Xiong) (v3, December 12, 2025)
- International Labour Organization, Generative AI and Jobs: A Refined Global Index of Occupational Exposure (ILO Working Paper 140) (May 20, 2025)
- U.S. Bureau of Labor Statistics (Commissioner's Corner), Contingent jobs and alternative work arrangements: what you need to know (December 20, 2024)
- Bureau of Labor Statistics, via the Federal Register, Proposed Revision of Information Collection; Contingent Work Supplement to the Current Population Survey (FR Doc. 2026-02629) (February 10, 2026)
- MBO Partners, 2024 State of Independence in America (2024 edition)
- U.S. Census Bureau (America Counts), Number of U.S. Nonemployers Grew Faster Than Employer Businesses Nearly Every Year From 2012 to 2023 (July 30, 2025)
- U.S. Census Bureau, The Gig Picture: 2024 Nonemployer Statistics Provide Insight Into the Gig Economy (September 2026)
- U.S. Census Bureau, Business Formation Statistics, September 2026 (CB26-163) (October 14, 2026)
- JPMorgan Chase Institute, The Online Platform Economy through the Pandemic (October 2021 (data April 2018 to June 2021))
- NYC Department of Consumer and Worker Protection, Worker Protection Metrics at the New York City Department of Consumer and Worker Protection, 2025 (2025 calendar-year data)
- NYC Department of Consumer and Worker Protection, Freelance Isn't Free Act Five-Year Report (November 2023 (covers FY2019 to FY2023))
- Illinois Department of Labor, Freelance Worker Protection Act (Retrieved October 18, 2026)
- Xero, Xero Small Business Insights: United States, June 2026 quarter (June 2026 quarter)
- Intuit QuickBooks, 2026 Small Business Late Payments Report (July 2026)
- Bonsai, How often do freelancers get paid late? It depends if you're a woman or man (January 8, 2026 (three years of Bonsai invoicing data))
- London Economics for the UK Department for Business and Trade and the Office of the Small Business Commissioner, Late Payments Research: Estimating the total economic cost of late payments and their impact on the UK economy (July 2025)
- UK Office of the Small Business Commissioner, Payment times are improving as new legislation dawns (July 15, 2026)
- U.S. Department of the Treasury, Office of Tax Analysis, Affordable Care Act Marketplace Coverage for the Self-Employed and Small Business Owners in 2023 (January 14, 2025)
- U.S. Bureau of Labor Statistics, Employee Benefits in the United States, March 2026 (September 25, 2026 (March 2026 reference period))
- KFF, 2025 Employer Health Benefits Survey (2025)
- Internal Revenue Service, SEP contribution limits (including grandfathered SARSEPs) (Retrieved October 18, 2026 (2026 limits))
- Press Information Bureau, Government of India, 5 Years of e-Shram Portal: Building an Inclusive Social Security Ecosystem (August 25, 2026)
- Press Information Bureau, Government of India (citing NITI Aayog estimates), Social Security Boost for India's Gig Workers (August 30, 2025)
- Press Information Bureau, Government of India, Labour Reforms: Formalising and Safeguarding India's Gig & Platform Workforce (December 9, 2025)
- Ministry of Labour and Employment, Government of India, Lok Sabha Unstarred Question No. 3658: Social Security for Online Platform Gig Workers (with annexure) (Answered August 11, 2025 (data as on August 6, 2025))
- PRS Legislative Research, Bill Summary: Karnataka Platform-based Gig Workers (Social Security and Welfare) Bill, 2025 (2025)
- National Statistics Office, Ministry of Statistics and Programme Implementation, Press Note on Periodic Labour Force Survey Annual Report 2025 (January to December 2025) (March 27, 2026)
- Ministry of Micro, Small and Medium Enterprises, Government of India, MSME Samadhaan: Delayed Payment Monitoring System dashboard (legacy portal; new filings now go to the MSME ODR Portal) (Live dashboard, retrieved October 18, 2026)
- Fairwork India (CITAPP, IIIT Bangalore, with the Oxford Internet Institute), Fairwork India Ratings 2024: Labour Standards in the Platform Economy (October 2024)
- U.S. Bureau of Labor Statistics, Table 6. Employed workers with alternative and traditional work arrangements by occupation, industry and other characteristics, July 2023 (November 8, 2024)
- U.S. Census Bureau, Census Bureau Releases New Data About Characteristics of Employer and Nonemployer Business Owners (2023 NES-D) (November 20, 2025)
- Board of Governors of the Federal Reserve System, Economic Well-Being of U.S. Households in 2025: Employment and Job Quality (May 2026 (survey fielded October 2025))
- New York State Department of Labor, Freelance Isn’t Free Act (Retrieved October 17, 2026)
- New York State Senate, New York General Business Law Section 1410 (Definitions) (Retrieved October 17, 2026)
- New York State Senate, New York General Business Law Section 1412 (Written contracts) (Retrieved October 17, 2026)
- Seattle Office of Labor Standards, Independent Contractor Protections Ordinance (Retrieved October 17, 2026)
- California Department of Industrial Relations, Labor Commissioner’s Office, Independent Contractor versus Employee (FAQ) (Retrieved October 17, 2026)
- U.S. Department of Labor, Wage and Hour Division, Employee or Independent Contractor Classification Under the FLSA: Rulemaking (Retrieved October 17, 2026)
- U.S. Department of Labor via Federal Register (GovInfo), Employee or Independent Contractor Status Under the FLSA, FMLA and MSPA (proposed rule, 91 FR 9932) (February 27, 2026)
- Upwork Inc. (SEC filing), Upwork Inc. Form 10-K for fiscal year ended December 31, 2025 (February 2026 (fiscal year 2025))
- Fiverr International Ltd. (SEC filing), Fiverr International Ltd. Form 20-F for fiscal year ended December 31, 2025 (2026 (fiscal year 2025))
- International Labour Organization, Digital labour platforms: Number of platforms and workers (research brief) (February 16, 2026)
- Grand View Research, Freelance Platforms Market Size, Share and Trends Report (Retrieved October 17, 2026 (estimate))
- Mordor Intelligence, Freelance Platforms Market Size and Share Analysis 2026-2031 (Retrieved October 17, 2026 (estimate))
- Freelancer Technology Pty Limited, About Freelancer.com (Site counter retrieved October 18, 2026)
- World Bank, Working Without Borders: The Promise and Peril of Online Gig Work (overview) (September 2023)
- World Bank World Development Indicators (ILO modeled estimates), Self-employed, total (% of total employment) (modeled ILO estimate), indicator SL.EMP.SELF.ZS (Last updated October 8, 2026 (2025 values))
- Eurostat, 3% of people worked through digital platforms in 2022 (July 18, 2024 (2022 pilot survey))
- European Parliament, Parliament adopts platform work directive (April 24, 2024)
- Australian Bureau of Statistics, Digital platform workers in Australia (November 13, 2023 (2022-23 data))
- Office for National Statistics (UK), LFS: Self-employed: UK: All: 000s: SA (series MGRQ) (Released September 15, 2026)
- IBGE (Brazilian Institute of Geography and Statistics), Trabalho por meio de plataformas digitais (PNAD Contínua, 3rd quarter 2025) (September 4, 2026 (experimental statistics))
- Singapore Ministry of Manpower, Global Dialogue on Digital Platform Work (press release) (September 29, 2025)
- Internal Revenue Service, Statistics of Income Division, Table 1. Nonfarm Sole Proprietorships: Business Receipts, Selected Deductions, Payroll, and Net Income, by Industrial Sectors, Tax Year 2023 (23sp01br.xls) (2026 (listed on the SOI nonfarm sole proprietorship statistics page, last reviewed July 20, 2026))
- Stack Overflow, 2026 Developer Survey: AI (2026)
- Federal Reserve Banks (Small Business Credit Survey), 2026 Chartbook on Nonemployer Firms: Findings from the 2025 Small Business Credit Survey with Trends over Time (July 2026 (doi.org/10.55350/sbcs-20260707))
- NITI Aayog, Government of India, India's Booming Gig and Platform Economy: Perspectives and Recommendations on the Future of Work (June 2022)
- European Commission, Commission proposals to improve the working conditions of people working through digital labour platforms (IP/21/6605) (December 9, 2021)
Cite this page
ClauseAudit, “Freelance Statistics 2026: 150+ Numbers on US and Global Freelancers”, updated October 17, 2026, https://clauseaudit.com/data/freelance-statistics. Free to reuse with a link back (CC BY 4.0).
This page summarises published data and law as checked on October 17, 2026. Figures are updated as new editions are released, and your own situation may differ. It is general information, not legal, tax or financial advice.