How Much Do Freelancers Make? Freelance Earnings Statistics 2026
By ClauseAudit Research · 13 sources ·
How much do freelancers make?
Less than employees, on average. Full-time independent contractors, the federal category that includes freelancers, earned a median $949 a week in July 2023, against $1,132 for workers in traditional jobs. The spread is wide, though: 5.8 million independent professionals earned more than $100,000 in 2026, while most small solo businesses gross very little.

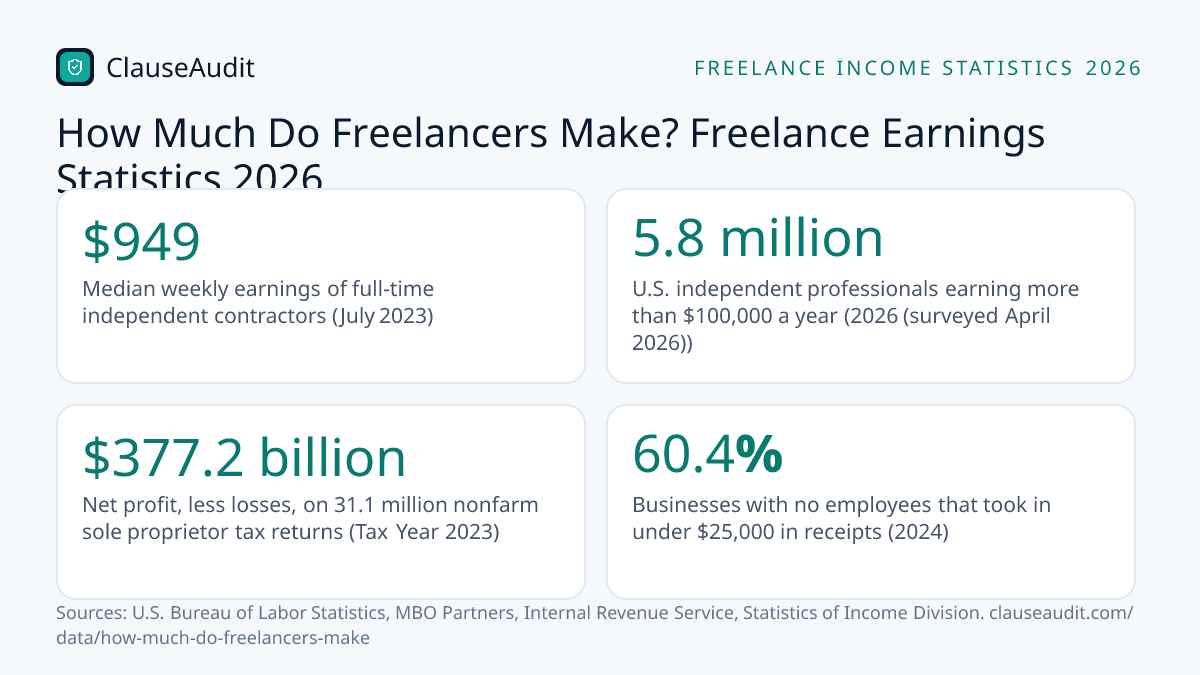
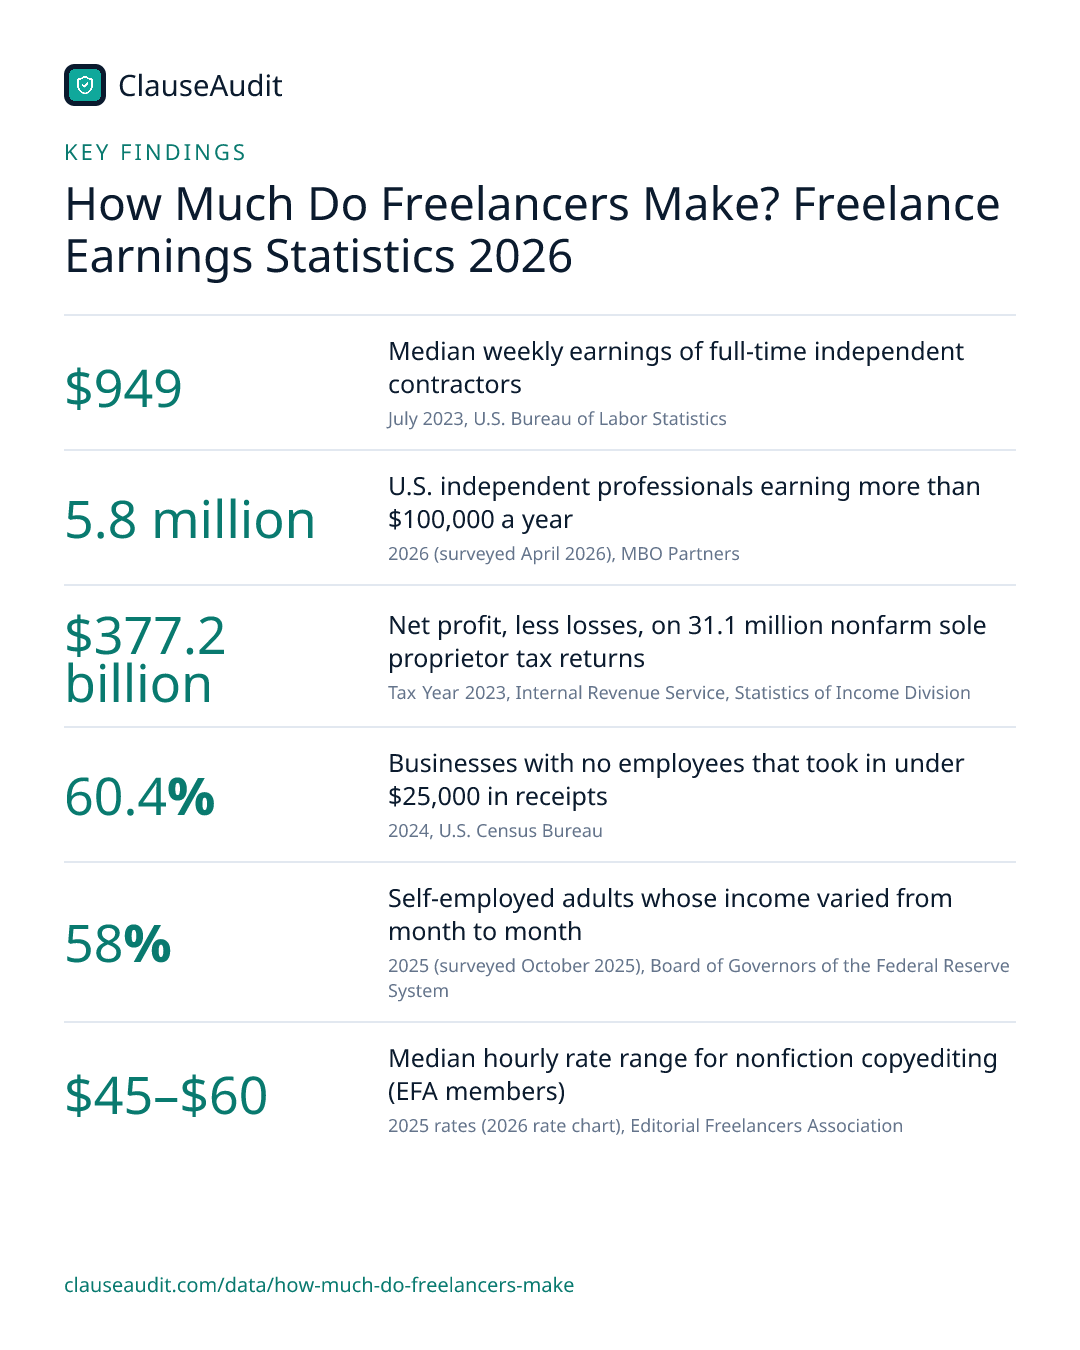
- Median weekly earnings of full-time independent contractors (July 2023, U.S. Bureau of Labor Statistics)
- $949
- U.S. independent professionals earning more than $100,000 a year (2026 (surveyed April 2026), MBO Partners)
- 5.8 million
- Net profit, less losses, on 31.1 million nonfarm sole proprietor tax returns (Tax Year 2023, Internal Revenue Service, Statistics of Income Division)
- $377.2 billion
- Businesses with no employees that took in under $25,000 in receipts (2024, U.S. Census Bureau)
- 60.4%
- Self-employed adults whose income varied from month to month (2025 (surveyed October 2025), Board of Governors of the Federal Reserve System)
- 58%
- Median hourly rate range for nonfiction copyediting (EFA members) (2025 rates (2026 rate chart), Editorial Freelancers Association)
- $45–$60
- Hourly earnings premium for Upwork freelancers doing AI work (2026 (Upwork Marketplace data), Upwork Inc.)
- 34% more per hour
Ask ten freelancers what they earn and you will get ten very different answers. That is not evasion. Freelance income really does run from pocket money to a comfortable professional salary, and the averages hide most of the story.
This page pulls together the most reliable U.S. figures: federal earnings data, IRS tax returns, Census business counts, a Federal Reserve household survey and rate surveys from working freelancers. Below the charts, you will find what the numbers mean for your own rates and the contract terms that decide how much of your invoice you actually collect.
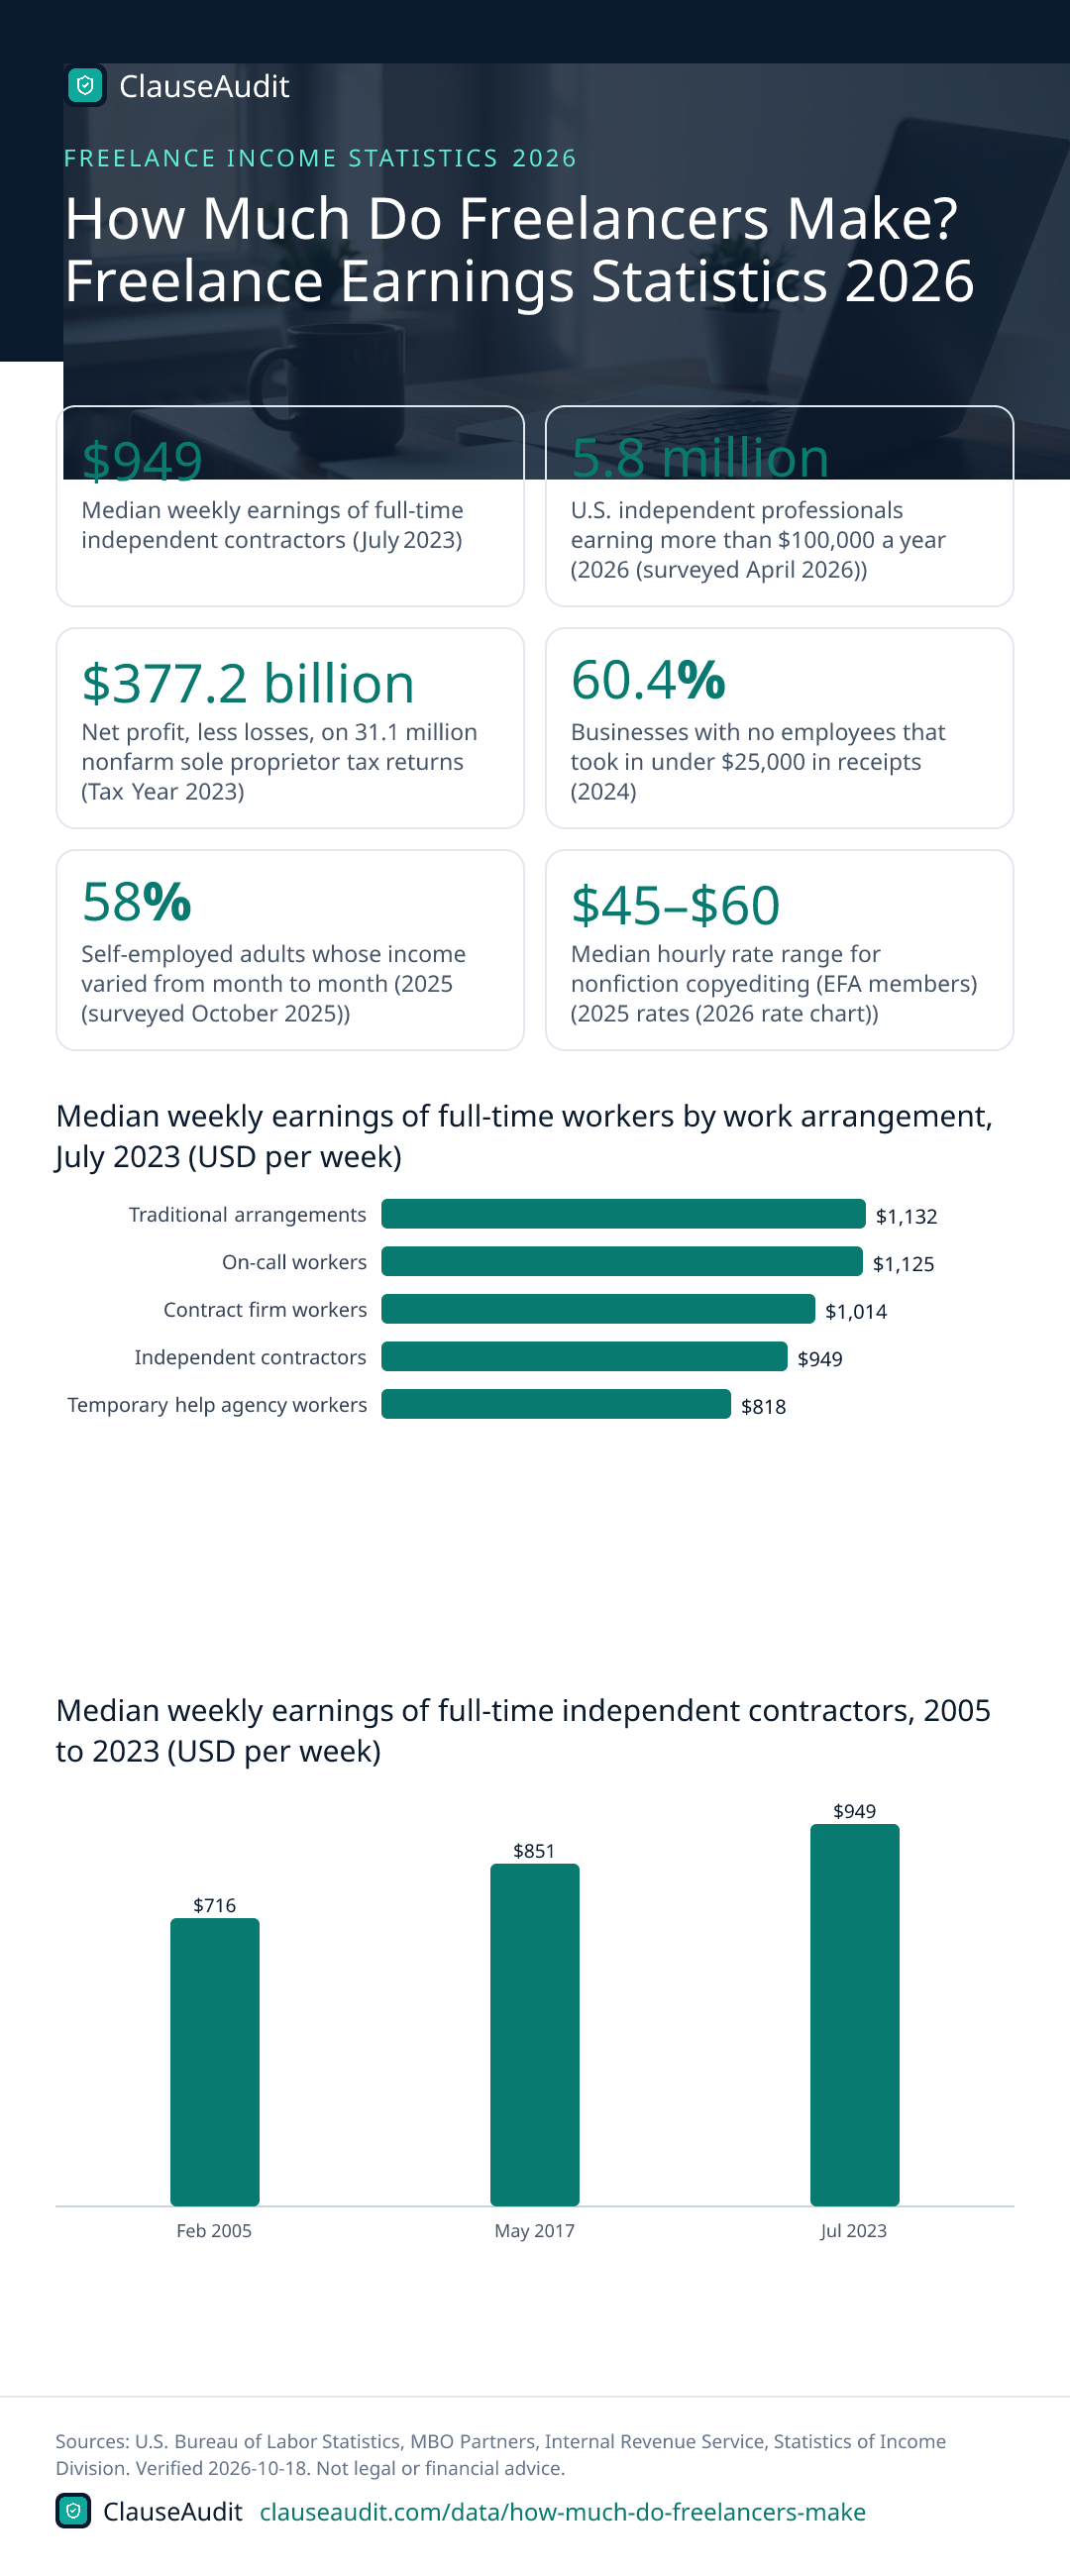
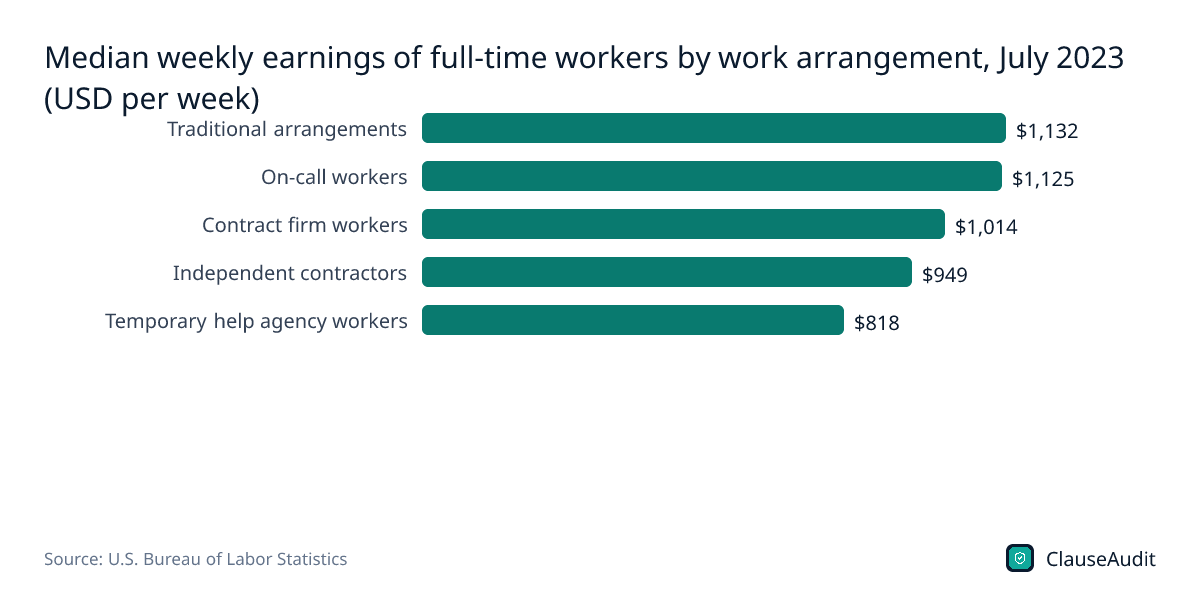
Median weekly earnings of full-time workers by work arrangement, July 2023 (USD per week)
Chart data
| Label | Value |
|---|---|
| Traditional arrangements | $1,132 |
| On-call workers | $1,125 |
| Contract firm workers | $1,014 |
| Independent contractors | $949 |
| Temporary help agency workers | $818 |
Full-time independent contractors earned $949 a week, behind traditional employees at $1,132 and ahead of temp agency workers at $818. Remember the contractor figure is before you pay for your own health cover, retirement and the employer half of payroll tax.
Download this chart (PNG)Median weekly earnings of full-time independent contractors, 2005 to 2023 (USD per week)
Chart data
| Label | Value (USD per week) |
|---|---|
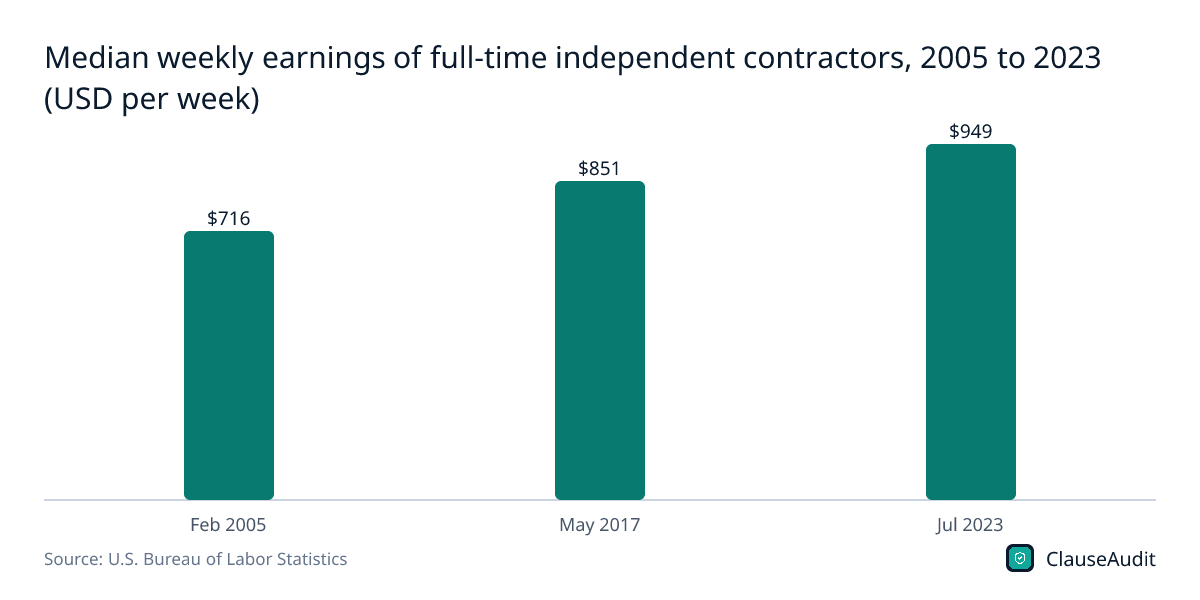
| Feb 2005 | $716 |
| May 2017 | $851 |
| Jul 2023 | $949 |
Contractor pay rose from $716 in 2005 to $851 in 2017 and $949 in 2023, in current dollars. In 2017 contractors trailed traditional workers by only a little, $851 against $884. By 2023 the gap had opened to $949 against $1,132.
Download this chart (PNG)U.S. independents earning more than $100,000 a year, 2011 to 2026 (millions of people)
Chart data
| Label | Value (millions of people) |
|---|---|
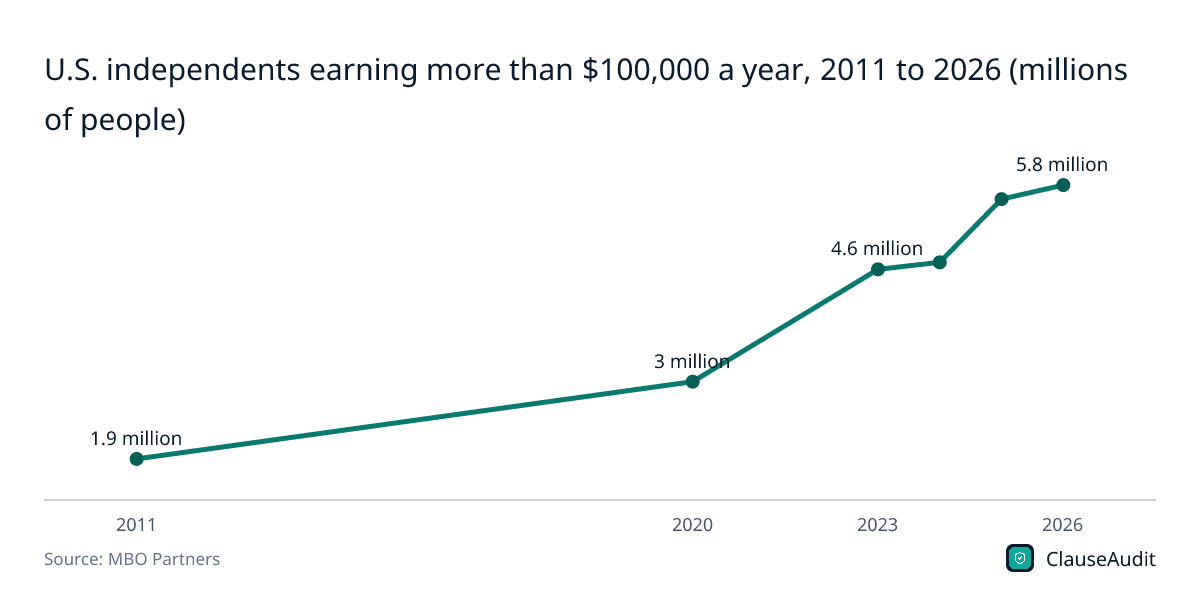
| 2011 | 1.9 million |
| 2020 | 3 million |
| 2023 | 4.6 million |
| 2024 | 4.7 million |
| 2025 | 5.6 million |
| 2026 | 5.8 million |
The count of independents earning six figures climbed from 1.9 million in 2011 to 5.8 million in 2026. This comes from an industry survey with a broad definition of independent work, so read it as a direction of travel, not an exact headcount.
Download this chart (PNG)Average net profit per sole proprietor tax return, selected freelance-heavy industries, tax year 2023 (USD per return)
Chart data
| Label | Value |
|---|---|
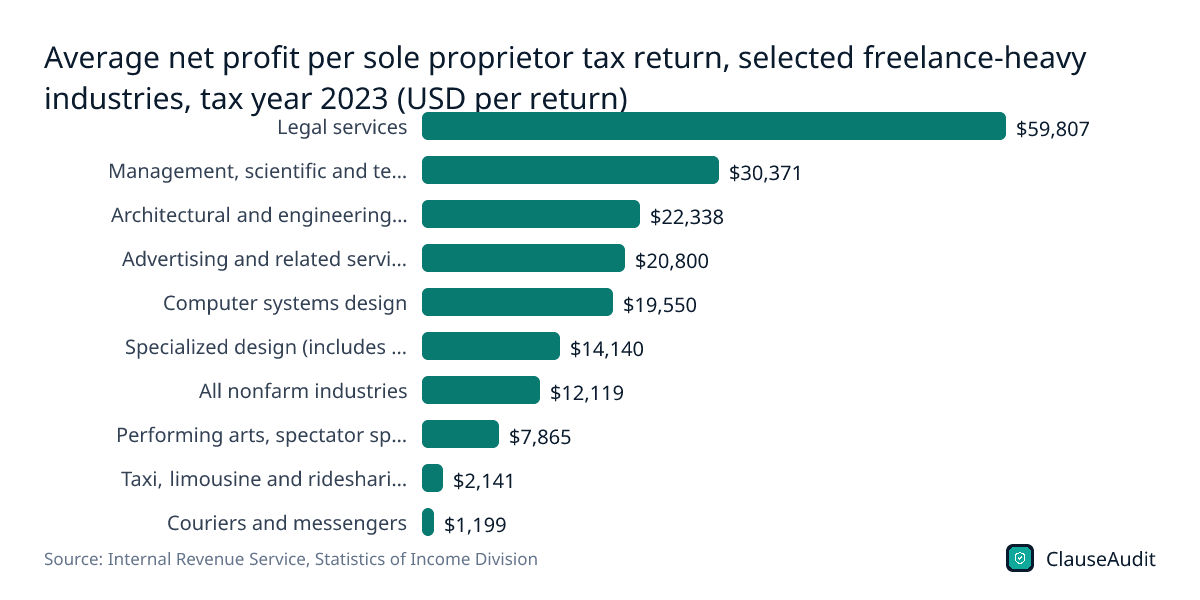
| Legal services | $59,807 |
| Management, scientific and technical consulting | $30,371 |
| Architectural and engineering services | $22,338 |
| Advertising and related services | $20,800 |
| Computer systems design | $19,550 |
| Specialized design (includes graphic design) | $14,140 |
| All nonfarm industries | $12,119 |
| Performing arts, spectator sports and related (includes independent artists and writers) | $7,865 |
| Taxi, limousine and ridesharing | $2,141 |
| Couriers and messengers | $1,199 |
Legal services sole proprietors averaged $59,807 in net profit per return, while couriers averaged $1,199. These averages include side businesses and loss years, so a full-time freelancer in any of these fields will usually sit well above the line.
Download this chart (PNG)Share of U.S. nonemployer businesses by annual receipts, 2024 (%)
Chart data
| Label | Value (%) |
|---|---|
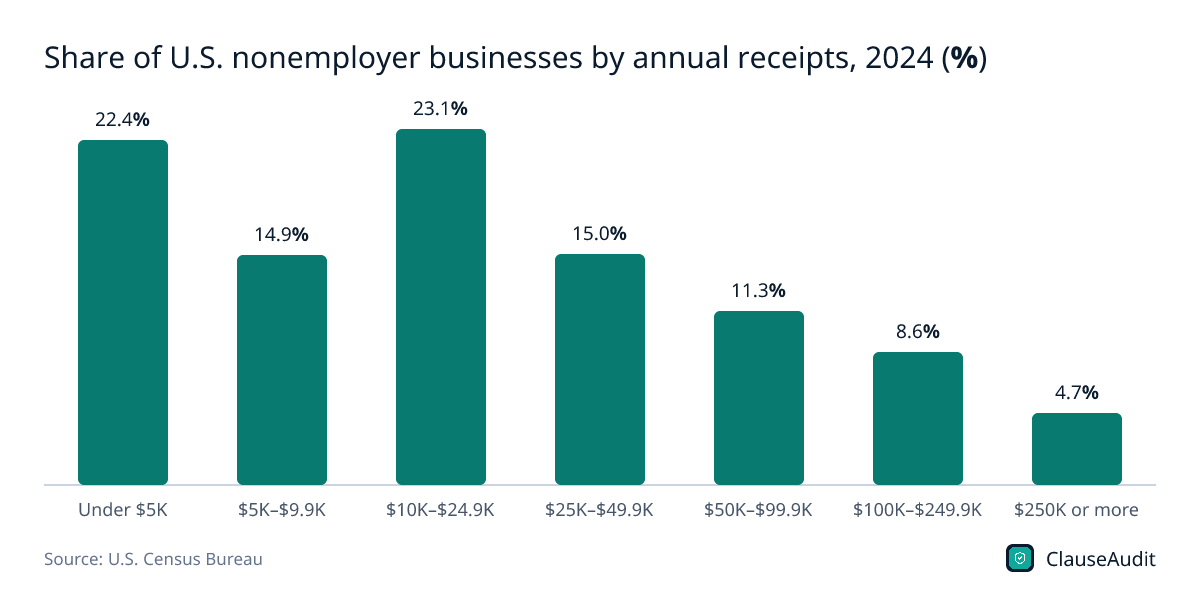
| Under $5K | 22.4% |
| $5K–$9.9K | 14.9% |
| $10K–$24.9K | 23.1% |
| $25K–$49.9K | 15.0% |
| $50K–$99.9K | 11.3% |
| $100K–$249.9K | 8.6% |
| $250K or more | 4.7% |
Most solo businesses are small: 60.4% took in under $25,000 in 2024. Only 4.7% grossed $250K or more, and receipts are revenue before expenses, not take-home pay.
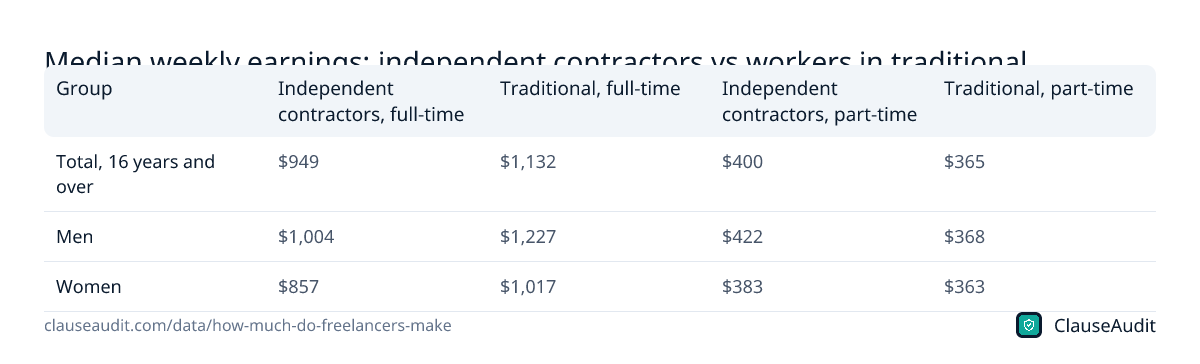
Download this chart (PNG)Median weekly earnings: independent contractors vs workers in traditional arrangements, July 2023
| Group | Independent contractors, full-time | Traditional, full-time | Independent contractors, part-time | Traditional, part-time |
|---|---|---|---|---|
| Total, 16 years and over | $949 | $1,132 | $400 | $365 |
| Men | $1,004 | $1,227 | $422 | $368 |
| Women | $857 | $1,017 | $383 | $363 |
Source: U.S. Bureau of Labor Statistics, Table 11. Median usual weekly earnings of full- and part-time workers by contingent status and alternative work arrangement, July 2023. Download as image
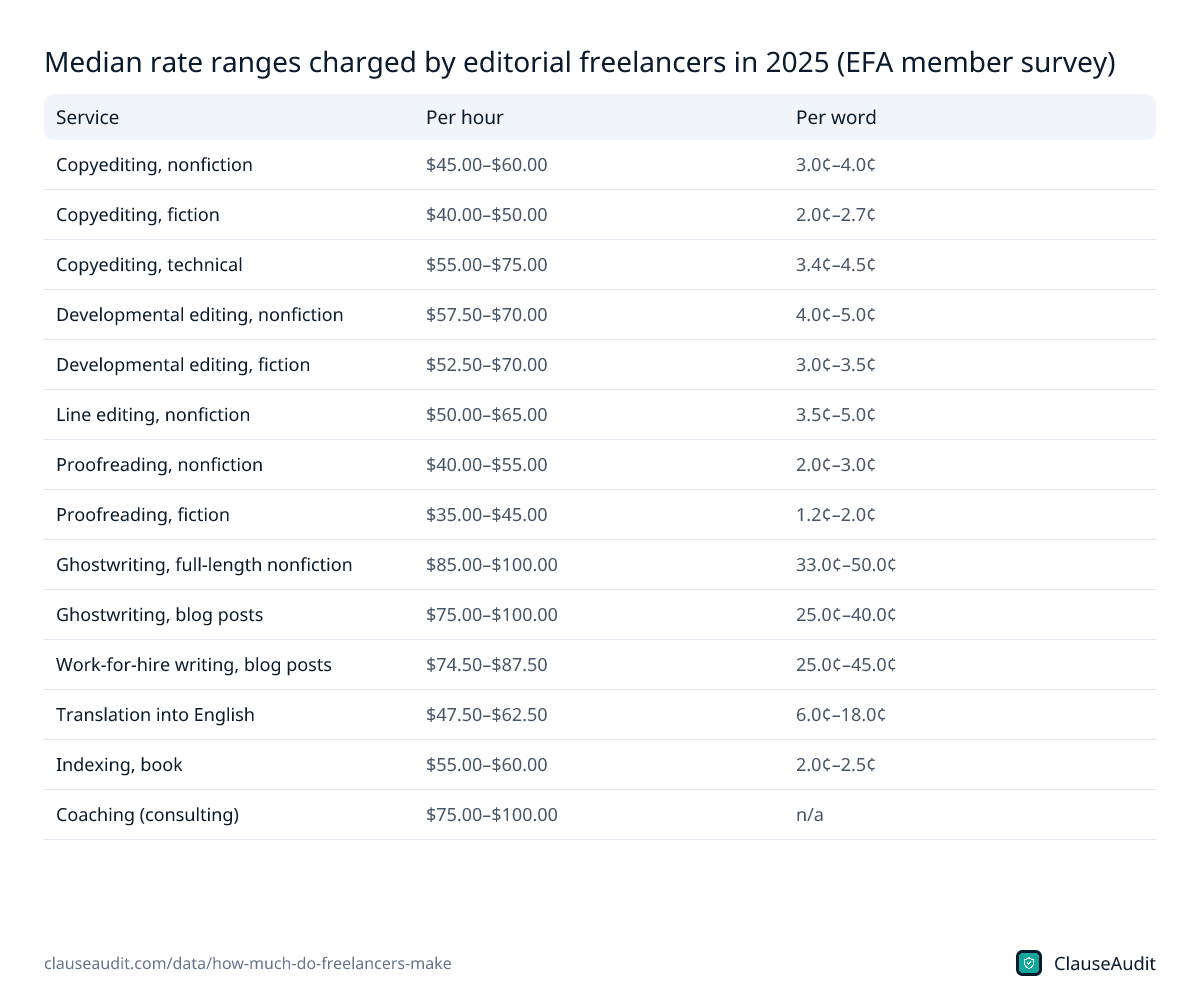
Median rate ranges charged by editorial freelancers in 2025 (EFA member survey)
| Service | Per hour | Per word |
|---|---|---|
| Copyediting, nonfiction | $45.00–$60.00 | 3.0¢–4.0¢ |
| Copyediting, fiction | $40.00–$50.00 | 2.0¢–2.7¢ |
| Copyediting, technical | $55.00–$75.00 | 3.4¢–4.5¢ |
| Developmental editing, nonfiction | $57.50–$70.00 | 4.0¢–5.0¢ |
| Developmental editing, fiction | $52.50–$70.00 | 3.0¢–3.5¢ |
| Line editing, nonfiction | $50.00–$65.00 | 3.5¢–5.0¢ |
| Proofreading, nonfiction | $40.00–$55.00 | 2.0¢–3.0¢ |
| Proofreading, fiction | $35.00–$45.00 | 1.2¢–2.0¢ |
| Ghostwriting, full-length nonfiction | $85.00–$100.00 | 33.0¢–50.0¢ |
| Ghostwriting, blog posts | $75.00–$100.00 | 25.0¢–40.0¢ |
| Work-for-hire writing, blog posts | $74.50–$87.50 | 25.0¢–45.0¢ |
| Translation into English | $47.50–$62.50 | 6.0¢–18.0¢ |
| Indexing, book | $55.00–$60.00 | 2.0¢–2.5¢ |
| Coaching (consulting) | $75.00–$100.00 | n/a |
Source: Editorial Freelancers Association, Editorial Rates (2026 Rate Chart). Download as image
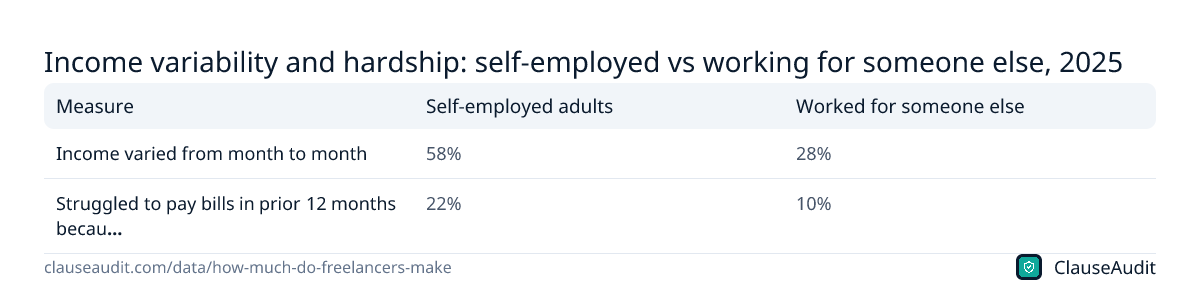
Income variability and hardship: self-employed vs working for someone else, 2025
| Measure | Self-employed adults | Worked for someone else |
|---|---|---|
| Income varied from month to month | 58% | 28% |
| Struggled to pay bills in prior 12 months because income varied | 22% | 10% |
Source: Board of Governors of the Federal Reserve System, Economic Well-Being of U.S. Households in 2025. Download as image
Do freelancers make more than employees?
Not on the median. Full-time independent contractors earned $949 a week in July 2023, while full-time workers in traditional jobs earned $1,132. Men who freelance full time earned $1,004 a week against $1,227 for men in regular jobs. For women the figures were $857 and $1,017.
Part-time work flips the picture. Part-time contractors earned $400 a week, a bit more than the $365 that part-time employees took home. So if you freelance a few days a week, you are not giving up pay compared with a part-time job, at least on these numbers.
The full-time gap is bigger than it looks. An employee's $1,132 comes with an employer paying half of Social Security and Medicare tax, often some health cover, paid holidays and a retirement match. Your $949 has to cover all of that yourself. So when you price your work, do not benchmark against a salary. Benchmark against what that salary costs an employer.
How much do freelancers make a year?
There is no single honest number, and the different data sources show why. IRS data for tax year 2023 counted 31.1 million nonfarm sole proprietor returns reporting $377.2 billion in net profit after losses. That works out to $12,119 per return. Only counting the returns that showed a profit, the average was $24,790.
Those figures look low because they include everyone: the graphic designer with a full client roster, the teacher who tutors on weekends and the person whose business lost money that year. Census counts tell the same story from the revenue side. Of all U.S. businesses with no employees, 60.4% grossed under $25,000 in 2024, and 22.4% grossed under $5K.
At the other end, an industry survey estimates 5.8 million independent professionals earned more than $100,000 in 2026. So the realistic answer is that freelance income depends far more on how you run the business than on the label. Full-time freelancers with steady clients and clear contracts sit near the top of these ranges. Side gigs pull the averages down.
Which freelance fields pay the most?
Skilled professional work pays best. Among sole proprietors, legal services averaged $59,807 in net profit per return and management, scientific and technical consulting averaged $30,371. Architecture and engineering came in at $22,338, advertising at $20,800 and computer systems design at $19,550.
Driving and delivery sit at the bottom. Taxi, limousine and ridesharing returns averaged $2,141, and couriers $1,199. Like every figure in this table, those averages include side gigs and returns that showed a loss.
Hourly rates tell you more than annual averages if you are setting prices. Editorial Freelancers Association members reported a median of $45 to $60 an hour for nonfiction copyediting in 2025, $55 to $75 for technical copyediting and $85 to $100 for ghostwriting a full-length nonfiction book. Specialized skills earn more per hour. On Upwork, freelancers doing AI work earned 34% more per hour than those who were not, according to 2026 platform data, although the same release noted per-contract earnings in generative AI and creative production fell 13% year over year even as contract starts grew 90%.
Why does freelance income swing so much?
Because you carry risk an employer normally absorbs. A Federal Reserve survey found 58% of self-employed adults said their income varied month to month in 2025, compared with 28% of people working for someone else. And 22% of the self-employed struggled to pay bills because of that variability, against 10% of employees.
Some of the swing is seasonal or comes from a client ending a project. A lot of it, though, is avoidable. Late invoices, work that sits in review for weeks, projects cancelled with nothing paid for the hours already spent: these are contract problems, and they show up as gaps in your bank balance.
What do these freelance income numbers leave out?
Every source here measures something slightly different, and it helps to know which is which before you compare yourself to any of them.
The federal weekly figures cover people whose main job is independent contracting and who work full time. That makes them the best guide for a career freelancer, but the latest published edition is from July 2023, and the survey runs irregularly, with a 12-year gap between 2005 and 2017. The IRS and Census numbers cover far more people, including anyone with a small side business, so they skew low. The six-figure estimate comes from an industry survey that counts a broader group of independents, so it does not line up neatly with the federal numbers.
None of them show your hourly rate after unpaid time. Say you bill a client for a full week but spend another day on proposals, invoicing and chasing payment. Your real rate just dropped, and no national survey will catch it. Track your billable and unbillable hours for a month. That one number will tell you more about your pricing than any average on this page.
They also miss money you earned but never received. A client who pays months late, or argues a project was never formally accepted, does not show up as lower income in a survey. It shows up as stress, a credit card balance and a gap in your cash flow.
How to earn more as a freelancer
- Price from your costs up. Add self-employment tax, health insurance, retirement savings, software and unbilled admin time to your target income before you divide by billable hours.
- Specialize. The rate tables above show that technical and niche work earns more per hour than general work in the same field.
- Take a deposit before you start. Upfront money protects you if a client disappears and shortens the time you are working on credit.
- Tie payment to delivery, not to approval. Payment that waits on a client's open-ended sign-off can leave an invoice unpaid for as long as the client wants to keep reviewing.
- Cap revisions and price extra rounds. Unlimited changes quietly turn a fixed fee into a falling hourly rate.
- Keep a cash buffer for the slow months, and invoice the day work is delivered rather than at month end.
How ClauseAudit helps
Your rate is only half of what you earn. The other half is whether the contract lets you collect it on time and in full. Upload a client agreement and the automated review flags the clauses that cut into your income.
Each risky clause comes with a plain-English explanation and a suggested change you can send back to the client.
- Payment terms, deposit requirements and how long the client has to pay each invoice
- Late fee or interest clauses, and whether there is any penalty for paying late at all
- Payment tied to vague client approval or acceptance instead of delivery
- Revision limits and how extra rounds or scope changes are billed
- Kill fees and what you are owed if the client cancels midway
- Liability and indemnity clauses that could cost you more than the project pays
Frequently asked questions
What is the average freelancer salary in the U.S.?
Freelancers do not have a salary, but the closest federal measure is weekly pay for full-time independent contractors, which was a median $949 in July 2023. Employees in traditional arrangements earned $1,132. Annual income varies hugely by field, hours and how many clients you have, so treat the median as a starting point, not a target.
How many freelancers make six figures?
An industry survey for MBO Partners estimates 5.8 million U.S. independent professionals earned more than $100,000 a year in 2026, up from 1.9 million in 2011. The survey uses a broad definition of independent work, so the count is an estimate rather than an official figure, but the upward trend is clear.
Do freelancers earn less than employees?
Full time, yes. Independent contractors earned a median $949 a week in July 2023, versus $1,132 for traditional employees. Part time, contractors did slightly better at $400 a week against $365. The full-time gap widens further once you account for the taxes and benefits an employer would normally cover.
Why is average self-employed income so low in IRS data?
The IRS average of $12,119 net profit per sole proprietor return for tax year 2023 counts every return, including weekend side businesses and businesses that lost money. Returns that showed a profit averaged $24,790. A full-time freelancer with steady clients will usually earn well above both figures.
How much do freelance editors and writers charge per hour?
Editorial Freelancers Association members reported median ranges of $45 to $60 an hour for nonfiction copyediting in 2025, $40 to $55 for nonfiction proofreading and $75 to $100 for ghostwriting blog posts. The EFA does not set rates. These ranges reflect what members said they actually charged clients.
Which freelance jobs pay the most?
In IRS data for tax year 2023, legal services sole proprietors averaged the highest net profit of the fields we compared, at $59,807 per return, followed by management, scientific and technical consulting at $30,371. Taxi and rideshare drivers ($2,141) and couriers ($1,199) averaged the least. These averages include side businesses and loss years.
Is freelance income stable?
Often not. In a 2025 Federal Reserve survey, 58% of self-employed adults said their income varied month to month, and 22% struggled to pay bills because of it. Deposits, clear payment deadlines and late fees in your contracts are some of the simplest ways to smooth out the gaps.
Does AI work pay more for freelancers?
On Upwork, freelancers doing AI work earned 34% more per hour than those who were not, according to 2026 platform data. The same release warned that per-contract earnings in generative AI and creative production fell 13%, which suggests simpler AI tasks may pay less as more people offer them.
Use this data
Every chart and card below is free to reuse under CC BY 4.0. Download what you need and link back to this page.
 Stat cards
 Key findings card
 Infographic
 Median weekly earnings of full-time workers by work arrangement, July 2023 (USD per week)
 Median weekly earnings of full-time independent contractors, 2005 to 2023 (USD per week)
 U.S. independents earning more than $100,000 a year, 2011 to 2026 (millions of people)
 Average net profit per sole proprietor tax return, selected freelance-heavy industries, tax year 2023 (USD per return)
 Share of U.S. nonemployer businesses by annual receipts, 2024 (%)
 Median weekly earnings: independent contractors vs workers in traditional arrangements, July 2023
 Median rate ranges charged by editorial freelancers in 2025 (EFA member survey)
 Income variability and hardship: self-employed vs working for someone else, 2025
Embed the infographic
Free to share on your site, blog or slides under CC BY 4.0. Please keep the credit link.
Sources and method
Every number on this page comes from the sources below, each opened and read on or before October 18, 2026. A second, independent review checked every figure against its source and corrected anything that did not match. Figures that could not be confirmed were left out.
- U.S. Bureau of Labor Statistics, Contingent and Alternative Employment Arrangements, July 2023 (news release) (November 8, 2024 (July 2023 data; latest published edition))
- U.S. Bureau of Labor Statistics, Table 11. Median usual weekly earnings of full- and part-time workers by contingent status and alternative work arrangement, July 2023 (November 8, 2024 (July 2023 data))
- U.S. Bureau of Labor Statistics, Contingent and Alternative Employment Arrangements, May 2017 (news release) (June 7, 2018 (May 2017 data))
- U.S. Bureau of Labor Statistics, Contingent and Alternative Employment Arrangements, February 2005 (news release) (July 27, 2005 (February 2005 data))
- MBO Partners, Independent Workforce Reaches 74.9 Million (2026 State of Independence press release) (September 28, 2026 (survey fielded April 2026))
- MBO Partners, 2025 State of Independence in America Report (2025 edition (survey fielded April 2025))
- MBO Partners, 2024 State of Independence in America Report (2024 edition (survey fielded June 2024))
- Internal Revenue Service, Statistics of Income Division, SOI Tax Stats, Table 1. Nonfarm Sole Proprietorships: Business Receipts, Selected Deductions, Payroll, and Net Income, by Industrial Sectors, Tax Year 2023 (March 2026 (Tax Year 2023; latest available))
- U.S. Census Bureau, Nonemployer Statistics 2024, United States file (nonemp24us) (2024 data; file posted September 29, 2026)
- U.S. Census Bureau, Nonemployer Record Layout for United States File (receipts size class codes) (Record layout used for 2017 onward files)
- Board of Governors of the Federal Reserve System, Economic Well-Being of U.S. Households in 2025 (May 2026 (survey fielded October 2025))
- Editorial Freelancers Association, Editorial Rates (2026 Rate Chart) (Updated March 29, 2026 (member survey Nov 2025 to mid-Jan 2026, 2025 rates))
- Upwork Inc., Upwork's Future Workforce Index 2026 (press release, GlobeNewswire, as reposted by Finviz) (July 14, 2026)
Cite this page
ClauseAudit, “How Much Do Freelancers Make? Freelance Earnings Statistics 2026”, updated October 18, 2026, https://clauseaudit.com/data/how-much-do-freelancers-make. Free to reuse with a link back (CC BY 4.0).
This page summarises published data and law as checked on October 18, 2026. Figures are updated as new editions are released, and your own situation may differ. It is general information, not legal, tax or financial advice.