Self-Employed Workers by State: Nonemployer Business Counts and Receipts
By ClauseAudit Research · 14 sources ·
What are the self-employment numbers by state?
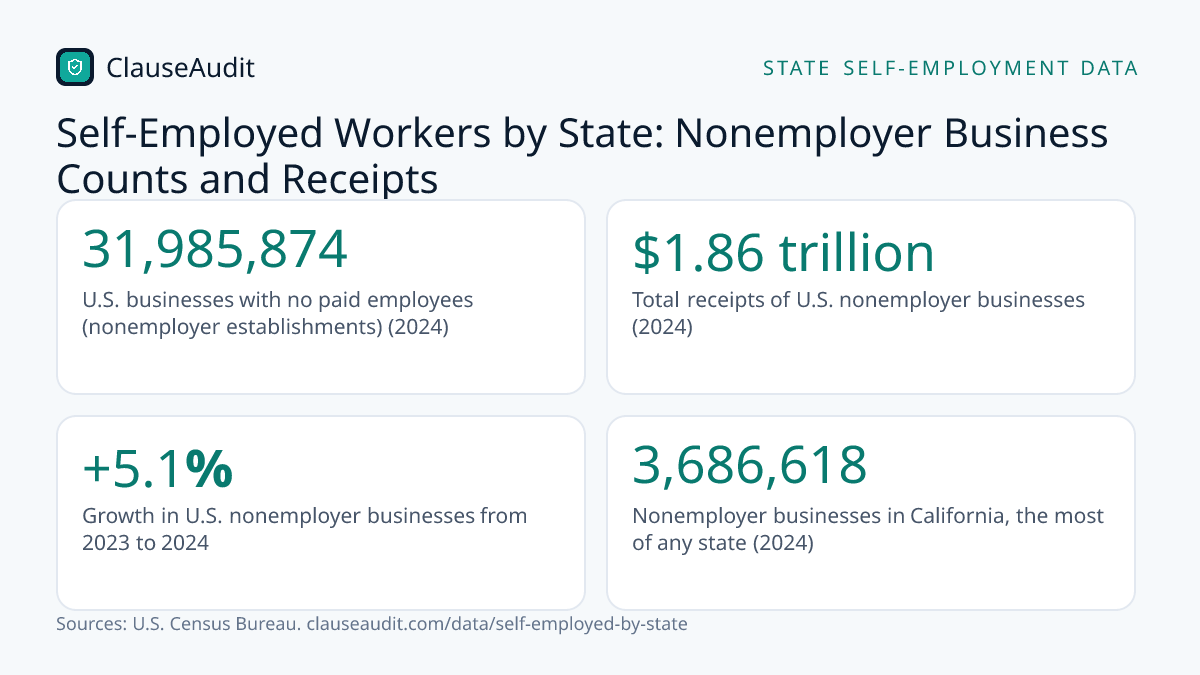
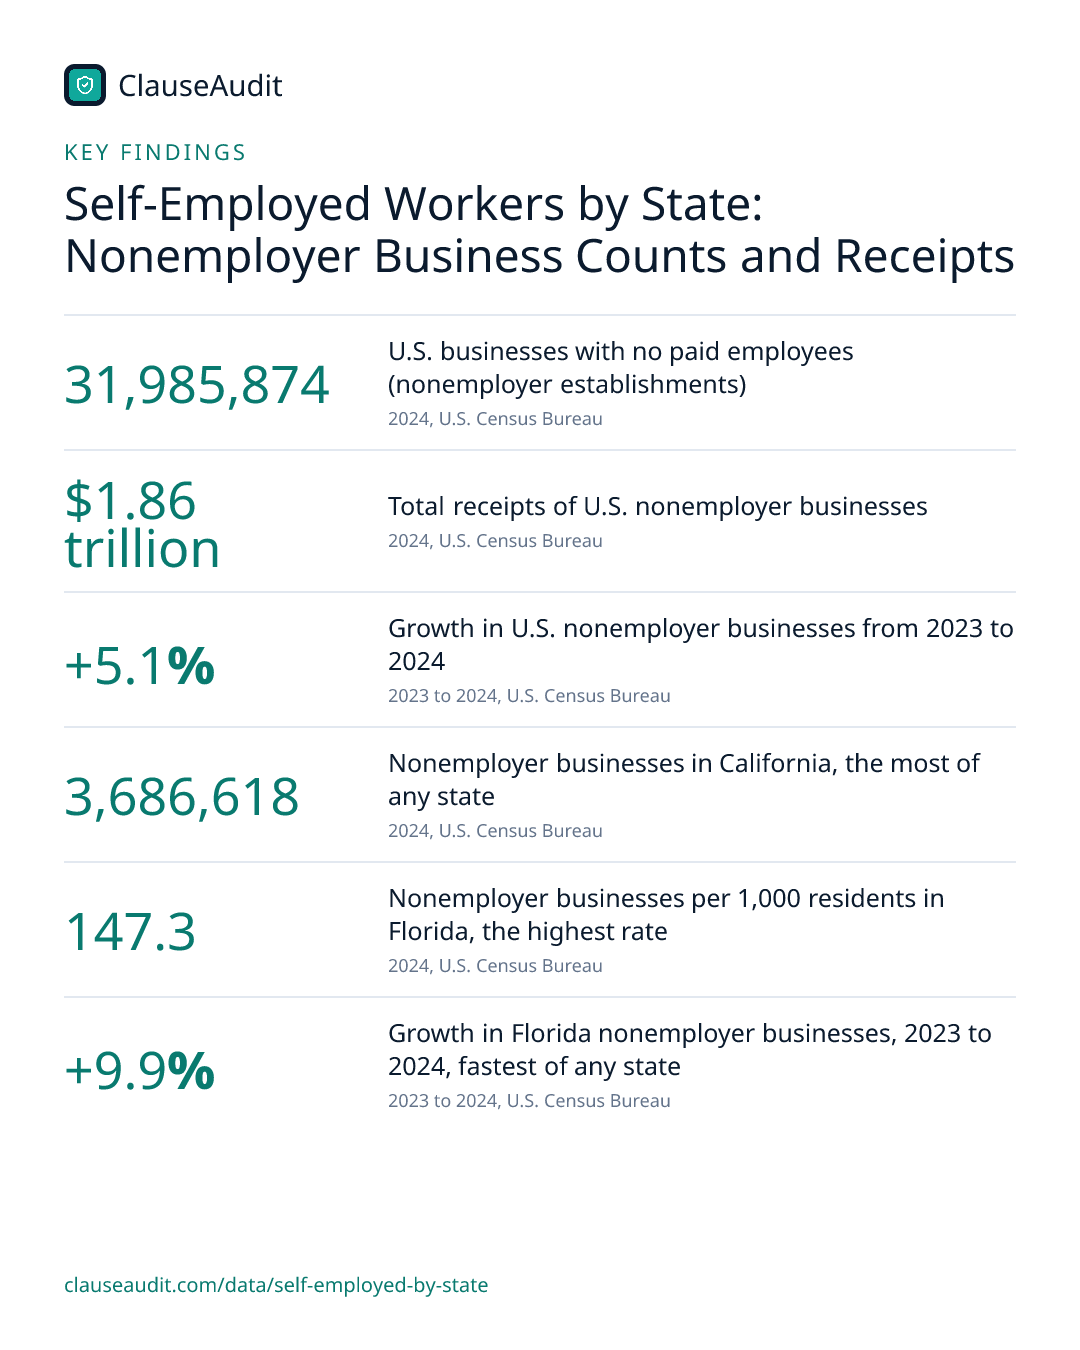
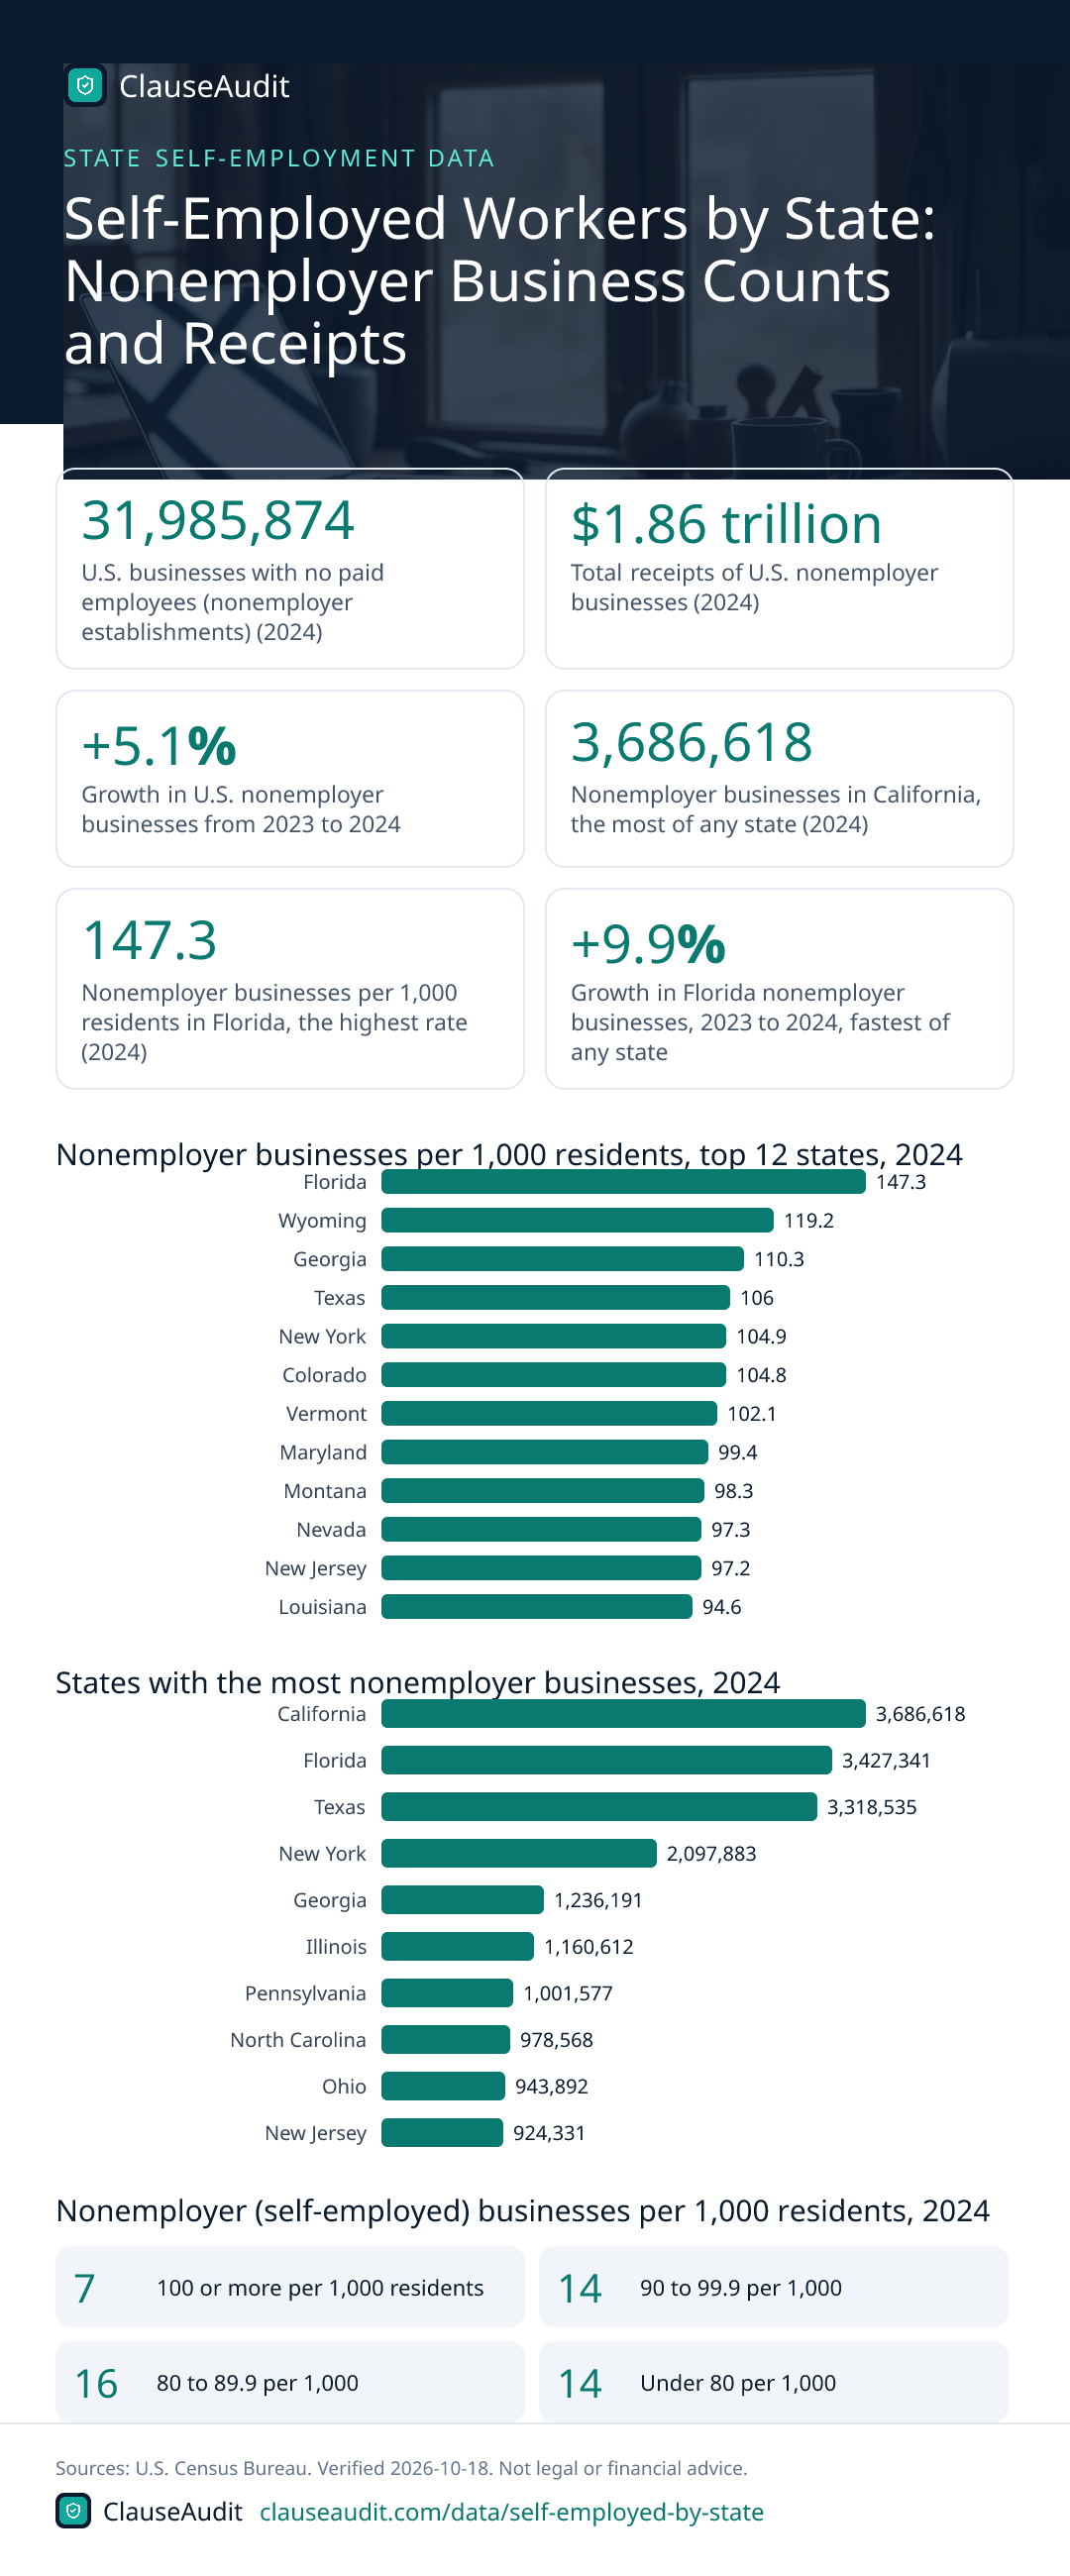
Self-employment grew in every state from 2023 to 2024. The U.S. had 31,985,874 nonemployer businesses in 2024, up 5.1% from 2023. California has the most at 3,686,618, while Florida leads per person with 147.3 per 1,000 residents and grew fastest, at 9.9%.

- U.S. businesses with no paid employees (nonemployer establishments) (2024, U.S. Census Bureau)
- 31,985,874
- Total receipts of U.S. nonemployer businesses (2024, U.S. Census Bureau)
- $1.86 trillion
- Growth in U.S. nonemployer businesses from 2023 to 2024 (2023 to 2024, U.S. Census Bureau)
- +5.1%
- Nonemployer businesses in California, the most of any state (2024, U.S. Census Bureau)
- 3,686,618
- Nonemployer businesses per 1,000 residents in Florida, the highest rate (2024, U.S. Census Bureau)
- 147.3
- Growth in Florida nonemployer businesses, 2023 to 2024, fastest of any state (2023 to 2024, U.S. Census Bureau)
- +9.9%
- Share of U.S. nonemployer businesses that are sole proprietorships (2024, U.S. Census Bureau)
- 86.4%
- Share of U.S. nonemployers with receipts under $25,000 a year (2024, U.S. Census Bureau)
- 60.4%
The Census Bureau counts every business that files taxes, has no paid employees and brings in at least a little revenue. That count is one of the most detailed state-by-state pictures of self-employment you can get: freelancers, consultants, drivers, cleaners, landlords and one-person shops of every kind.
In 2024 there were 31,985,874 of them, with $1.86 trillion in receipts. Below you will find what the state numbers actually tell you, where they mislead, and what to do with them if you work for yourself or hire people who do.
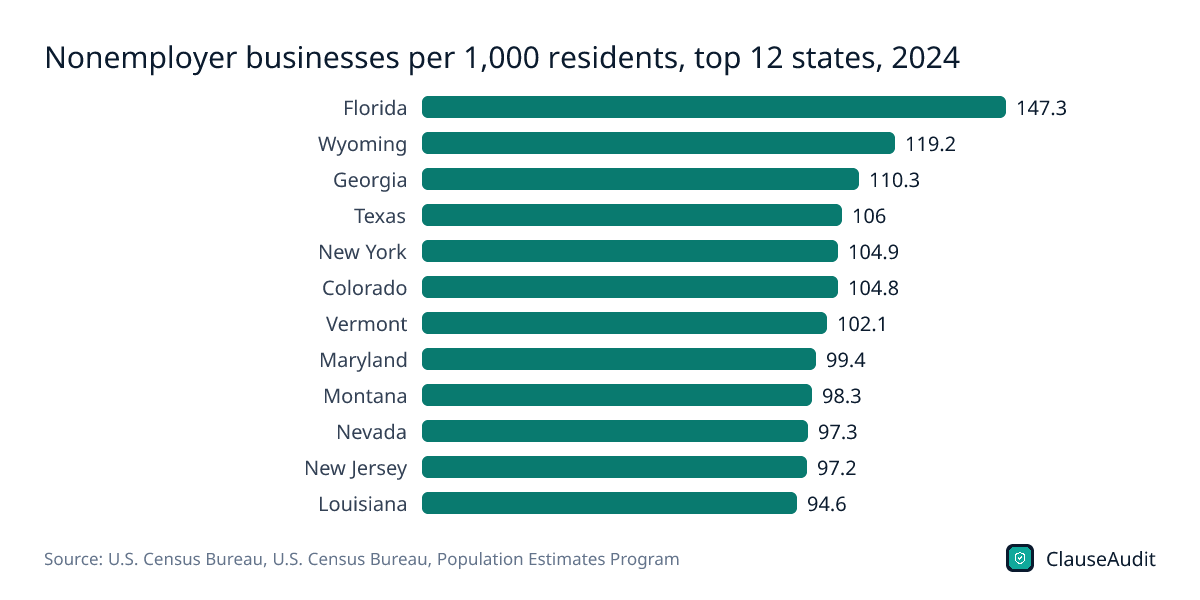
Nonemployer businesses per 1,000 residents, top 12 states, 2024
Chart data
| Label | Value |
|---|---|
| Florida | 147.3 |
| Wyoming | 119.2 |
| Georgia | 110.3 |
| Texas | 106 |
| New York | 104.9 |
| Colorado | 104.8 |
| Vermont | 102.1 |
| Maryland | 99.4 |
| Montana | 98.3 |
| Nevada | 97.3 |
| New Jersey | 97.2 |
| Louisiana | 94.6 |
Florida is in a league of its own at 147.3 per 1,000 residents, against a U.S. average of 94.1. Wyoming ranks second, likely helped by holding companies and other entities registered there, not just people working for themselves.
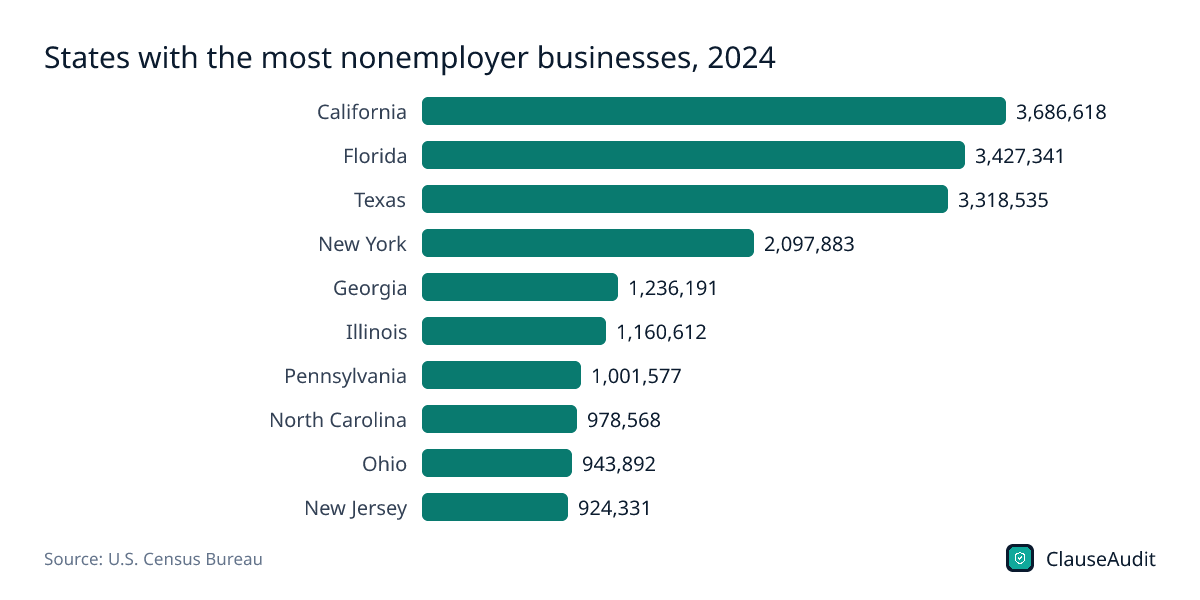
Download this chart (PNG)States with the most nonemployer businesses, 2024
Chart data
| Label | Value |
|---|---|
| California | 3,686,618 |
| Florida | 3,427,341 |
| Texas | 3,318,535 |
| New York | 2,097,883 |
| Georgia | 1,236,191 |
| Illinois | 1,160,612 |
| Pennsylvania | 1,001,577 |
| North Carolina | 978,568 |
| Ohio | 943,892 |
| New Jersey | 924,331 |
The biggest states lead on raw counts, as you would expect. California, Florida and Texas together hold more nonemployer businesses than the next seven states on this chart combined.
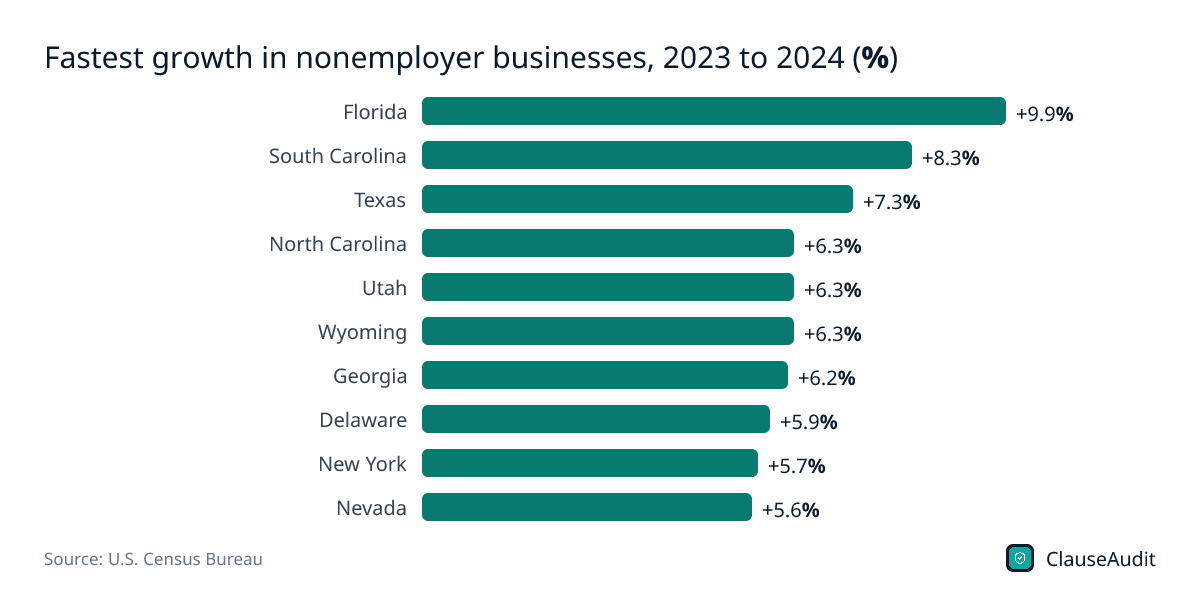
Download this chart (PNG)Fastest growth in nonemployer businesses, 2023 to 2024 (%)
Chart data
| Label | Value |
|---|---|
| Florida | +9.9% |
| South Carolina | +8.3% |
| Texas | +7.3% |
| North Carolina | +6.3% |
| Utah | +6.3% |
| Wyoming | +6.3% |
| Georgia | +6.2% |
| Delaware | +5.9% |
| New York | +5.7% |
| Nevada | +5.6% |
Southern and Mountain states dominate the growth list. Florida at 9.9% and South Carolina at 8.3% grew far faster than the U.S. rate of 5.1%.
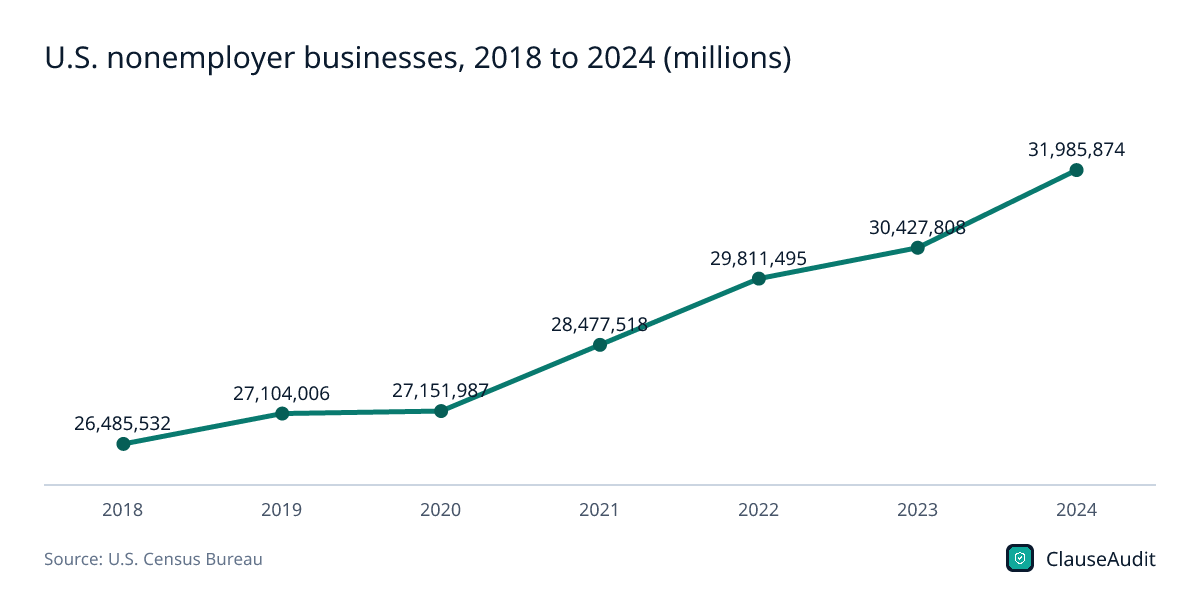
Download this chart (PNG)U.S. nonemployer businesses, 2018 to 2024 (millions)
Chart data
| Label | Value (millions) |
|---|---|
| 2018 | 26,485,532 |
| 2019 | 27,104,006 |
| 2020 | 27,151,987 |
| 2021 | 28,477,518 |
| 2022 | 29,811,495 |
| 2023 | 30,427,808 |
| 2024 | 31,985,874 |
The count has climbed every year since 2018, including through 2020. Self-employment kept growing when payroll jobs did not.
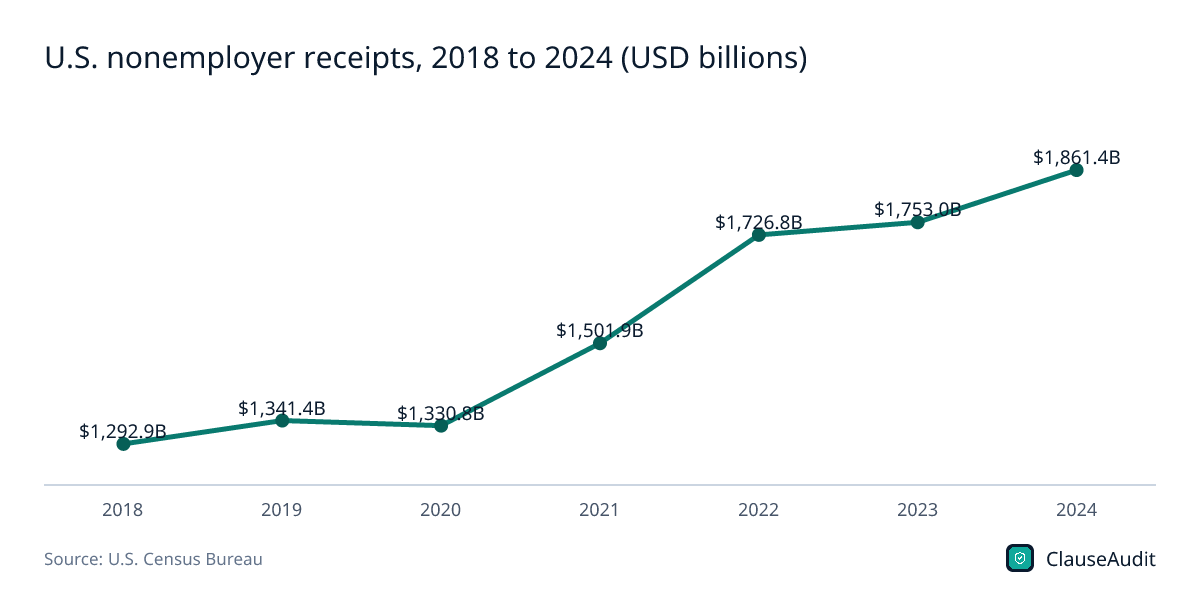
Download this chart (PNG)U.S. nonemployer receipts, 2018 to 2024 (USD billions)
Chart data
| Label | Value (USD billions) |
|---|---|
| 2018 | $1,292.9B |
| 2019 | $1,341.4B |
| 2020 | $1,330.8B |
| 2021 | $1,501.9B |
| 2022 | $1,726.8B |
| 2023 | $1,753.0B |
| 2024 | $1,861.4B |
Receipts dipped slightly in 2020, then jumped. These are current dollars, so part of the recent rise is inflation rather than more work.
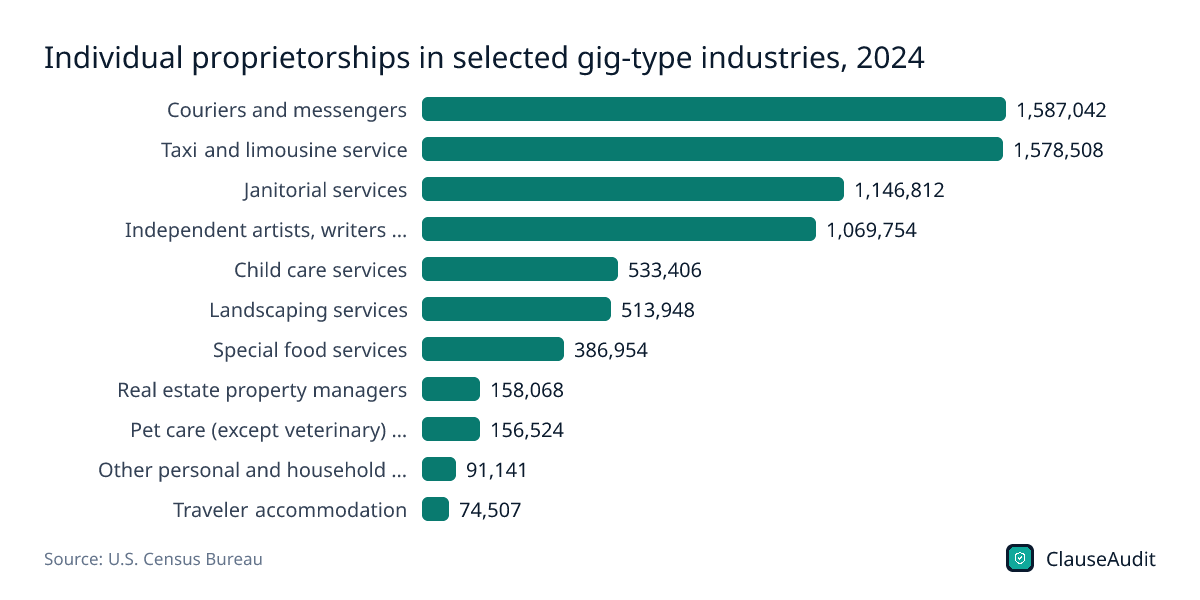
Download this chart (PNG)Individual proprietorships in selected gig-type industries, 2024
Chart data
| Label | Value |
|---|---|
| Couriers and messengers | 1,587,042 |
| Taxi and limousine service | 1,578,508 |
| Janitorial services | 1,146,812 |
| Independent artists, writers and performers | 1,069,754 |
| Child care services | 533,406 |
| Landscaping services | 513,948 |
| Special food services | 386,954 |
| Real estate property managers | 158,068 |
| Pet care (except veterinary) services | 156,524 |
| Other personal and household goods repair | 91,141 |
| Traveler accommodation | 74,507 |
Couriers and taxi or ride drivers are the two largest groups, with about 1.6 million sole proprietors each. Census picked these industries because some of the income is likely gig work, but it cannot say how much.
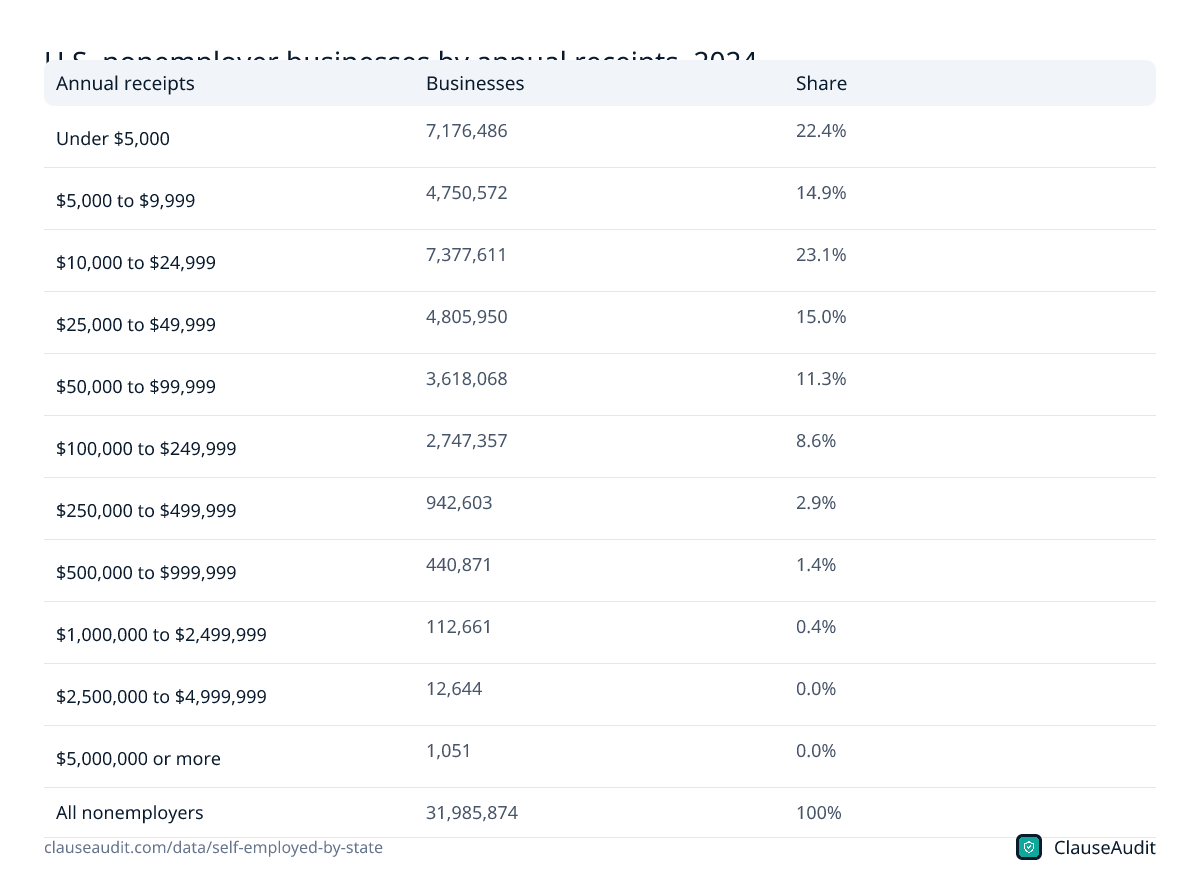
Download this chart (PNG)U.S. nonemployer businesses by annual receipts, 2024
| Annual receipts | Businesses | Share |
|---|---|---|
| Under $5,000 | 7,176,486 | 22.4% |
| $5,000 to $9,999 | 4,750,572 | 14.9% |
| $10,000 to $24,999 | 7,377,611 | 23.1% |
| $25,000 to $49,999 | 4,805,950 | 15.0% |
| $50,000 to $99,999 | 3,618,068 | 11.3% |
| $100,000 to $249,999 | 2,747,357 | 8.6% |
| $250,000 to $499,999 | 942,603 | 2.9% |
| $500,000 to $999,999 | 440,871 | 1.4% |
| $1,000,000 to $2,499,999 | 112,661 | 0.4% |
| $2,500,000 to $4,999,999 | 12,644 | 0.0% |
| $5,000,000 or more | 1,051 | 0.0% |
| All nonemployers | 31,985,874 | 100% |
Source: U.S. Census Bureau, 2024 Nonemployer Statistics, U.S.-level data file by legal form and receipts size (nonemp24us). Download as image
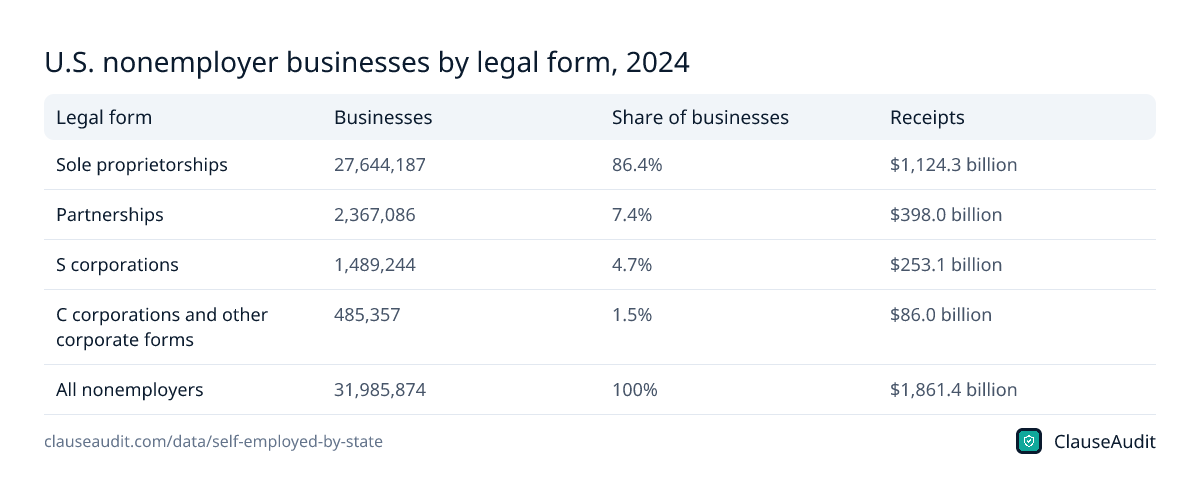
U.S. nonemployer businesses by legal form, 2024
| Legal form | Businesses | Share of businesses | Receipts |
|---|---|---|---|
| Sole proprietorships | 27,644,187 | 86.4% | $1,124.3 billion |
| Partnerships | 2,367,086 | 7.4% | $398.0 billion |
| S corporations | 1,489,244 | 4.7% | $253.1 billion |
| C corporations and other corporate forms | 485,357 | 1.5% | $86.0 billion |
| All nonemployers | 31,985,874 | 100% | $1,861.4 billion |
Source: U.S. Census Bureau, 2024 Nonemployer Statistics, U.S.-level data file by legal form and receipts size (nonemp24us). Download as image
Nonemployer (self-employed) businesses per 1,000 residents, 2024 by state
- 7100 or more per 1,000 residents
- 1490 to 99.9 per 1,000
- 1680 to 89.9 per 1,000
- 14Under 80 per 1,000
- 100 or more per 1,000 residents7
- 90 to 99.9 per 1,00014
- 80 to 89.9 per 1,00016
- Under 80 per 1,00014
How many people are self-employed in each state?
The honest answer is that nobody counts people directly at this level. What Census counts is nonemployer businesses: anything that files a business tax return, has no paid employees and reports receipts of $1,000 or more ($1 or more in construction). Most of those are a single person working for themselves, but one person can own more than one.
Still, it is a strong proxy. 86.4% of nonemployers are sole proprietorships, which in practice means someone filing a Schedule C on their personal return. The rest are partnerships, S corporations and other corporate forms.
By raw count, California leads with 3,686,618, followed by Florida with 3,427,341 and Texas with 3,318,535. Those three states alone hold close to a third of the national total. If you sell to self-employed people, or compete with them, that is where most of them are.
One more caveat: the data comes from tax filings, so it misses people working off the books and counts some people who barely work at all. Someone who sold just over $1,000 of crafts and filed a Schedule C can show up next to a full-time consultant.
Which states have the most self-employed workers per person?
Raw counts mostly track population, so the more useful comparison is per 1,000 residents. Florida comes out on top at 147.3, far above the U.S. rate of 94.1. West Virginia sits at the bottom with 55.1.
Read the top of the list with care. Wyoming ranks second at 119.2, but only 64.3% of its nonemployers are sole proprietorships and its average receipts are $86,214, well above most states. Delaware looks similar, with a 69.3% sole proprietorship share and $97,015 in average receipts. Both states are popular places to register entities, so some of those businesses are likely holding companies or investment vehicles, not a person working from home.
For a more realistic read on where independent workers cluster, look at states with a high per-person rate and a high sole proprietorship share. Georgia at 110.3 and Texas at 106.0 fit that pattern.
Per-person rates also tell you something about local demand. In a state with a high rate, more clients are likely used to hiring independents and may already have a standard contractor agreement ready. That is convenient, but it usually means their paper, their payment terms and their choice of court. Ask for changes anyway. A client who hires contractors often has seen redlines before and will not be put off by a reasonable one.
How much do self-employed businesses really earn?
Less than the averages suggest. Receipts are gross revenue before expenses, not profit, and the distribution is lopsided. 60.4% of nonemployers took in under $25,000 in 2024. That is 19,304,669 businesses, and many are likely side income on top of a regular job.
State averages get pulled up by a small group of larger operations. California's average is $64,932 per business, but the typical one-person business there almost certainly brings in far less. Only 8.6% of nonemployers nationally fell in the $100,000 to $249,999 band.
If you are setting your rate, do not benchmark against a state average. Work out what you need to net after self-employment tax, health insurance, software and unpaid admin time, then price from there.
The low numbers also explain why payment terms matter so much. When a business brings in a few thousand dollars a month, a client who pays two months late is not a small annoyance. It is the difference between covering rent and not.
Where is self-employment growing fastest?
Every state, plus D.C., added nonemployer businesses from 2023 to 2024. Florida grew fastest at 9.9%, followed by South Carolina at 8.3% and Texas at 7.3%. The national rate was 5.1%.
Fast growth cuts both ways. More independents in your market means more competition for the same clients and more pressure on rates. It also means more businesses that are used to hiring contractors, and more referrals moving between freelancers.
For companies, a growing local pool of independents makes it easier to staff projects without adding payroll. It also raises the stakes on classification. If you treat contractors like employees, the state can reclassify them, and the bill for back taxes and penalties lands on you.
The national trend backs this up. The count has risen every year since 2018, and receipts reached $1.86 trillion in 2024. This is not a pandemic blip that faded. Working for yourself is now a normal part of the economy in every state.
What these numbers mean if you work for yourself
More than 27 million sole proprietors are running a business with no safety net from an employer. No HR department chases a late invoice for you, and no payroll system guarantees you get paid. Your contract is the only thing that does that job.
The specifics vary by state, but the basics do not. Start with these:
- Set your payment terms in writing, with a due date and a late fee. Small invoices are the ones clients forget.
- Ask for a deposit before you start. Most nonemployers take in under $25,000 a year, so one unpaid project can wipe out a month.
- Cap your liability at the fee you are paid. A sole proprietor's personal savings are on the line.
- Keep ownership of your work until the invoice clears, and carve out your own templates and tools.
- Check which state's law governs the contract. A client in a different state may pick its home court.
Gig work hides inside these counts
Census flags a set of industries where some income is likely gig work. In 2024 there were 1,587,042 sole proprietors in couriers and messengers and 1,578,508 in taxi and limousine service, the two largest on that list. Census cannot say how much of that is app-based.
If you drive, deliver or clean through an app, the IRS usually treats you as self-employed, even though the platform sets your pay. Read the platform terms the same way you would read a client contract: deactivation rules, how disputes are handled and if you have given up the right to sue.
Many of these workers never see a contract they can negotiate, only terms they click through. If a business hires you directly for delivery, cleaning or child care, ask for something in writing that covers your rate, when you get paid and how either side can end the arrangement.
How ClauseAudit helps
Being one of millions of independent businesses means you rarely get to negotiate from a position of power. You can still catch the terms that cost you money before you sign.
Upload a client agreement or statement of work and the automated review flags risky clauses in plain English, with suggested wording you can send back.
- Payment terms, due dates and whether payment depends on vague client approval
- Late fees and interest on overdue invoices
- Kill fees or partial payment if the client cancels mid-project
- Who owns the work and when ownership transfers
- Liability caps and indemnity promises that exceed your fee
- Non-solicitation terms that could block future clients
Frequently asked questions
Which state has the most self-employed people?
California has the most nonemployer businesses, with 3,686,618 in 2024. Florida is second with 3,427,341 and Texas third with 3,318,535. Adjusted for population, Florida leads at 147.3 nonemployer businesses per 1,000 residents, well above the U.S. rate of 94.1. California's rate is 93.7, just under the national figure.
How many self-employed businesses are there in the U.S.?
Census counted 31,985,874 nonemployer businesses in 2024, up 5.1% from 2023. These are businesses with no paid employees that file business taxes and report at least $1,000 in receipts. Together they brought in $1.86 trillion in receipts, though that is gross revenue before any expenses are taken out.
What is a nonemployer business?
It is a business with no paid employees that is subject to federal income tax and has receipts of $1,000 or more, or $1 or more in construction. Census builds the count from IRS records. Most are self-employed individuals, but one person can own more than one business.
Which state has the fewest self-employed people per person?
West Virginia has the lowest rate, at 55.1 nonemployer businesses per 1,000 residents in 2024. It also has the lowest average receipts per business, at $45,503. The U.S. rate is 94.1 per 1,000, so West Virginia sits well below the national pattern on both counts.
How much does the average self-employed business make?
Most make very little. 60.4% of nonemployers had receipts under $25,000 in 2024. State averages run higher, such as $64,932 in California, because a small number of larger businesses pull the average up. Receipts are also gross revenue, not profit, so take-home pay is lower still.
Why does Wyoming rank so high for self-employment?
Wyoming has 119.2 nonemployer businesses per 1,000 residents, second only to Florida. But just 64.3% are sole proprietorships and average receipts are $86,214. That pattern points to many registered entities, such as holding companies, rather than only individuals working for themselves.
Where is self-employment growing fastest?
Florida grew fastest from 2023 to 2024, adding 9.9% more nonemployer businesses. South Carolina followed at 8.3% and Texas at 7.3%. Every state grew over that period, and the national increase was 5.1%. Fast growth brings more clients used to hiring contractors, but also more competition on price.
Are most self-employed people sole proprietors?
Yes. 86.4% of U.S. nonemployer businesses were sole proprietorships in 2024. That matters because a sole proprietor has no legal wall between business and personal assets, so an uncapped liability clause in a client contract can reach your savings and home.
Use this data
Every chart and card below is free to reuse under CC BY 4.0. Download what you need and link back to this page.
 Stat cards
 Key findings card
 Infographic
 Nonemployer businesses per 1,000 residents, top 12 states, 2024
 States with the most nonemployer businesses, 2024
 Fastest growth in nonemployer businesses, 2023 to 2024 (%)
 U.S. nonemployer businesses, 2018 to 2024 (millions)
 U.S. nonemployer receipts, 2018 to 2024 (USD billions)
 Individual proprietorships in selected gig-type industries, 2024
 U.S. nonemployer businesses by annual receipts, 2024
 U.S. nonemployer businesses by legal form, 2024
Embed the infographic
Free to share on your site, blog or slides under CC BY 4.0. Please keep the credit link.
Sources and method
Every number on this page comes from the sources below, each opened and read on or before October 18, 2026. A second, independent review checked every figure against its source and corrected anything that did not match. 51 of 51 state entries were confirmed; any that could not be are marked "Not yet confirmed" and left out of every count and chart.
- U.S. Census Bureau, 2024 Nonemployer Statistics, state-level data file (nonemp24st) (2024 NES (data released September 29, 2026))
- U.S. Census Bureau, 2024 Nonemployer Statistics, U.S.-level data file by legal form and receipts size (nonemp24us) (2024 NES (data released September 29, 2026))
- U.S. Census Bureau, 2023 Nonemployer Statistics, state-level data file (nonemp23st) (2023 NES)
- U.S. Census Bureau, 2023 Nonemployer Statistics, U.S.-level data file (nonemp23us) (2023 NES)
- U.S. Census Bureau, 2022 Nonemployer Statistics, U.S.-level data file (nonemp22us) (2022 NES)
- U.S. Census Bureau, 2021 Nonemployer Statistics, U.S.-level data file (nonemp21us) (2021 NES)
- U.S. Census Bureau, 2020 Nonemployer Statistics, U.S.-level data file (nonemp20us) (2020 NES)
- U.S. Census Bureau, 2019 Nonemployer Statistics, U.S.-level data file (nonemp19us) (2019 NES)
- U.S. Census Bureau, 2018 Nonemployer Statistics, U.S.-level data file (nonemp18us) (2018 NES)
- U.S. Census Bureau, Population Estimates Program, Annual Estimates of the Resident Population for the United States and States (NST-EST2025-ALLDATA) (Vintage 2025 (July 1, 2024 estimate used))
- U.S. Census Bureau, 2024 Nonemployer Statistics (NES) data now available (September 29, 2026)
- U.S. Census Bureau, About the Nonemployer Statistics (NES) program (Accessed October 2026)
- U.S. Census Bureau, The Gig Picture: 2024 Nonemployer Statistics Provide Insight Into the Gig Economy (September 29, 2026)
- U.S. Census Bureau (America Counts), Number of U.S. Nonemployers Grew Faster Than Employer Businesses Nearly Every Year From 2012 to 2023 (July 30, 2025)
Cite this page
ClauseAudit, “Self-Employed Workers by State: Nonemployer Business Counts and Receipts”, updated October 18, 2026, https://clauseaudit.com/data/self-employed-by-state. Free to reuse with a link back (CC BY 4.0).
This page summarises published data and law as checked on October 18, 2026. Figures are updated as new editions are released, and your own situation may differ. It is general information, not legal, tax or financial advice.