SaaS Statistics 2026: 150+ Numbers on Spend, Pricing, Security and Contracts
By ClauseAudit Research · 153 statistics · 96 sources ·
What are the key SaaS statistics for 2026?
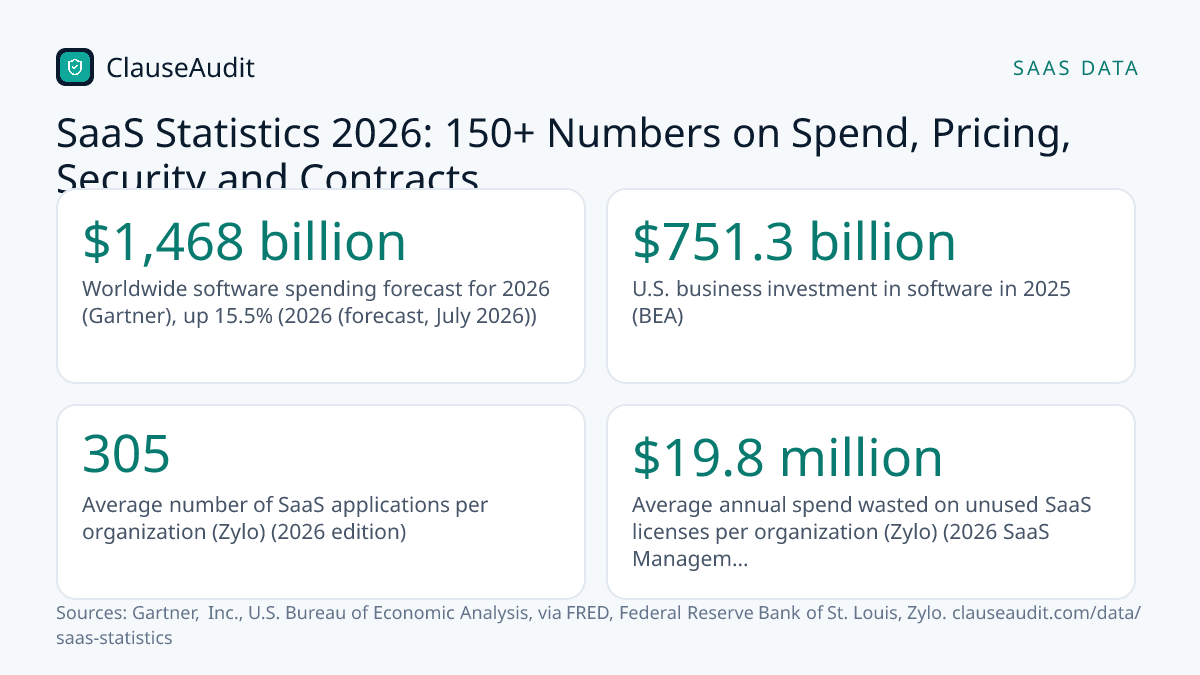
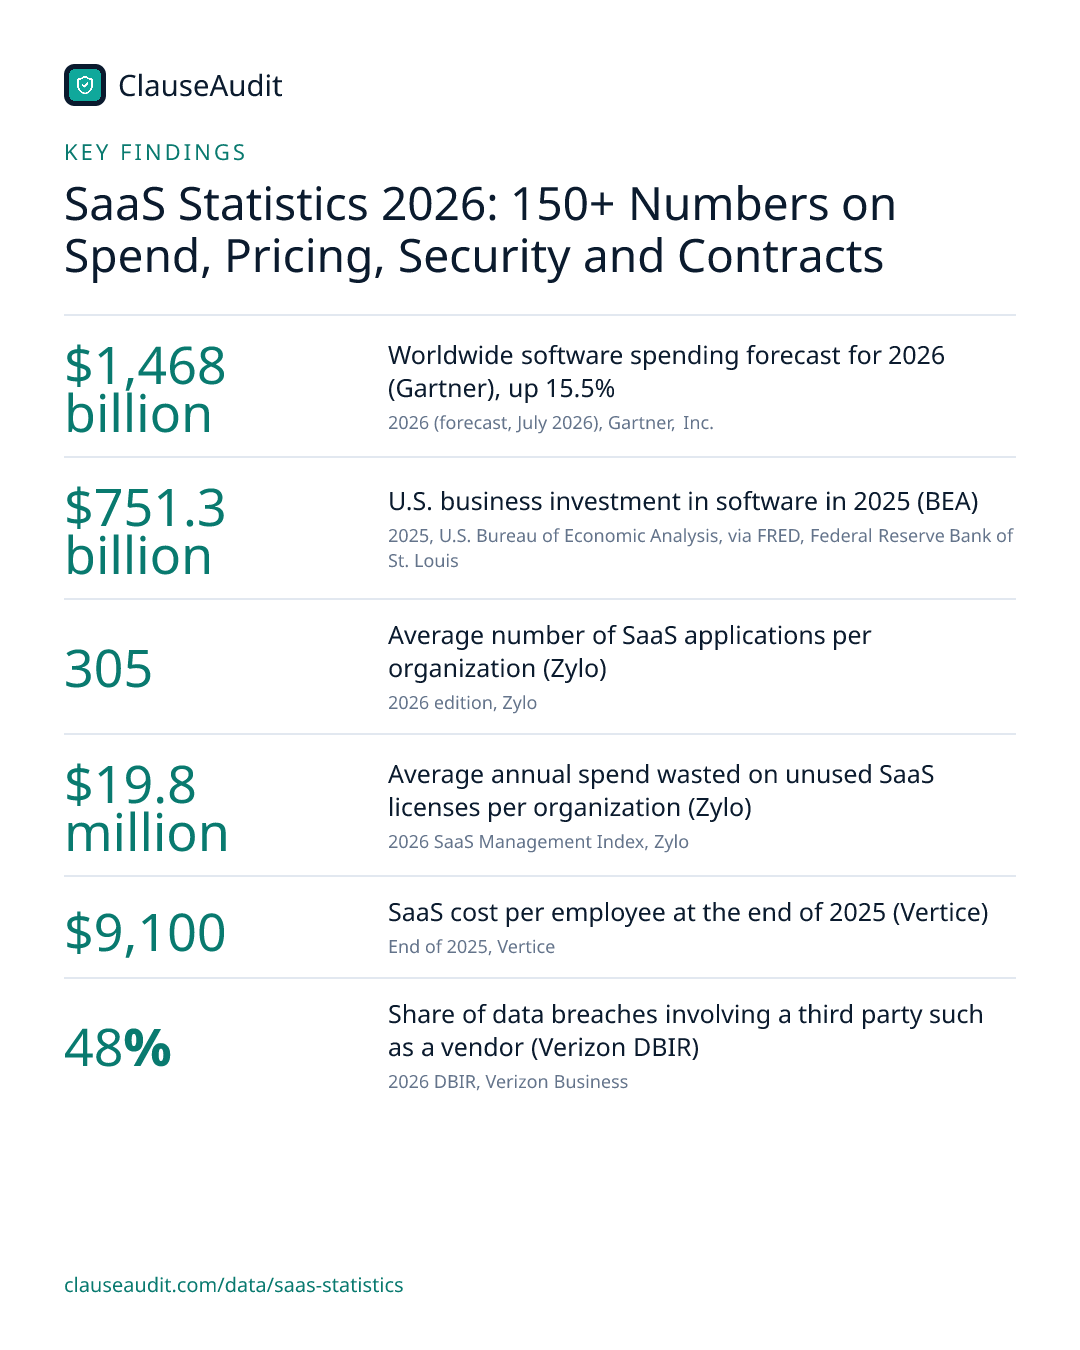
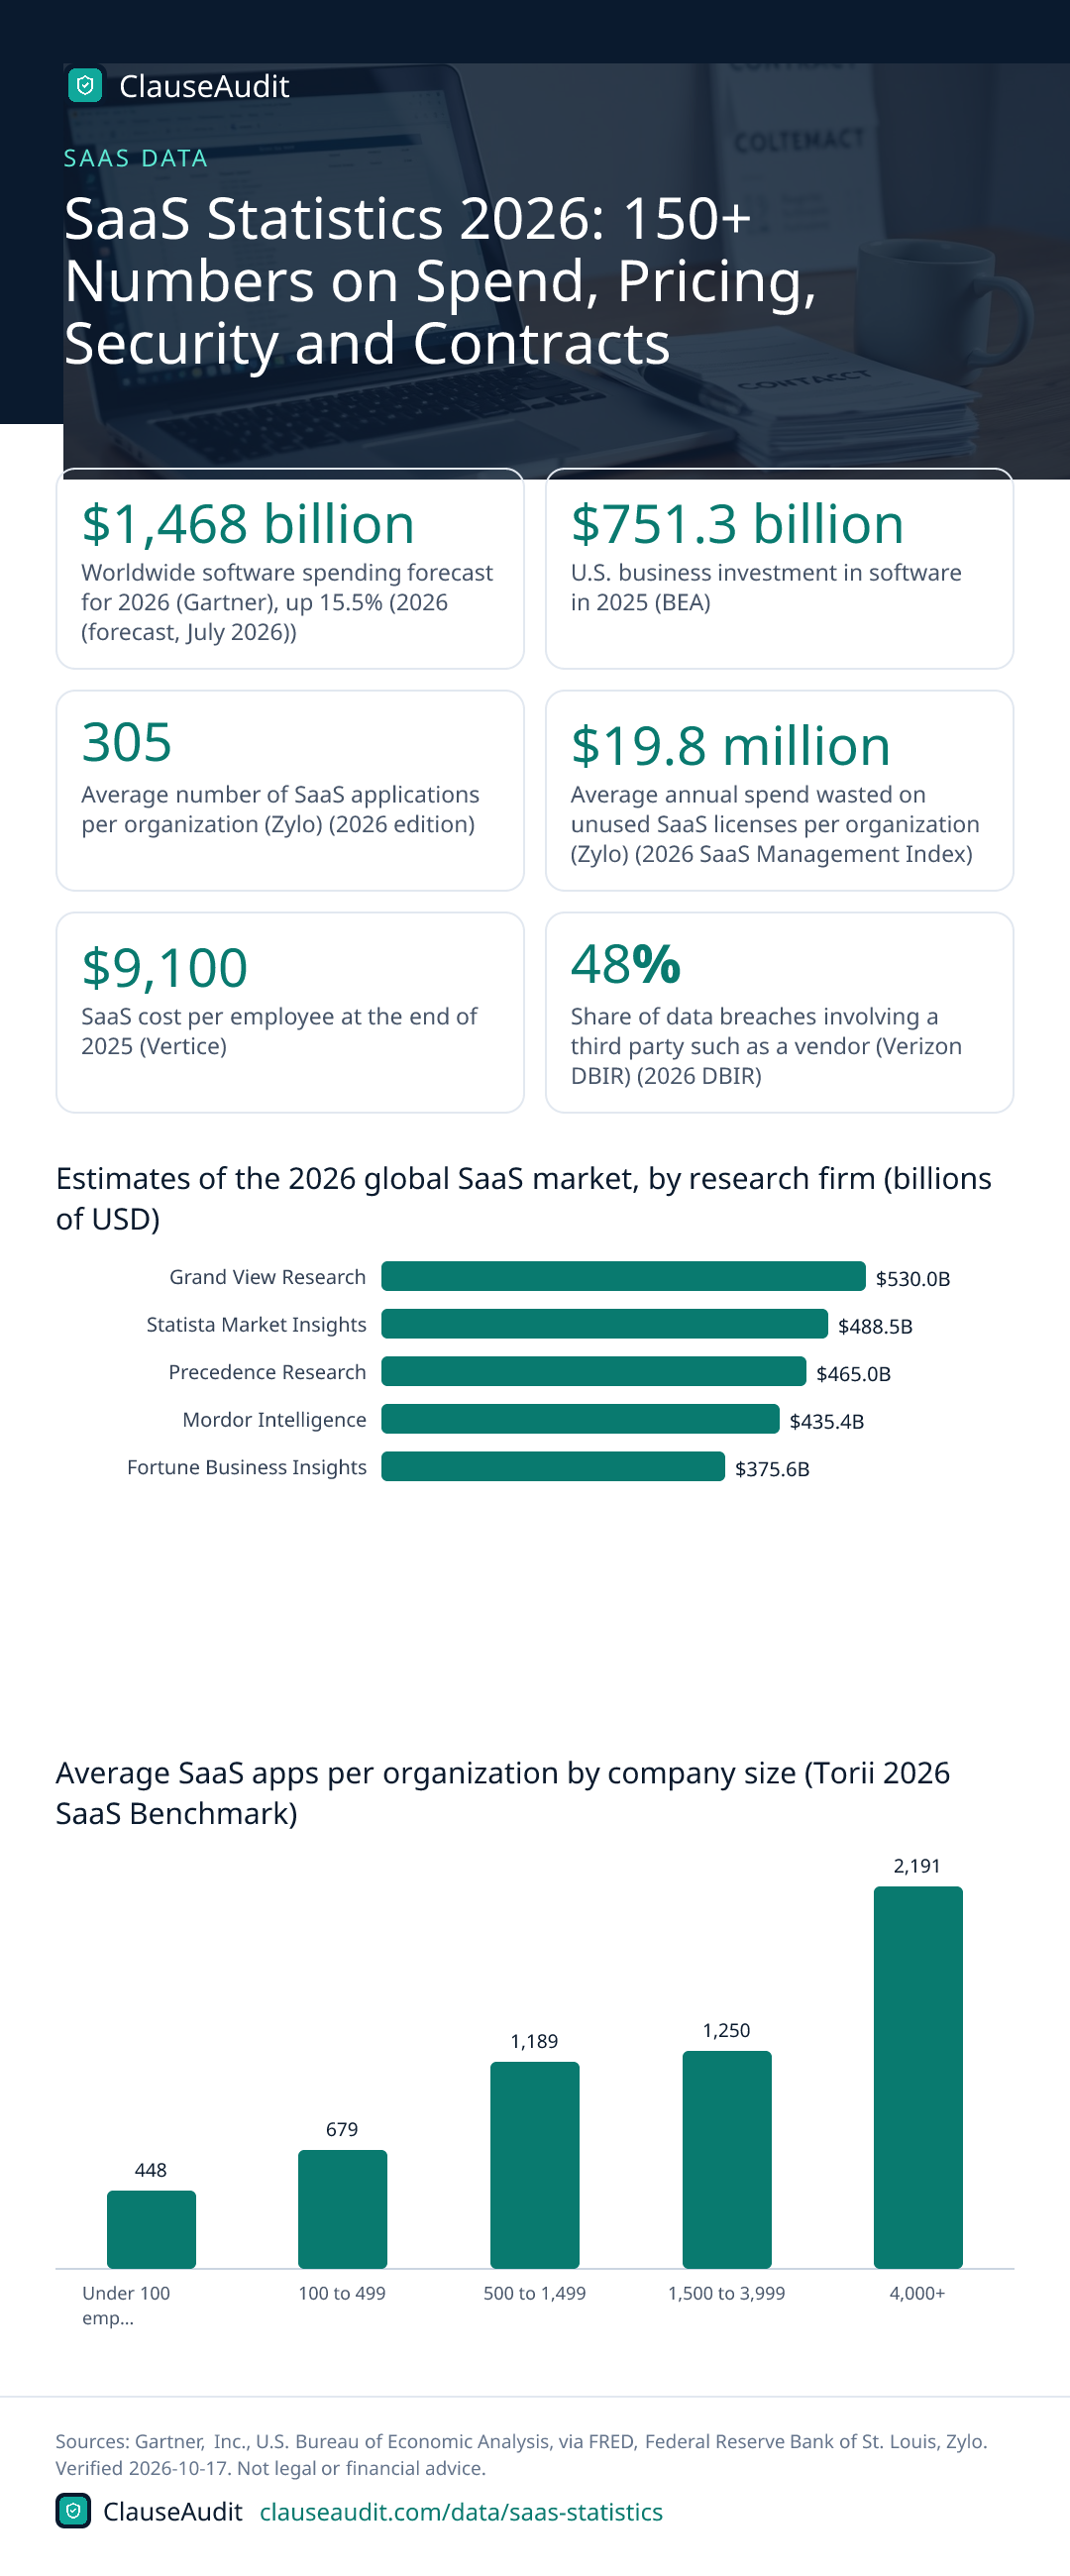
Gartner forecasts worldwide software spending of $1,468 billion in 2026, up 15.5%. The average organization runs 305 SaaS apps and wastes $19.8 million a year on unused licenses, per Zylo. SaaS costs reached about $9,100 per employee at the end of 2025, and 48% of data breaches involved a third party such as a vendor.

- Worldwide software spending forecast for 2026 (Gartner), up 15.5% (2026 (forecast, July 2026), Gartner, Inc.)
- $1,468 billion
- U.S. business investment in software in 2025 (BEA) (2025, U.S. Bureau of Economic Analysis, via FRED, Federal Reserve Bank of St. Louis)
- $751.3 billion
- Average number of SaaS applications per organization (Zylo) (2026 edition, Zylo)
- 305
- Average annual spend wasted on unused SaaS licenses per organization (Zylo) (2026 SaaS Management Index, Zylo)
- $19.8 million
- SaaS cost per employee at the end of 2025 (Vertice) (End of 2025, Vertice)
- $9,100
- Share of data breaches involving a third party such as a vendor (Verizon DBIR) (2026 DBIR, Verizon Business)
- 48%
- Company spending on generative AI in 2025, up from $11.5 billion (Menlo) (2025, Menlo Ventures)
- $37 billion
- Median 2025 growth rate of private B2B SaaS companies (SaaS Capital) (2025, SaaS Capital)
- 22%
This page collects more than 150 SaaS statistics in twelve groups: market size, U.S. software investment, revenue at the largest SaaS companies, app sprawl, spend and license waste, pricing, contract and auto-renewal rules, security, AI, growth and retention benchmarks, funding and deals, and India and the software workforce.
Each figure links to a named source: government data from the BEA, Census Bureau, BLS and FTC, company filings, court opinions and statutes, plus industry surveys and spend-management vendors whose numbers come from their own customers. Forecasts are labeled as forecasts, and the data was checked on October 17, 2026.
SaaS Market Size and Spending Forecast Statistics
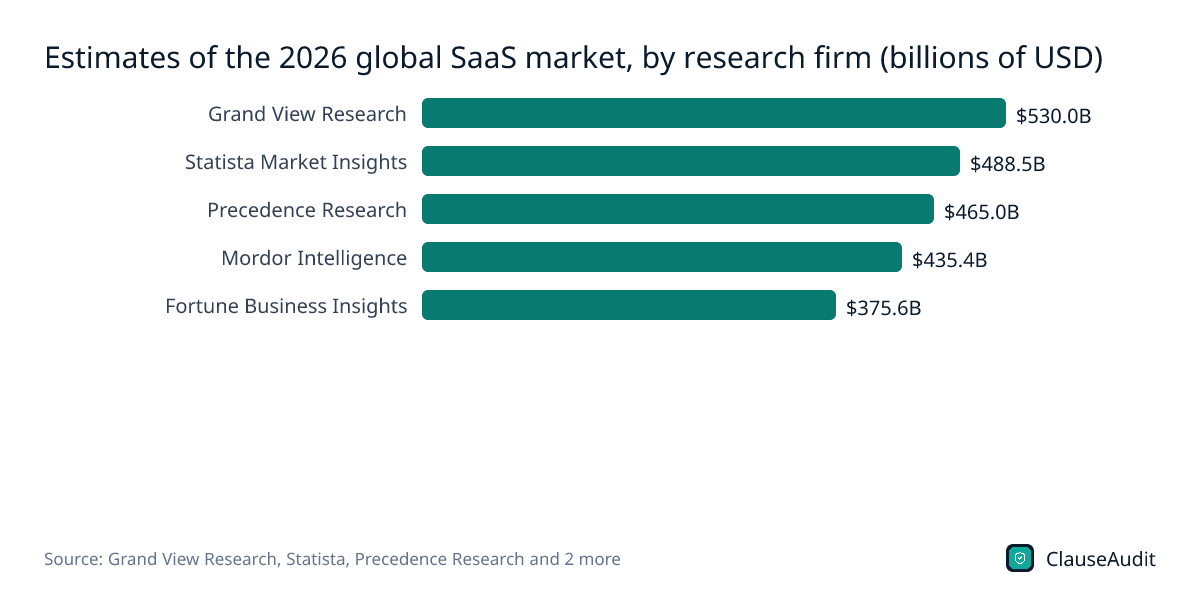
Market size estimates for SaaS vary by more than $100 billion depending on who is counting and how SaaS is defined. Gartner's software and cloud forecasts sit alongside five commercial research estimates here.
- $1,468 billion is Gartner's forecast for worldwide software spending in 2026, up 15.5% from $1,271 billion in 2025; a forecast, not a measured total. (Gartner, Inc., Gartner Forecasts Worldwide IT Spending to Grow 14.2% in 2026, Totaling $6.37 Trillion, 2026 (forecast, July 2026))
- $6.37 trillion is Gartner's forecast for total worldwide IT spending in 2026, a 14.2% rise, with software growing faster than the overall market. (Gartner, Inc., Gartner Forecasts Worldwide IT Spending to Grow 14.2% in 2026, Totaling $6.37 Trillion, 2026 (forecast, July 2026))
- $723.4 billion was Gartner's forecast for 2025 worldwide end-user spending on public cloud services, up from $595.7 billion in 2024 (November 2024 forecast). (Gartner, Inc., Gartner Forecasts Worldwide Public Cloud End-User Spending to Total $723 Billion in 2025, 2025 (forecast, Nov. 2024))
- $299,071 million was Gartner's 2025 forecast for worldwide SaaS (cloud application services) spending, the largest public cloud segment, up 19.2% from 2024. (Gartner, Inc., Gartner Forecasts Worldwide Public Cloud End-User Spending to Total $723 Billion in 2025, 2025 (forecast, Nov. 2024))
- almost A$16.4 billion is Gartner's 2026 forecast for Australian SaaS spending, growth slowing to 13.8% as buyers optimize licenses and cut seat growth. (Gartner, Inc., Gartner Forecasts Australian Organizations Will Spend More Than A$33 Billion on Public Cloud in 2026, 2026 (forecast, May 2026))
- $497 billion was the worldwide revenue from cloud infrastructure, SaaS, social media and search combined in Q2 2026, up 27% from a year earlier. (Synergy Research Group, Annual Revenues from Key Cloud and Digital Services to Pass $5 Trillion in 2031, Q2 2026)
- $143 billion was quarterly cloud infrastructure services revenue in Q2 2026, the platform layer many SaaS products run on, after year-over-year growth of 43%. (Synergy Research Group, Q2 Cloud Market Passes $143 Billion; Highest Growth Rate in Eight Years, Q2 2026)
- US$488.53 billion is Statista Market Insights' projection for worldwide SaaS revenue in 2026, the second-highest of the five commercial estimates compared here. (Statista, Software as a Service - Worldwide (Market Insights outlook), 2026 (projection))
- US$254.94 billion of 2026 SaaS revenue is projected by Statista for the United States, the largest single country market in its model. (Statista, Software as a Service - Worldwide (Market Insights outlook), 2026 (projection))
- USD 464.7 billion was Grand View Research's estimate of the global SaaS market in 2025, with growth forecast at an 11.1% CAGR from 2026 to 2033. (Grand View Research, Software as a Service Market Size, Share and Trends Analysis Report, 2025 (estimate))
- USD 132.19 billion was Precedence Research's estimate of the U.S. SaaS market in 2025, about half of Statista's 2026 U.S. figure because definitions differ. (Precedence Research, Software as a Service (SaaS) Market Size, 2025 (estimate))
- USD 435.41 billion is Mordor Intelligence's estimate of the 2026 SaaS market, with a forecast 17.55% CAGR through 2031. (Mordor Intelligence, Software as a Service (SaaS) Market Size and Share Analysis, 2026 (estimate))
- USD 315.68 billion was Fortune Business Insights' 2025 global SaaS estimate, about $149 billion below Grand View Research's figure for the same year. (Fortune Business Insights, Software as a Service (SaaS) Market Size, Share and Industry Analysis, 2025 (estimate))
Figure 1: Estimates of the 2026 global SaaS market, by research firm (billions of USD)
Chart data
| Label | Value |
|---|---|
| Grand View Research | $530.0B |
| Statista Market Insights | $488.5B |
| Precedence Research | $465.0B |
| Mordor Intelligence | $435.4B |
| Fortune Business Insights | $375.6B |
U.S. Software Investment and Government SaaS Data
Government data gives the most consistent long-run view of U.S. software spending. These figures come from the BEA, the Census Bureau, the BLS and federal IT sources.
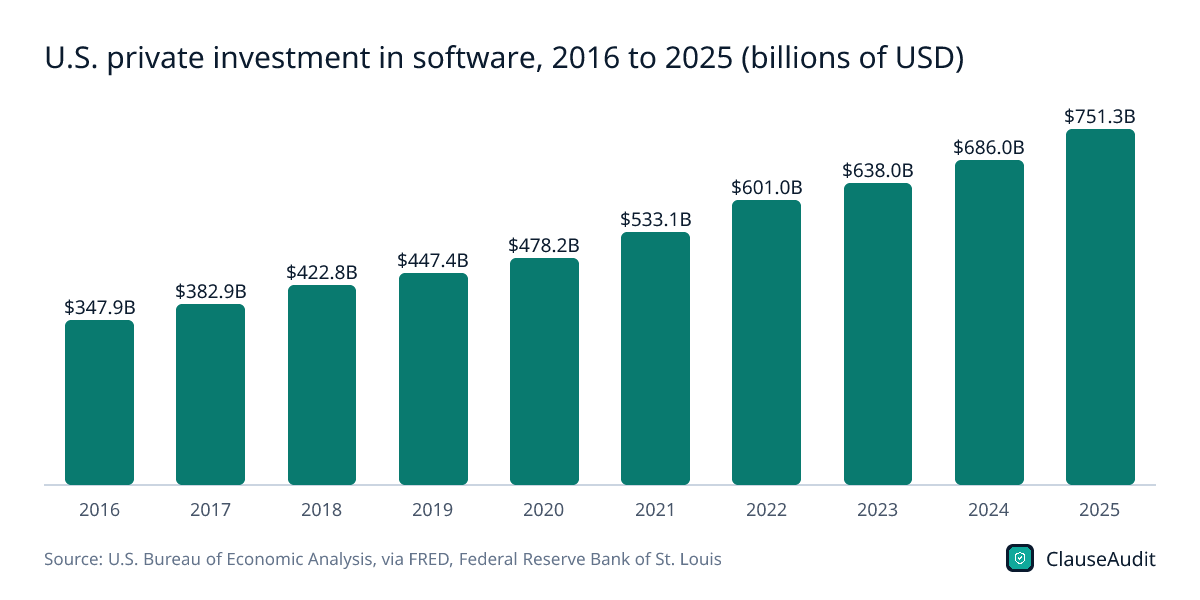
- $751.3 billion U.S. businesses invested $751.3 billion in software in 2025, up from $686.0 billion in 2024, per BEA private fixed investment data. (U.S. Bureau of Economic Analysis, via FRED, Federal Reserve Bank of St. Louis, Private fixed investment: Nonresidential: Intellectual property products: Software (B985RC1A027NBEA), annual CSV, 2025)
- $809.3 billion U.S. business software investment ran at a seasonally adjusted annual rate of $809.3 billion in the second quarter of 2026. (U.S. Bureau of Economic Analysis, via FRED, Federal Reserve Bank of St. Louis, Private fixed investment: Nonresidential: Intellectual property products: Software (B985RC1Q027SBEA), quarterly, Q2 2026)
- $858.1 billion Measured in inflation-adjusted chained 2017 dollars, U.S. real software investment reached $858.1 billion in 2025, up from $764.7 billion in 2024. (U.S. Bureau of Economic Analysis, via FRED, Federal Reserve Bank of St. Louis, Real private fixed investment: Intellectual property products: Software (B985RX1A020NBEA), 2025)
- $177.0 billion U.S. software publishers earned $177.0 billion in seasonally adjusted revenue in Q2 2026, up 14.7% from Q2 2025. (U.S. Census Bureau, Quarterly Selected Services Estimates, Second Quarter 2026 (Release CB26-146), Q2 2026)
- 20.3% Revenue for U.S. data processing, hosting and related services, which includes cloud hosting, grew 20.3% year over year to $124.1 billion in Q2 2026. (U.S. Census Bureau, Quarterly Selected Services Estimates, Second Quarter 2026 (Release CB26-146), Q2 2026)
- $194.9 billion U.S. computer systems design and related services firms had $194.9 billion in Q2 2026 revenue, up only 3.3% from a year earlier. (U.S. Census Bureau, Quarterly Selected Services Estimates, Second Quarter 2026 (Release CB26-146), Q2 2026)
- $704.4 billion Total U.S. information sector revenue reached $704.4 billion in Q2 2026, up 9.9% from the second quarter of 2025. (U.S. Census Bureau, Quarterly Selected Services Estimates, Second Quarter 2026 (Release CB26-146), Q2 2026)
- 14.2% BLS projects U.S. software publisher employment will grow 14.2%, from 654,100 jobs in 2025 to 746,800 in 2035. (U.S. Bureau of Labor Statistics, Employment Projections Table 2.11: Employment and output by industry, 2025 and projected 2035, 2025 to 2035 (projection))
- 4.0% Real output of U.S. software publishers is projected to grow 4.0% a year, from $608.2 billion in 2025 to $902.6 billion in 2035, in chained 2017 dollars. (U.S. Bureau of Labor Statistics, Employment Projections Table 2.11: Employment and output by industry, 2025 and projected 2035, 2025 to 2035 (projection))
- 25.1% Employment at computing infrastructure providers, data processing and web hosting firms is projected to rise 25.1% between 2025 and 2035. (U.S. Bureau of Labor Statistics, Employment Projections Table 2.11: Employment and output by industry, 2025 and projected 2035, 2025 to 2035 (projection))
- 1,905,400 The U.S. had 1,905,400 jobs for software developers, quality assurance analysts and testers in 2025, with 10% growth projected through 2035. (U.S. Bureau of Labor Statistics, Occupational Outlook Handbook: Software Developers, Quality Assurance Analysts, and Testers, 2025)
- $102.3 billion The federal IT Dashboard reports $102.3 billion in U.S. government IT spending for fiscal year 2025. (U.S. Office of Management and Budget, IT Dashboard, Federal IT Dashboard home page (FY2025 IT Spending), FY2025)
- 544 FedRAMP lists 544 certified cloud services cleared for U.S. federal agency use, including 32 certified through its newer FedRAMP 20x process. (FedRAMP, U.S. General Services Administration, FedRAMP home page (certified services counter), As displayed Oct. 2026)
Figure 2: U.S. private investment in software, 2016 to 2025 (billions of USD)
Chart data
| Label | Value (billions of USD) |
|---|---|
| 2016 | $347.9B |
| 2017 | $382.9B |
| 2018 | $422.8B |
| 2019 | $447.4B |
| 2020 | $478.2B |
| 2021 | $533.1B |
| 2022 | $601.0B |
| 2023 | $638.0B |
| 2024 | $686.0B |
| 2025 | $751.3B |
Largest SaaS Companies Revenue Statistics
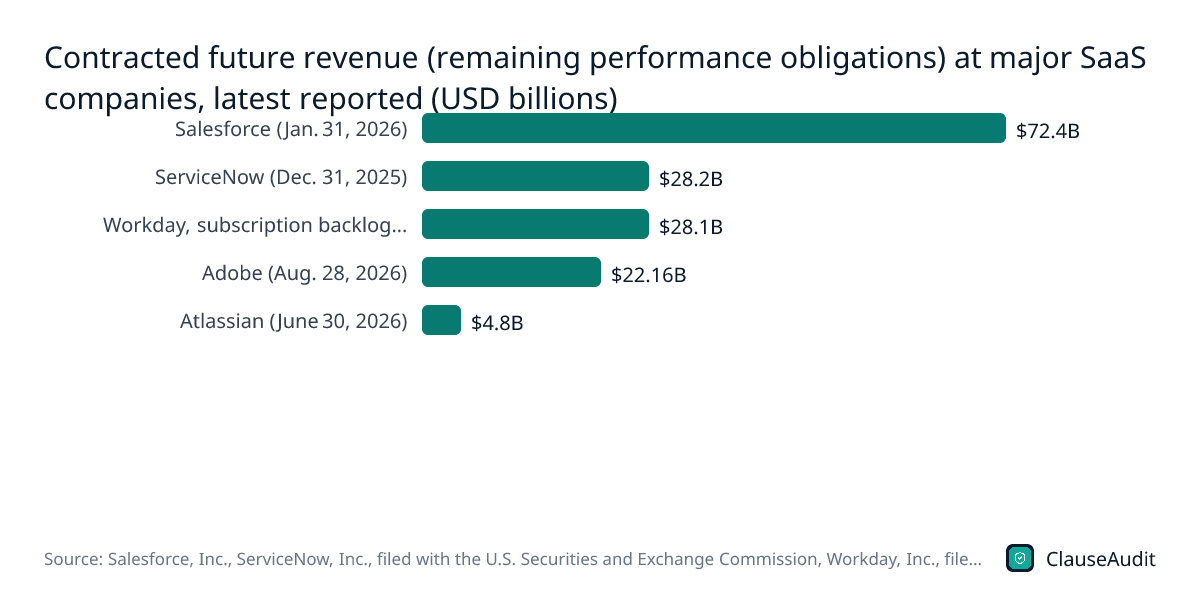
Public filings from the largest SaaS vendors show how much revenue is already locked in by signed contracts. Remaining performance obligation is revenue customers have committed to but the vendor has not yet recognized.
- $59.3 billion in Microsoft Cloud revenue in the quarter ended June 30, 2026, up 27% year over year. (Microsoft Corporation, Microsoft Cloud and AI Strength Fuels Fourth Quarter Results (FY26 Q4 press release), Q4 FY2026 (quarter ended June 30, 2026))
- $678 billion in Microsoft commercial remaining performance obligation (contracted revenue not yet recognized) at the end of fiscal 2026, up 84%. (Microsoft Corporation, Microsoft Cloud and AI Strength Fuels Fourth Quarter Results (FY26 Q4 press release), June 30, 2026)
- $41.5 billion in Salesforce revenue for fiscal 2026, up 10% year over year, including a $399 million contribution from Informatica. (Salesforce, Inc., Salesforce Announces Fourth Quarter and Fiscal 2026 Results, FY2026 (ended January 31, 2026))
- More than $2.9 billion in combined Agentforce and Data 360 annual recurring revenue at Salesforce at fiscal 2026 year end, up more than 200% year over year. (Salesforce, Inc., Salesforce Announces Fourth Quarter and Fiscal 2026 Results, FY2026 (ended January 31, 2026))
- $27.50 billion in total Adobe annualized recurring revenue (ARR) at the end of its third quarter of fiscal 2026. (Adobe Inc., Adobe Reports Record Q3 Results (Q3 FY2026 earnings press release), Q3 FY2026 (ended Aug. 28, 2026))
- $6.56 billion in Adobe subscription revenue in Q3 fiscal 2026, 14% higher than a year earlier, out of $6.76 billion total revenue. (Adobe Inc., Adobe Reports Record Q3 Results (Q3 FY2026 earnings press release), Q3 FY2026 (ended Aug. 28, 2026))
- $3,466 million in ServiceNow subscription revenue in Q4 2025, representing 21% year-over-year growth. (ServiceNow, Inc., filed with the U.S. Securities and Exchange Commission, ServiceNow fourth quarter and full year 2025 financial results (Form 8-K, Exhibit 99.1), Q4 2025)
- $28.2 billion in ServiceNow remaining performance obligations at the end of 2025, up 26.5% year over year. (ServiceNow, Inc., filed with the U.S. Securities and Exchange Commission, ServiceNow fourth quarter and full year 2025 financial results (Form 8-K, Exhibit 99.1), December 31, 2025)
- $8.833 billion in Workday subscription revenue for fiscal 2026, up 14.5%, out of $9.552 billion in total revenue. (Workday, Inc., filed with the U.S. Securities and Exchange Commission, Workday fiscal 2026 fourth quarter and full year financial results (Form 8-K, Exhibit 99.1), FY2026 (ended January 31, 2026))
- $6,572 million in Atlassian total revenue for fiscal 2026, up 26% from $5,215 million in fiscal 2025. (Atlassian Corporation, filed with the U.S. Securities and Exchange Commission, Atlassian fourth quarter and fiscal year 2026 results (Form 8-K, Exhibit 99.1), FY2026 (ended June 30, 2026))
- $3.06 billion in HubSpot subscription revenue for full-year 2025, up 19% from 2024, as customers grew 16% to 288,706. (HubSpot, Inc., filed with the U.S. Securities and Exchange Commission, HubSpot fourth quarter and full year 2025 results (Form 8-K, Exhibit 99.1), 2025)
- $802 million in Shopify subscription solutions revenue in Q2 2026, up about 22% from $656 million a year earlier. (Shopify Inc., Shopify Delivers Big: 30%+ Growth Across GMV, Revenue, Gross Profit, and Free Cash Flow (Q2 2026 results), Q2 2026)
- 104% was Freshworks’ net dollar retention rate in Q2 2026, down from 106% in the prior quarter and a year earlier. (Freshworks Inc., Freshworks Reports Record Second Quarter 2026 Results, Q2 2026)
Figure 3: Contracted future revenue (remaining performance obligations) at major SaaS companies, latest reported (USD billions)
Chart data
| Label | Value |
|---|---|
| Salesforce (Jan. 31, 2026) | $72.4B |
| ServiceNow (Dec. 31, 2025) | $28.2B |
| Workday, subscription backlog (Jan. 31, 2026) | $28.1B |
| Adobe (Aug. 28, 2026) | $22.16B |
| Atlassian (June 30, 2026) | $4.8B |
SaaS Adoption and App Sprawl Statistics
How many apps a company runs depends on how they are counted: purchased tools, apps found through discovery, or apps connected to a single sign-on system. The figures below show each method.
- 305 applications is the average SaaS portfolio size among organizations in Zylo's 2026 SaaS Management Index, with app counts essentially flat year over year. (Zylo, 2026 SaaS Management Index (8th edition), 2026 edition)
- 240 applications is the median SaaS portfolio size in Zylo's 2026 data, below the 305 average because the largest enterprises run far more apps. (Zylo, 2026 SaaS Management Index (8th edition), 2026 edition)
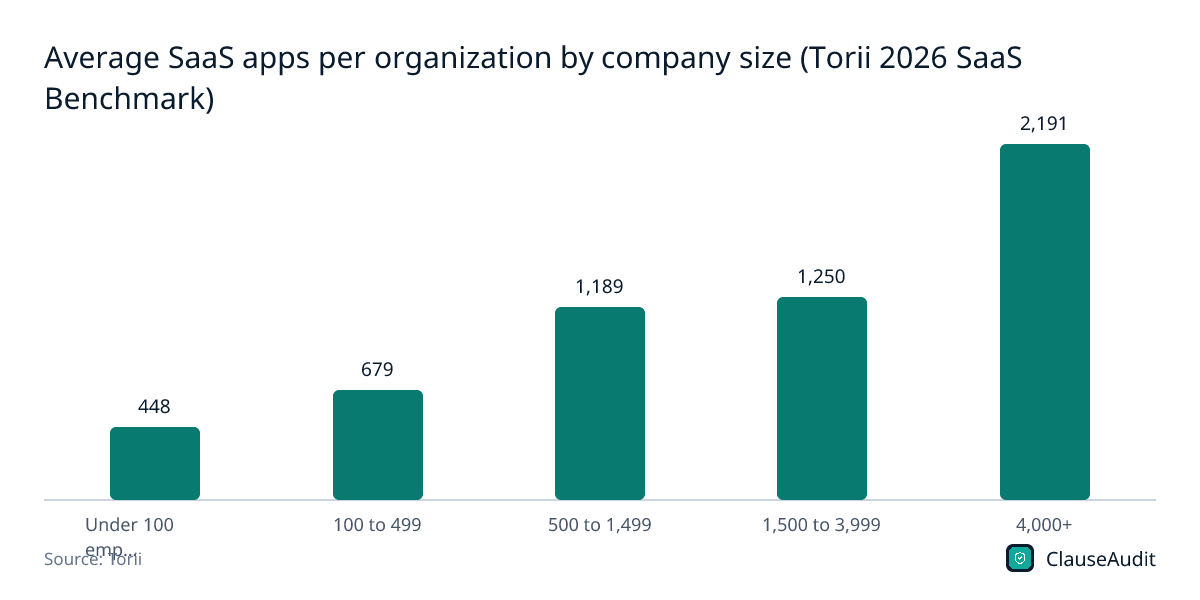
- 831 SaaS apps run at the average organization in Torii's 2026 SaaS Benchmark, which counts apps found by discovery, including unsanctioned ones. (Torii, SaaS Statistics (Torii 2026 SaaS Benchmark findings), 2025 data (2026 report))
- 61.3% of apps in the average portfolio are shadow IT, found through usage, browser activity or direct signup rather than procurement, according to Torii. (Torii, SaaS Statistics (Torii 2026 SaaS Benchmark findings), 2025 data (2026 report))
- 15.5% of applications in the average portfolio are formally sanctioned tools, Torii's 2026 benchmark found; the rest are blocked, in review or unmanaged. (Torii, SaaS Statistics (Torii 2026 SaaS Benchmark findings), 2025 data (2026 report))
- 27% adoption put Grok Bot at the top of Torii's October 2026 Shadow IT Index, where AI agents led the list of unsanctioned apps. (Torii, Torii Research: Shadow IT Index (October 2026), Oct. 2026)
- 98 apps were deployed per company on average in Okta's Businesses at Work 2026 data, down 3% from 101 the year before. (Okta, Inc., Businesses at Work 2026 press release (Japanese), Nov. 2024 to Oct. 2025 data)
- 158% was the year-over-year increase in average access requests per company in Okta's 2026 data, and 1,140% over two years. (Okta, Inc., Businesses at Work 2026 press release (Japanese), Nov. 2024 to Oct. 2025 data)
- 27 AI-powered SaaS applications are used by the average organization, according to BetterCloud's State of SaaS 2026 survey of 525 respondents. (BetterCloud, The State of SaaS 2026, 2026 edition)
- 118 SaaS apps per organization is BetterCloud's projection for 2026, up from 8 in 2015, an 11% annual increase in its survey-based series. (BetterCloud, The State of SaaS 2026, 2026 (projection))
- 52.74% of EU enterprises bought paid cloud computing services in 2025, up 7.42 percentage points from 2023, Eurostat's benchmark for business cloud adoption. (Eurostat (European Commission), Cloud computing - statistics on the use by enterprises, 2025)
- 27.91% of EU enterprises that buy cloud services use them for customer relationship management, versus 85.15% for email and 71.69% for office software, in 2025. (Eurostat (European Commission), Cloud computing - statistics on the use by enterprises, 2025)
- 12% of Australian businesses reported using artificial intelligence in the 2024-25 financial year, up from 1% in 2021-22. (Australian Bureau of Statistics, Characteristics of Australian Business, 2024-25, 2024-25)
Figure 4: Average SaaS apps per organization by company size (Torii 2026 SaaS Benchmark)
Chart data
| Label | Value |
|---|---|
| Under 100 employees | 448 |
| 100 to 499 | 679 |
| 500 to 1,499 | 1,189 |
| 1,500 to 3,999 | 1,250 |
| 4,000+ | 2,191 |
SaaS Spend Management and Wasted License Statistics
SaaS is now a large line item, and a share of it pays for seats nobody uses. These numbers cover spend per employee, license utilization, renewals and audits.
- $19.8 million Organizations wasted an average of $19.8 million on unused SaaS licenses, down 5.3% from $20.9 million a year earlier, per Zylo customer data. (Zylo, SaaS Statistics (figures from Zylo's 2026 SaaS Management Index), 2026 SaaS Management Index)
- 54% Average SaaS license utilization rose to 54% in 2025 from 47% in 2024, meaning nearly half of paid licenses still went unused. (Zylo, SaaS Statistics (figures from Zylo's 2026 SaaS Management Index), 2025)
- 211 The average organization manages 211 SaaS renewals a year, roughly four contract renewals every week. (Zylo, SaaS Statistics (figures from Zylo's 2026 SaaS Management Index), 2026 SaaS Management Index)
- 61% 61% of IT leaders said they cut projects in the past year because of unplanned SaaS cost increases. (Zylo, 2026 SaaS Management Index (8th edition), Past year, 2026 edition)
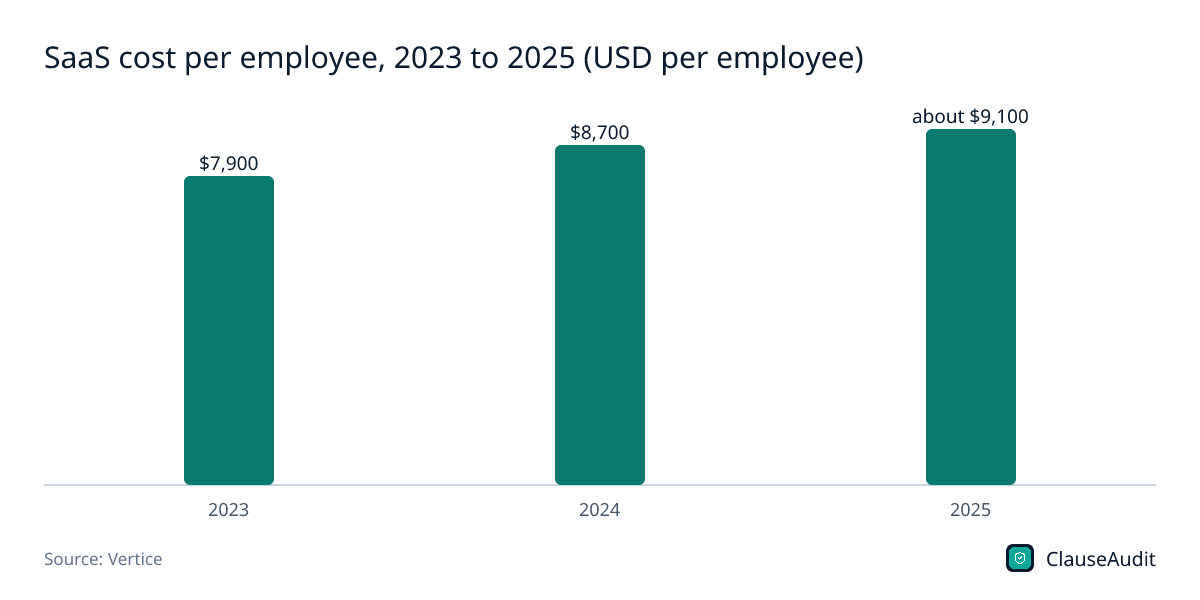
- $9,100 SaaS costs per employee reached approximately $9,100 by the end of 2025, up from $8,700 in 2024 and $7,900 in 2023. (Vertice, SaaS Inflation Index Report, End of 2025)
- $1 in every $8 For a typical organization, $1 in every $8 of spending now goes to SaaS, according to Vertice's spend data. (Vertice, SaaS Inflation Index Report, 2026)
- 29% Organizations estimate 29% of their IaaS and PaaS cloud spend is wasted, a slight uptick that reversed five years of decline. (Flexera, Flexera 2026 State of the Cloud Report, 2026 report (surveyed winter 2025))
- 73% 73% of small and midsize businesses spend less than $50,000 a month on SaaS. (Flexera, Flexera 2026 State of the Cloud Report, 2026 report (surveyed winter 2025))
- 15% 15% of mid-size and large U.S. companies surveyed had no formal system in place for tracking their AI costs. (CloudZero, The State Of AI Costs In 2025, March 2025 survey)
- 8% 8% of organizations said they do not track SaaS costs at all, up from 5% the year before. (Flexera, Flexera 2026 State of the Cloud Report, 2026 report (surveyed winter 2025))
- 48% 48% of organizations received a software vendor audit in the past year, and 44% spent more than $1 million on audits over three years. (Flexera, Flexera 2026 State of ITAM Report, Past year, 2026 report)
- $1.68 billion GSA's OneGov program, which negotiates governmentwide software and AI deals, has achieved about $1.68 billion in federal cost savings since its inception. (U.S. General Services Administration, GSA Expands OneGov AI Offerings with Discounted, Consumption-Based Access to OpenAI's ChatGPT, Cumulative through Sept. 2026)
- None of 9 In 2024, none of nine large federal agencies GAO reviewed had fully determined whether their five most widely used software licenses were over- or under-purchased. (U.S. Government Accountability Office, Federal Software Licenses: Agencies Need to Take Action to Achieve Additional Savings (GAO-24-105717), January 2024)
Figure 5: SaaS cost per employee, 2023 to 2025 (USD per employee)
Chart data
| Label | Value (USD per employee) |
|---|---|
| 2023 | $7,900 |
| 2024 | $8,700 |
| 2025 | about $9,100 |
SaaS Pricing and Price Increase Statistics
Official price indexes and vendor-reported SaaS inflation tell different stories. This section also covers the move to usage-based and AI-linked pricing.
- 2.4% rise in the U.S. producer price index for software publishers from September 2025 to September 2026, calculated from BLS index values (99.746 to 102.101). (U.S. Bureau of Labor Statistics, via FRED, Federal Reserve Bank of St. Louis, Producer Price Index by Industry: Software Publishers (PCU511210511210), BLS data, Sept. 2026 vs. Sept. 2025)
- 3.7% rise in U.S. consumer prices (CPI-U, all items) over the 12 months ending September 2026, above the software publishers price index. (U.S. Bureau of Labor Statistics, Consumer Price Index - September 2026 (news release), 12 months ending Sept. 2026)
- 13.2% is the SaaS inflation rate reported by spend-management vendor Vertice in its 2026 index, based on its own customer data. (Vertice, SaaS Inflation Index Report, 2026 edition)
- 60% of software vendors deliberately mask their rising prices, making cost clarity harder in negotiations, according to Vertice’s 2026 SaaS Inflation Index. (Vertice, SaaS Inflation Index Report, 2026 edition)
- 78% of IT leaders reported unexpected charges tied to AI features or consumption-based pricing in the past year, according to Zylo. (Zylo, 2026 SaaS Management Index (8th edition), 2026 edition (past year))
- 85% of 100 SaaS companies surveyed in January 2025 by Metronome and Greyhound Capital had adopted usage-based pricing. (Metronome, State of Usage-Based Pricing 2025, January 2025)
- 64% of the companies on Forbes’ Next Billion-Dollar Startups list offer usage-based pricing, according to Metronome’s 2025 report. (Metronome, State of Usage-Based Pricing 2025, Metronome 2025 report)
- 78% of companies with usage-based pricing adopted it within the last five years, per Metronome’s January 2025 survey of 100 SaaS companies. (Metronome, State of Usage-Based Pricing 2025, January 2025)
- 42% of AI product builders in ICONIQ's Q2 2026 survey of about 300 software executives used consumption-based pricing, up from 35% six months earlier. (ICONIQ, 2026 State of AI Report: The Builder's Economy, Q2 2026 survey (July 2026 report))
- 6% average list price increase Salesforce applied on August 1, 2025, to Enterprise and Unlimited Editions of Sales Cloud, Service Cloud and other products. (Salesforce, Inc., Salesforce pricing update: Agentforce add-ons and Enterprise and Unlimited Edition list prices, Effective Aug. 1, 2025)
- $14 per user, per month is what Google Workspace Business Standard with Gemini AI costs after Google’s January 2025 change, $2 more than the plan without Gemini. (Google Workspace (Google LLC), The best of Google AI, now included in Workspace Business and Enterprise plans, Announced Jan. 16, 2025)
| September | Software publishers PPI (index) | PPI change | CPI-U (index) | CPI-U change |
|---|---|---|---|---|
| 2020 | 87.600 | +0.8% | 260.280 | +1.4% |
| 2021 | 87.453 | -0.2% | 274.310 | +5.4% |
| 2022 | 88.240 | +0.9% | 296.808 | +8.2% |
| 2023 | 91.954 | +4.2% | 307.789 | +3.7% |
| 2024 | 100.039 | +8.8% | 315.301 | +2.4% |
| 2025 | 99.746 | -0.3% | 324.800 | +3.0% |
| 2026 | 102.101 | +2.4% | 336.940 | +3.7% |
SaaS Contract, Auto-Renewal and Cancellation Statistics
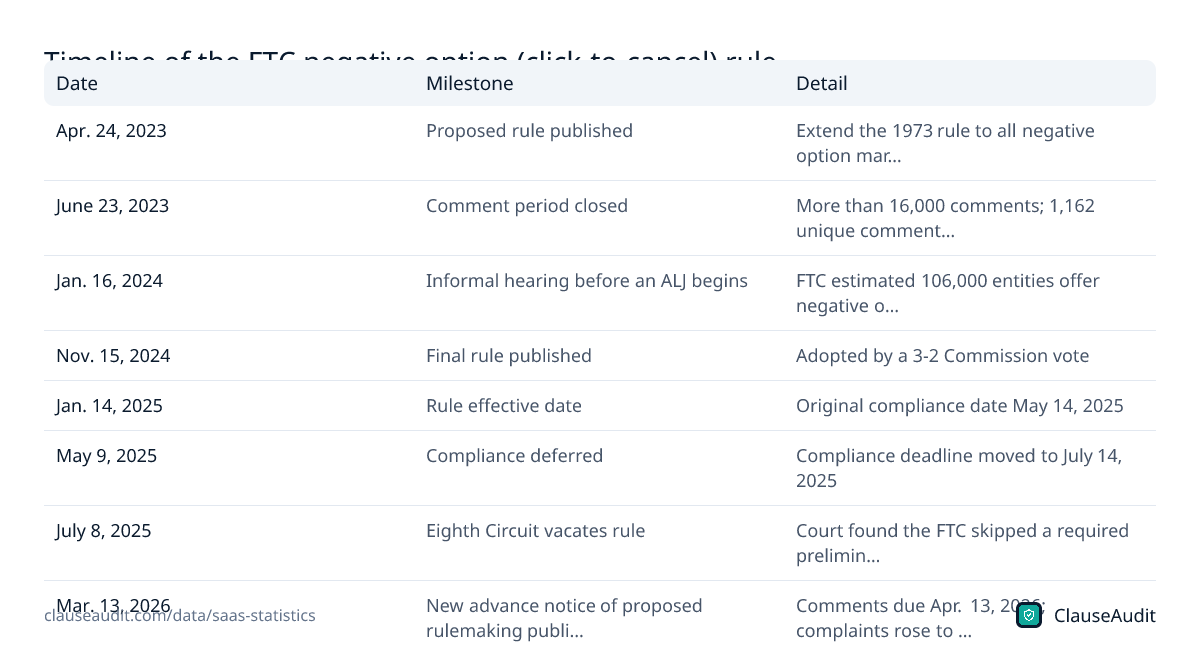
Auto-renewal and cancellation rules shifted in 2025 when a federal court vacated the FTC's click-to-cancel rule. State laws, FTC enforcement and vendor contract terms fill the gap.
- more than 16,000 comments reached the FTC on its proposed click-to-cancel negative option rule, of which it published 1,162 unique comments. (Federal Trade Commission, Federal Register (via GovInfo), Negative Option Rule (final rule), 89 FR 90476, 2023 comment period)
- 106,000 entities offer negative option features such as auto-renewing subscriptions, according to the FTC estimate cited by the Eighth Circuit. (U.S. Court of Appeals for the Eighth Circuit, Custom Communications, Inc. v. Federal Trade Commission, No. 24-3137 (opinion), 2024 estimate)
- July 8, 2025 is the date the U.S. Court of Appeals for the Eighth Circuit vacated the FTC's click-to-cancel rule in full on procedural grounds. (U.S. Court of Appeals for the Eighth Circuit, Custom Communications, Inc. v. Federal Trade Commission, No. 24-3137 (opinion), July 8, 2025)
- more than 90 per day negative option complaints reached the FTC in 2025, up from at least 33 per day in late 2020, the Commission said in its 2026 advance notice. (Federal Trade Commission, Federal Register (via GovInfo), Rule Concerning the Use of Prenotification Negative Option Plans (advance notice of proposed rulemaking), 91 FR 12318, 2025)
- only 25 sellers were subject to the FTC's original 1973 prenotification negative option rule in 2024, staff estimated, according to the Commission's 2026 advance notice. (Federal Trade Commission, Federal Register (via GovInfo), Rule Concerning the Use of Prenotification Negative Option Plans (advance notice of proposed rulemaking), 91 FR 12318, 2024)
- $2.5 billion is the FTC's September 2025 Amazon Prime settlement over enrollment and cancellation practices: a $1 billion civil penalty plus $1.5 billion in consumer redress. (Federal Trade Commission, FTC Secures Historic $2.5 Billion Settlement Against Amazon, Sept. 2025)
- more than $845 million in redress payments had been issued by Amazon to consumers under the Prime settlement as of September 2026. (Federal Trade Commission, FTC Announces Additional Payments to Consumers Stemming from FTC's Amazon Prime Settlement, As of Sept. 2026)
- more than $15.8 million is being returned to 2,124,796 Cleo AI customers over deceptive cash advance claims and hard-to-cancel subscriptions. (Federal Trade Commission, FTC Returns More than $15.8 Million to Consumers Misled by Cash Advance App Company Cleo AI, Oct. 2026)
- 15 to 45 days before the cancellation deadline is the window New York requires for renewal notices on paid terms of one year or longer. (New York State Senate, New York General Business Law Section 527-A (automatic renewal), Current law (revised Nov. 7, 2025))
- 5 to 30 days before a free trial longer than 30 days ends, Minnesota's 2024 automatic renewal law requires sellers to notify consumers. (Minnesota Office of the Revisor of Statutes, Minnesota Statutes 325G.57 (automatic renewal and continuous service), Current law (2024 c 114))
- 12 to 36 months is the typical contractual subscription period for Salesforce customers, who are generally invoiced in advance in annual installments. (Salesforce, Inc. (filed with the U.S. SEC), Salesforce, Inc. Form 10-K for fiscal year ended January 31, 2026, FY2026 (year ended Jan. 31, 2026))
- 8.6% is the average value erosion, the gap between expected and actual contract results, in World Commerce & Contracting research on contract management. (World Commerce & Contracting, Contract Management: An Overlooked Driver of Business Agility and Financial Performance, Aug. 2025)
- only 15% of organizations run shared contracting technology between their Legal and Procurement teams, World Commerce & Contracting reported in January 2026. (World Commerce & Contracting, Contracting: The Overlooked Source of Procurement Value, Jan. 2026)
| Date | Milestone | Detail |
|---|---|---|
| Apr. 24, 2023 | Proposed rule published | Extend the 1973 rule to all negative option marketing in all media |
| June 23, 2023 | Comment period closed | More than 16,000 comments; 1,162 unique comments published |
| Jan. 16, 2024 | Informal hearing before an ALJ begins | FTC estimated 106,000 entities offer negative option features |
| Nov. 15, 2024 | Final rule published | Adopted by a 3-2 Commission vote |
| Jan. 14, 2025 | Rule effective date | Original compliance date May 14, 2025 |
| May 9, 2025 | Compliance deferred | Compliance deadline moved to July 14, 2025 |
| July 8, 2025 | Eighth Circuit vacates rule | Court found the FTC skipped a required preliminary regulatory analysis |
| Mar. 13, 2026 | New advance notice of proposed rulemaking published | Comments due Apr. 13, 2026; complaints rose to more than 90 per day in 2025 |
SaaS Security and Data Breach Statistics
A growing share of breaches runs through vendors and their cloud accounts. These figures show how often that happens and what breaches cost.
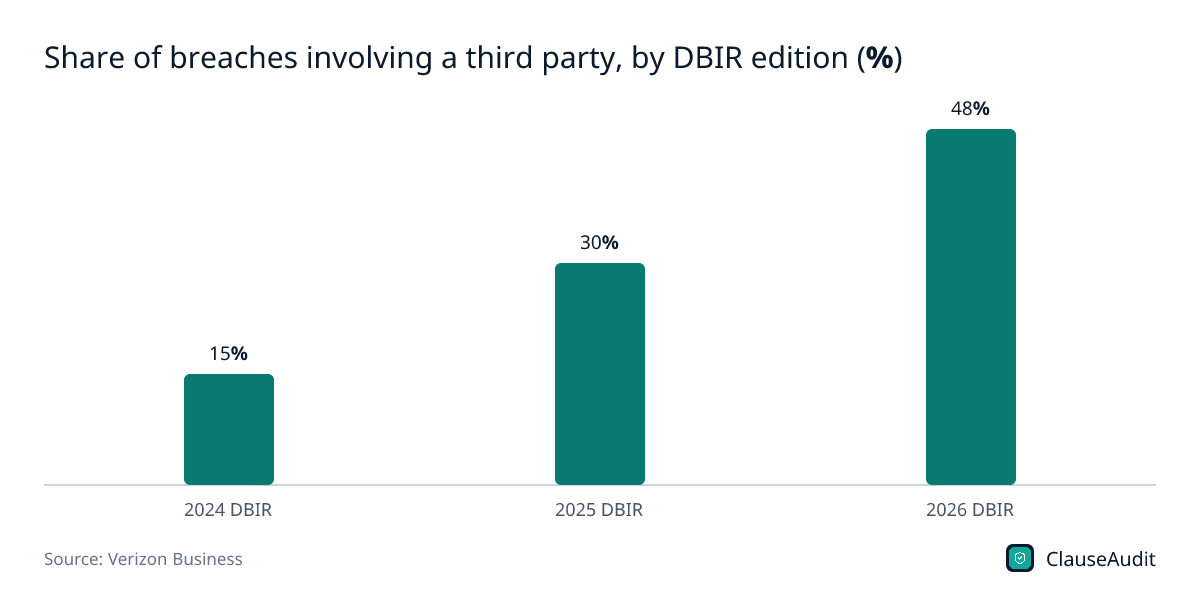
- 48% 48% of data breaches involved a third party such as a vendor or software supplier, up 60% from the prior year's dataset. (Verizon Business, 2026 Data Breach Investigations Report, Executive Summary (19th edition), 2026 DBIR)
- 30% In the 2025 DBIR, the share of breaches where a third party was involved doubled from 15% to 30%. (Verizon Business, 2025 Data Breach Investigations Report, Executive Summary, 2025 DBIR)
- 23% Only 23% of third-party organizations fully fixed missing or improperly secured multifactor authentication on their cloud accounts. (Verizon Business, 2026 Data Breach Investigations Report, Executive Summary (19th edition), 2026 DBIR)
- 31% Exploited vulnerabilities became the most common initial access vector at 31% of breaches, while credential abuse fell to 13%. (Verizon Business, 2026 Data Breach Investigations Report, Executive Summary (19th edition), 2026 DBIR)
- $10.22 million was the average cost of a U.S. data breach in IBM's 2025 Cost of a Data Breach Report; the 2026 press release gives no U.S. figure. (IBM, IBM Report: 13% Of Organizations Reported Breaches Of AI Models Or Applications (Cost of a Data Breach Report 2025 press release), 2025 report)
- $4.99 million was the global average cost of a data breach in IBM's 2026 Cost of a Data Breach Report, based on breaches at 602 organizations. (IBM, IBM Study: One in Four Malicious Breaches are AI-Enabled, Costing Companies $6 Million on Average (Cost of a Data Breach Report 2026 press release), 2026 report (July 29, 2026))
- $670,000 higher breach costs, on average, hit organizations with high levels of shadow AI in IBM's 2025 Cost of a Data Breach Report. (IBM, IBM Report: 13% Of Organizations Reported Breaches Of AI Models Or Applications (Cost of a Data Breach Report 2025 press release), 2025 report)
- 75% 75% of organizations had a SaaS security incident in the past 12 months, a 33% increase from 2024. (AppOmni, State of SaaS Security Report 2025, 2025 report)
- 15% of UK businesses reviewed the cyber risks posed by their immediate suppliers in the 2025/2026 survey, and 6% looked at their wider supply chain. (UK Department for Science, Innovation and Technology, Cyber Security Breaches Survey 2025/2026, 2025/2026 survey (published Apr. 30, 2026))
- 73% 73% of organizations had at least one confirmed data loss incident in the past 24 months, and only 16% said DLP blocked their most significant incident. (Cloud Security Alliance, New Cloud Security Alliance Survey Finds Data Loss Prevention (DLP) Often Detects Data Loss Only After It Happens, Survey June to July 2026)
- 165 In 2024, Mandiant and Snowflake notified about 165 potentially exposed organizations after attackers used stolen credentials on accounts without multi-factor authentication. (Mandiant, Google Cloud, UNC5537 Targets Snowflake Customer Instances for Data Theft and Extortion, June 2024)
- 54% 54% of data stored in the cloud is sensitive, up from 47% the year before. (Thales, 2025 Thales Cloud Security Study, 2025 study)
- $3.05 billion Victims reported $3.05 billion in business email compromise losses to the FBI in 2025, out of $20.877 billion in total reported losses. (FBI Internet Crime Complaint Center (IC3), Federal Bureau of Investigation Internet Crime Report 2025, 2025)
Figure 8: Share of breaches involving a third party, by DBIR edition (%)
Chart data
| Label | Value (%) |
|---|---|
| 2024 DBIR | 15% |
| 2025 DBIR | 30% |
| 2026 DBIR | 48% |
AI in SaaS Statistics
AI now takes a large share of venture funding, and spending on AI-native apps more than doubled in Zylo's data. The numbers below cover enterprise AI spend, adoption by developers and how budgets are shifting.
- 108% year-over-year jump in spending on AI-native apps, with large enterprises up 393% in a single year, per Zylo customer data. (Zylo, 2026 SaaS Management Index (8th edition), 2026 edition)
- $37 billion was spent by companies on generative AI in 2025, up from $11.5 billion in 2024, according to Menlo Ventures estimates. (Menlo Ventures, 2025: The State of Generative AI in the Enterprise, 2025)
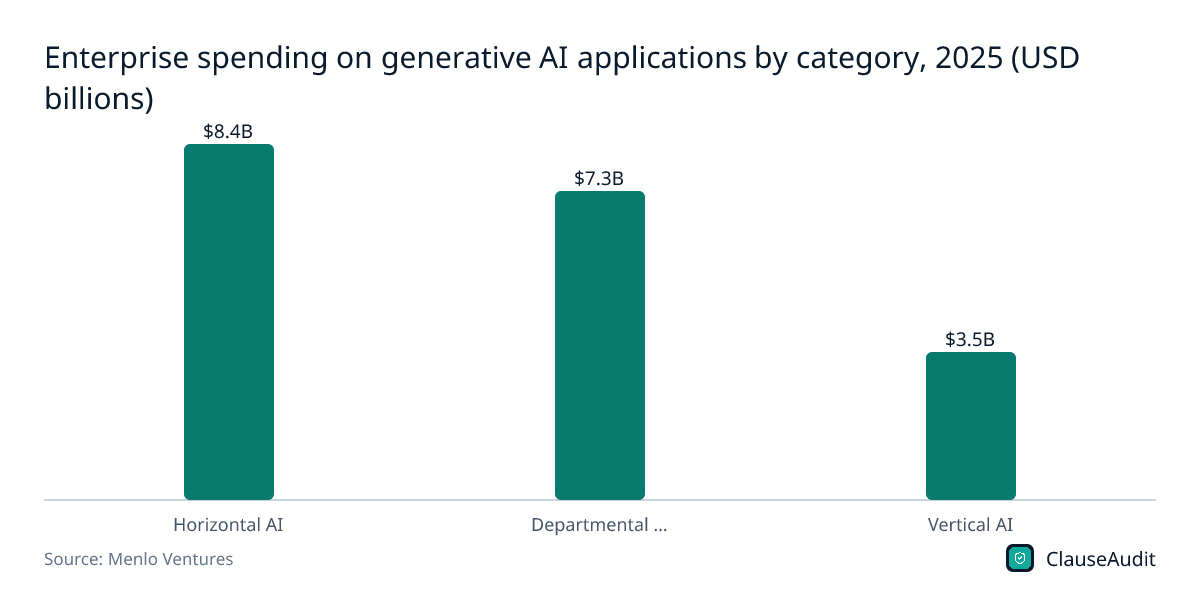
- $19 billion of 2025 enterprise generative AI spending went to the application layer, more than half of the total, per Menlo Ventures. (Menlo Ventures, 2025: The State of Generative AI in the Enterprise, 2025)
- 76% of enterprise AI use cases are now purchased rather than built internally, from a Menlo Ventures survey of 495 U.S. enterprise AI decision-makers. (Menlo Ventures, 2025: The State of Generative AI in the Enterprise, 2025)
- $4.0 billion was spent by enterprises on AI coding tools in 2025, the largest departmental AI category, per Menlo Ventures estimates. (Menlo Ventures, 2025: The State of Generative AI in the Enterprise, 2025)
- $285.9 billion in U.S. private AI investment in 2025, according to the Stanford HAI 2026 AI Index report. (Stanford Institute for Human-Centered Artificial Intelligence (HAI), The 2026 AI Index Report, 2025)
- 64% of global venture funding in Q3 2026, or $102 billion, went to AI-driven startups across the stack, per Crunchbase data. (Crunchbase News, Global venture funding, Q3 2026, Q3 2026)
- 84% of developers responding to the 2025 Stack Overflow survey were using or planning to use AI tools in development, up from 76% in 2024. (Stack Overflow, 2025 Stack Overflow Developer Survey: AI, 2025)
- 73% of respondents to Stack Overflow's 2026 Developer Survey use coding assistants and agents daily. (Stack Overflow, 2026 Stack Overflow Developer Survey: AI, 2026)
- 46% of developers actively distrusted the accuracy of AI tools in 2025, versus 33% who trusted it, per Stack Overflow. (Stack Overflow, 2025 Stack Overflow Developer Survey: AI, 2025)
- Nearly 80% of new developers on GitHub use GitHub Copilot within their first week, according to GitHub’s 2025 Octoverse report. (GitHub, Octoverse: A new developer joins GitHub every second as AI leads TypeScript to #1, 2025)
- 10-20% of R&D budgets is being allocated to AI development by AI-enabled software companies, per ICONIQ’s April 2025 survey of 300 executives. (ICONIQ, 2025 State of AI Report: The Builder's Playbook, April 2025 survey)
Figure 9: Enterprise spending on generative AI applications by category, 2025 (USD billions)
Chart data
| Label | Value (USD billions) |
|---|---|
| Horizontal AI | $8.4B |
| Departmental AI | $7.3B |
| Vertical AI | $3.5B |
SaaS Growth, Churn and Net Revenue Retention Benchmarks
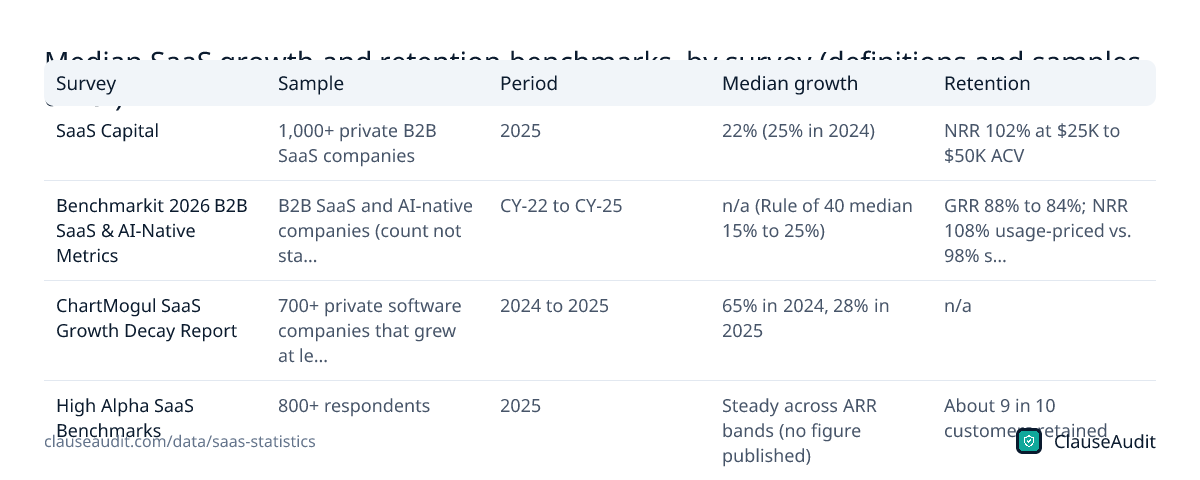
Growth slowed for many private SaaS companies in 2025 while median net revenue retention held near 100%. Survey samples and definitions differ, so compare figures within the same source.
- 22% was the median 2025 growth rate across more than 1,000 private B2B SaaS companies in SaaS Capital's survey, down from 25% in 2024. (SaaS Capital, Private SaaS Company Growth Rate Benchmarks (15th annual survey), 2025)
- 20% was the median 2025 growth rate for bootstrapped private SaaS companies in SaaS Capital's survey, versus 25% for equity-backed companies. (SaaS Capital, Private SaaS Company Growth Rate Benchmarks (15th annual survey), 2025)
- 102% is the median net revenue retention for private B2B SaaS companies with annual contract values of $25,000 to $50,000, per SaaS Capital. (SaaS Capital, SaaS Retention Benchmarks for Private B2B Companies, 2025 edition)
- 108% vs. 98% was net revenue retention for usage-priced versus seat-priced companies in Benchmarkit's 2026 benchmarks, a 10-point gap. (Benchmarkit, 2026 B2B SaaS & AI-Native Metrics, 2026 report)
- 88% to 84% is how far median gross revenue retention fell in Benchmarkit's 2026 B2B SaaS & AI-Native Metrics (CY-22 to CY-25 data); the 75th percentile fell from 95% to 91%. (Benchmarkit, 2026 B2B SaaS & AI-Native Metrics, CY-22 to CY-25 (2026 report))
- 15% to 25% is how far the median Rule of 40 score rose in Benchmarkit's 2026 benchmarks, its largest single-year gain in five years. (Benchmarkit, 2026 B2B SaaS & AI-Native Metrics, 2026 report)
- $175,000 was median ARR per employee in Benchmarkit's 2026 B2B SaaS benchmarks, up 17% year on year. (Benchmarkit, 2026 B2B SaaS & AI-Native Metrics, 2026 report)
- 65% to 28% is how growth fell from 2024 to 2025 for the median company in ChartMogul's set of 700+ private software firms that grew at least 20% in 2024. (ChartMogul, The SaaS Growth Decay Report, 2024 to 2025)
- 18% of private software companies that grew at least 20% in 2024 maintained or improved their growth rate in 2025, ChartMogul found. (ChartMogul, The SaaS Growth Decay Report, 2024 to 2025)
- 8% was the median free-to-paid conversion rate across 200 software products in ChartMogul's January 2026 survey, with a 10x top-to-bottom gap. (ChartMogul, The Conversion Report, Jan. 2026)
- 30% free-to-paid conversion is what free trials requiring a credit card achieve, more than five times trials without one, per ChartMogul's 2026 survey. (ChartMogul, The Conversion Report, Jan. 2026)
- roughly 60% of new ARR at SaaS companies above $50 million ARR comes from existing customers, High Alpha's survey of 800+ respondents found. (High Alpha, 2025 SaaS Benchmarks Report (ninth annual), 2025)
- approximately eight percent was Salesforce's annual revenue attrition rate as of January 31, 2026, excluding Slack self-service and current-year acquisitions. (Salesforce, Inc. (filed with the U.S. SEC), Salesforce, Inc. Form 10-K for fiscal year ended January 31, 2026, As of Jan. 31, 2026)
| Survey | Sample | Period | Median growth | Retention |
|---|---|---|---|---|
| SaaS Capital | 1,000+ private B2B SaaS companies | 2025 | 22% (25% in 2024) | NRR 102% at $25K to $50K ACV |
| Benchmarkit 2026 B2B SaaS & AI-Native Metrics | B2B SaaS and AI-native companies (count not stated) | CY-22 to CY-25 | n/a (Rule of 40 median 15% to 25%) | GRR 88% to 84%; NRR 108% usage-priced vs. 98% seat-priced |
| ChartMogul SaaS Growth Decay Report | 700+ private software companies that grew at least 20% in 2024 | 2024 to 2025 | 65% in 2024, 28% in 2025 | n/a |
| High Alpha SaaS Benchmarks | 800+ respondents | 2025 | Steady across ARR bands (no figure published) | About 9 in 10 customers retained |
| Salesforce Form 10-K | Single public company | FY2026 | n/a | Attrition about 8% |
SaaS Funding, M&A and Valuation Statistics
Venture money in 2026 has gone heavily to AI companies, and the largest SaaS acquisitions listed here were in security and data. These figures cover funding, valuations and major acquisitions.
- $515.8 billion U.S. venture deal value reached $515.8 billion through Q3 2026, roughly 44% above the previous full-year record set in 2021. (National Venture Capital Association and PitchBook, Q3 2026 PitchBook-NVCA Venture Monitor, Jan. to Sept. 2026)
- 82.7% AI companies accounted for 82.7% of U.S. venture deal value through the third quarter of 2026. (National Venture Capital Association and PitchBook, Q3 2026 PitchBook-NVCA Venture Monitor, Jan. to Sept. 2026)
- $98.4 billion U.S. venture investment totaled $98.4 billion across an estimated 5,012 deals in the third quarter of 2026. (National Venture Capital Association and PitchBook, Q3 2026 PitchBook-NVCA Venture Monitor, Q3 2026)
- $159 billion Global venture funding totaled $159 billion in Q3 2026, up 53% from $104 billion in Q3 2025. (Crunchbase News, Global venture funding, Q3 2026, Q3 2026)
- $7.5 billion Sales, marketing and CRM software startups raised $7.5 billion globally across 830 rounds in 2026 so far, versus nearly $41 billion in 2021. (Crunchbase News, Sector Snapshot: AI Takes A Growing Share Of Sales And Marketing Startup Funding, 2026 year to date (mid-Sept.))
- $4.6 billion Legal tech startups, including contract review and AI legal software, raised a record $4.6 billion in 2025. (Crunchbase News, Sector Snapshot: Legal Tech Funding Down Slightly From All-Time High, 2025)
- 8.0x The 65 public cloud software companies in the BVP Nasdaq Emerging Cloud Index traded at an index-level 8.0x enterprise value to revenue on Oct. 16, 2026. (Bessemer Venture Partners, BVP Nasdaq Emerging Cloud Index data file, Oct. 16, 2026)
- $2.5 trillion Companies in the BVP Nasdaq Emerging Cloud Index had a combined market capitalization of about $2.5 trillion as of Oct. 16, 2026. (Bessemer Venture Partners, BVP Nasdaq Emerging Cloud Index data file, Oct. 16, 2026)
- $32 billion Google agreed to buy cloud security platform Wiz for $32 billion in an all-cash deal, subject to closing adjustments and regulatory approvals. (Google, Google signs agreement to acquire Wiz, March 18, 2025)
- $25 billion Palo Alto Networks agreed to acquire identity security vendor CyberArk at an equity value of about $25 billion. (Palo Alto Networks, Palo Alto Networks Announces Agreement to Acquire CyberArk, the Identity Security Leader, July 30, 2025)
- $11 billion IBM agreed to acquire data streaming platform Confluent for $31 per share in cash, an enterprise value of $11 billion. (IBM, IBM to Acquire Confluent to Create Smart Data Platform for Enterprise Generative AI, Dec. 8, 2025)
- $8 billion Salesforce agreed to buy data management company Informatica for about $8 billion in equity value, or $25 per share in cash. (Salesforce, Salesforce Signs Definitive Agreement to Acquire Informatica, May 27, 2025)
- $6.3 billion Proofpoint agreed to acquire data security software maker Varonis for about $6.3 billion in cash, a 52% premium to its June 22, 2026 close. (Thoma Bravo, Proofpoint to Acquire Varonis in a $6.3 Billion Transaction, Oct. 15, 2026)
| Announced | Buyer | Target | Deal value | Terms |
|---|---|---|---|---|
| Mar. 18, 2025 | Wiz | $32 billion | All cash, subject to closing adjustments | |
| July 30, 2025 | Palo Alto Networks | CyberArk | About $25 billion (equity value) | $45.00 cash plus 2.2005 PANW shares per share |
| Dec. 8, 2025 | IBM | Confluent | $11 billion (enterprise value) | $31 per share in cash |
| May 27, 2025 | Salesforce | Informatica | About $8 billion (equity value) | $25 per share in cash |
| Oct. 15, 2026 | Proofpoint | Varonis | About $6.3 billion | $49.75 per share in cash; expected to close in first half of 2027 |
India SaaS Market and SaaS Workforce Statistics
India is a growing source of SaaS companies and developers, and the U.S. software workforce is projected to keep expanding. This section covers both.
- About 1.5x growth in Indian venture funding for software and SaaS companies in 2025 compared with 2024, according to Bain & Company. (Bain & Company, India Venture Capital Report 2026, 2025)
- About $16 billion in venture capital and growth equity was invested in India in 2025, the market that funds the country’s SaaS startups, per Bain. (Bain & Company, India Venture Capital Report 2026, 2025)
- USD 20 billion is the size of India’s domestic software market in 2025, a market dominated by multinationals, per 1Lattice and SaaSBoomi. (1Lattice (with SaaSBoomi), Beyond the Valley: Unlocking India’s US$ 100B Domestic Software Opportunity 2035, 2025)
- USD 100 billion is the projected size of India’s domestic software market by 2035, about five times its 2025 size (forecast). (1Lattice (with SaaSBoomi), Beyond the Valley: Unlocking India’s US$ 100B Domestic Software Opportunity 2035, 2035 (forecast made March 2025))
- About 80% of software spend in India is controlled by large enterprises, with medium-size companies and SMEs accounting for the rest. (1Lattice (with SaaSBoomi), Beyond the Valley: Unlocking India’s US$ 100B Domestic Software Opportunity 2035, 2025)
- 50 to 60 new Indian software companies with more than $50 million ARR could be built over the next decade, according to SaaSBoomi (projection). (SaaSBoomi, India’s $100B Domestic Software Opportunity: Why the Next Decade Demands a New Revolution, Next decade (projection made March 2025))
- More than 5.2 million developers joined GitHub from India in 2025, a little over 14% of the more than 36 million new developers worldwide. (GitHub, Octoverse: A new developer joins GitHub every second as AI leads TypeScript to #1, 2025)
- 57.5 million developers in India on GitHub by 2030 is GitHub’s Octoverse projection, extending India’s lead in new developer growth (forecast). (GitHub, Octoverse: A new developer joins GitHub every second as AI leads TypeScript to #1, 2030 (forecast made 2025))
- US$ 35.5 billion in Indian services exports in August 2026 (preliminary; all services, not software only), up from US$ 31.2 billion a year earlier. (Reserve Bank of India, Developments in India's Balance of Payments for the Month of August 2026, August 2026)
- 10 percent projected growth in U.S. employment of software developers, QA analysts and testers from 2025 to 2035, per the BLS Occupational Outlook Handbook. (U.S. Bureau of Labor Statistics, Occupational Outlook Handbook: Software Developers, Quality Assurance Analysts, and Testers, 2025 to 2035 (projection))
- 106,100 openings a year are projected on average for U.S. software developers, quality assurance analysts and testers over the 2025 to 2035 decade. (U.S. Bureau of Labor Statistics, Occupational Outlook Handbook: Software Developers, Quality Assurance Analysts, and Testers, 2025 to 2035 (projection))
- $135,980 was the median annual wage for U.S. software developers in May 2025. (U.S. Bureau of Labor Statistics, Occupational Outlook Handbook: Software Developers, Quality Assurance Analysts, and Testers, May 2025)
- 652.9 thousand people were employed by U.S. software publishers in August 2026 (seasonally adjusted, preliminary), down from 661.4 thousand in September 2025. (U.S. Bureau of Labor Statistics, All employees, software publishers, seasonally adjusted (CES5051320001), August 2026 (preliminary))
| Occupation | Jobs, 2025 | Projected jobs, 2035 | Change, 2025-35 | Median annual wage, May 2025 |
|---|---|---|---|---|
| Software developers (15-1252) | 1,717,800 | 1,892,600 | +10% (174,700) | $135,980 |
| Software QA analysts and testers (15-1253) | 187,600 | 198,200 | +6% (10,600) | $104,300 |
| Combined | 1,905,400 | 2,090,800 | +10% (185,400) | $134,040 |
What the numbers mean for businesses buying SaaS
SaaS is now a large fixed cost, and it keeps rising. Vertice puts SaaS spend at about $9,100 per employee at the end of 2025, up from $7,900 in 2023, and estimates that $1 in every $8 of a typical organization's spending now goes to SaaS. Zylo's data shows the average company running 305 applications and handling 211 renewals a year, roughly four every week.
Much of that spend is idle. Average license utilization was 54% in 2025, so close to half of paid seats went unused, and Zylo customers wasted an average of $19.8 million a year on unused licenses. The cost of not watching is real: 61% of IT leaders said they cut projects in the past year because of unplanned SaaS cost increases, and 8% of organizations told Flexera they do not track SaaS costs at all.
The practical step is to treat each renewal as a decision rather than a default. Check seat counts against actual use before the notice deadline, and make sure the contract lets you reduce seats at renewal instead of only adding them.
Price increases and new pricing models
Official price data and vendor data tell different stories. The U.S. producer price index for software publishers rose 2.4% in the year to September 2026, below 3.7% consumer inflation. Vertice, using its own customer data, reports SaaS inflation of 13.2% and says 60% of vendors mask their price rises.
Pricing is also moving away from flat per-seat fees. 85% of SaaS companies in Metronome's January 2025 survey had adopted usage-based pricing, and 78% of IT leaders reported unexpected charges tied to AI features or consumption pricing in the past year. List price changes add up too: Salesforce raised Enterprise and Unlimited Edition prices by an average of 6% in August 2025, and Google Workspace Business Standard with Gemini costs $2 more per user per month than the plan without it.
If a contract allows price increases at renewal, ask for a fixed cap in writing. For usage-based plans, ask for spending alerts, a monthly ceiling and a clear rate card for overages.
Vendor risk, renewals and what to check
Your vendor's security is part of your security. Verizon's 2026 DBIR found that 48% of breaches involved a third party, up from 15% two editions earlier, and only 23% of third parties fully fixed weak multifactor authentication on their cloud accounts. IBM put the global average cost of a breach at $4.99 million in 2026. Compare the contract's liability cap with that figure, and read it together with the security commitments and the breach notice terms.
Cancellation rules are less settled than many buyers assume. The Eighth Circuit vacated the FTC's click-to-cancel rule on July 8, 2025, although the FTC still pursues hard-to-cancel subscriptions, as the $2.5 billion Amazon Prime settlement shows. State laws such as New York's require renewal notices 15 to 45 days before the cancellation deadline on paid terms of one year or longer. Whether or not a state law covers your agreement, the contract sets the notice windows you have to meet, so note each one before you sign.
Check your SaaS agreement before you sign or renew
The figures on this page point to a few clauses that decide what SaaS really costs you: renewal terms, price increase rights, usage charges and how much the vendor owes you if your data is lost. An automated review of your agreement flags those clauses and explains them in plain English, so you know what to ask the vendor to change.
- Auto-renewal terms and how many days' notice you must give to cancel
- Price increase rights at renewal and whether there is a written cap
- Usage-based or AI feature charges, overage rates and spending limits
- Who owns your data and whether the vendor can use it to train AI models
- The liability cap compared with the cost of a data breach
- Security commitments, breach notice timing and uptime SLA credits
- Whether the vendor can change the terms by notice or continued use
- Data export and deletion when the contract ends
Frequently asked questions
How big is the SaaS market in 2026?
Estimates differ by source. Statista projects worldwide SaaS revenue of US$488.53 billion in 2026 and Mordor Intelligence estimates USD 435.41 billion. Gartner forecasts total worldwide software spending of $1,468 billion in 2026, up 15.5% from 2025.
How many SaaS apps does the average company use?
Zylo's 2026 SaaS Management Index puts the average at 305 applications and the median at 240. Torii, which counts apps found through discovery including unsanctioned ones, found 831 at the average organization, and 61.3% of those were shadow IT.
How much do companies waste on unused SaaS licenses?
Zylo customers wasted an average of $19.8 million a year on unused SaaS licenses, down 5.3% from $20.9 million. Average license utilization rose to 54% in 2025 from 47% in 2024, so nearly half of paid licenses still went unused.
How much do SaaS prices go up each year?
It depends on the measure. The U.S. producer price index for software publishers rose 2.4% in the year to September 2026, while Vertice reports SaaS inflation of 13.2% from its customer data. Salesforce raised some edition list prices by an average of 6% in August 2025.
What is a typical net revenue retention rate for SaaS companies?
SaaS Capital reports a median net revenue retention of 102% for private B2B SaaS companies with annual contract values of $25,000 to $50,000. Benchmarkit found usage-priced companies at 108% against 98% for seat-priced companies in its 2026 report.
How often are vendors involved in data breaches?
Verizon's 2026 Data Breach Investigations Report found that 48% of breaches involved a third party such as a vendor or software supplier. In the 2025 edition the figure was 30%, double the 15% of the year before.
Is the FTC click-to-cancel rule in effect?
No. The U.S. Court of Appeals for the Eighth Circuit vacated the rule in full on July 8, 2025, on procedural grounds. The FTC said negative option complaints reached more than 90 per day in 2025, and state auto-renewal laws still apply.
Use this data
Every chart and card below is free to reuse under CC BY 4.0. Download what you need and link back to this page.
 Stat cards
 Key findings card
 Infographic
 Estimates of the 2026 global SaaS market, by research firm (billions of USD)
 Average SaaS apps per organization by company size (Torii 2026 SaaS Benchmark)
 U.S. private investment in software, 2016 to 2025 (billions of USD)
 SaaS cost per employee, 2023 to 2025 (USD per employee)
 Share of breaches involving a third party, by DBIR edition (%)
 Contracted future revenue (remaining performance obligations) at major SaaS companies, latest reported (USD billions)
 Enterprise spending on generative AI applications by category, 2025 (USD billions)
 Timeline of the FTC negative option (click-to-cancel) rule
 Median SaaS growth and retention benchmarks, by survey (definitions and samples differ)
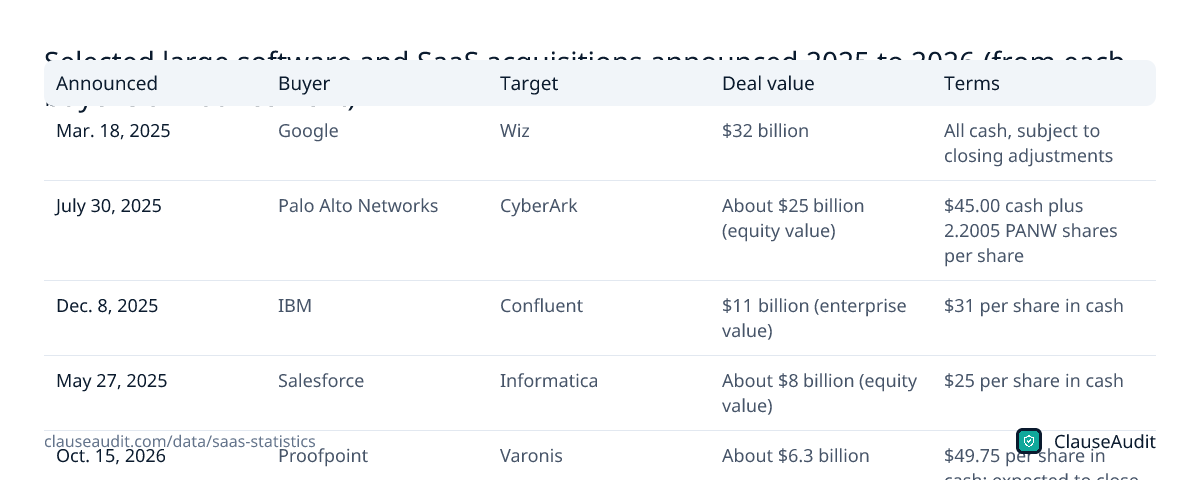 Selected large software and SaaS acquisitions announced 2025 to 2026 (from each buyer's announcement)
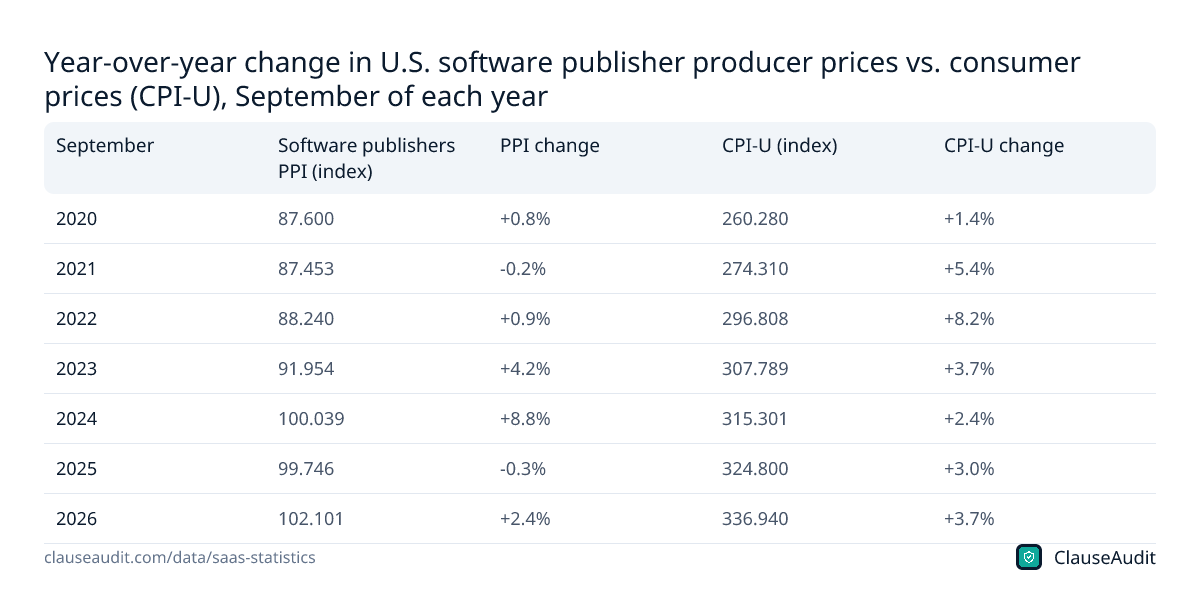 Year-over-year change in U.S. software publisher producer prices vs. consumer prices (CPI-U), September of each year
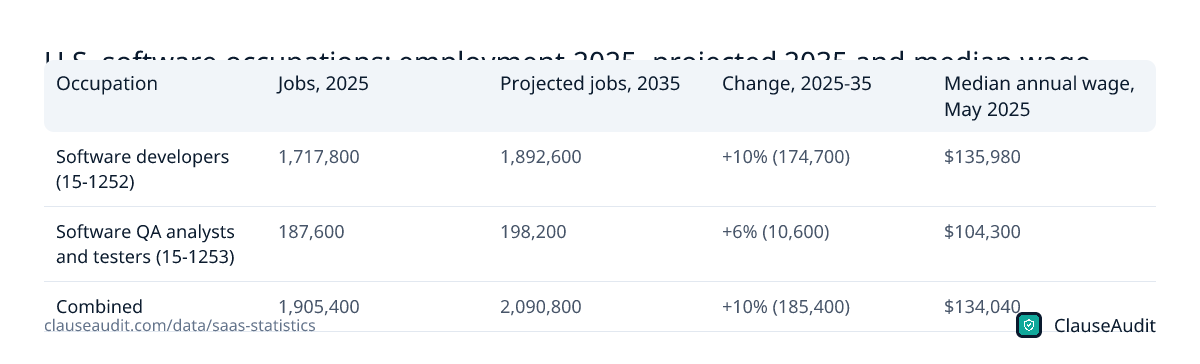 U.S. software occupations: employment 2025, projected 2035 and median wage (BLS)
Embed the infographic
Free to share on your site, blog or slides under CC BY 4.0. Please keep the credit link.
Sources and method
Every number on this page comes from the sources below, each opened and read on or before October 17, 2026. A second, independent review checked every figure against its source and corrected anything that did not match. Figures that could not be confirmed were left out.
- Australian Bureau of Statistics, Characteristics of Australian Business, 2024-25 (June 25, 2026)
- BetterCloud, The State of SaaS 2026 (2026 edition)
- U.S. Court of Appeals for the Eighth Circuit, Custom Communications, Inc. v. Federal Trade Commission, No. 24-3137 (opinion) (Filed July 8, 2025)
- ChartMogul, The Conversion Report (Feb. 4, 2026)
- ChartMogul, The SaaS Growth Decay Report (Apr. 15, 2026)
- Eurostat (European Commission), Cloud computing - statistics on the use by enterprises (2025 data)
- Fortune Business Insights, Software as a Service (SaaS) Market Size, Share and Industry Analysis (2026 edition (base year 2025))
- Federal Trade Commission, Federal Register (via GovInfo), Rule Concerning the Use of Prenotification Negative Option Plans (advance notice of proposed rulemaking), 91 FR 12318 (Mar. 13, 2026)
- Federal Trade Commission, Federal Register (via GovInfo), Negative Option Rule (final rule), 89 FR 90476 (Nov. 15, 2024)
- Federal Trade Commission, FTC Announces Additional Payments to Consumers Stemming from FTC's Amazon Prime Settlement (Sept. 17, 2026)
- Federal Trade Commission, FTC Secures Historic $2.5 Billion Settlement Against Amazon (Sept. 25, 2025)
- Federal Trade Commission, FTC Returns More than $15.8 Million to Consumers Misled by Cash Advance App Company Cleo AI (Oct. 8, 2026)
- Gartner, Inc., Gartner Forecasts Australian Organizations Will Spend More Than A$33 Billion on Public Cloud in 2026 (May 11, 2026)
- Gartner, Inc., Gartner Forecasts Worldwide IT Spending to Grow 14.2% in 2026, Totaling $6.37 Trillion (July 27, 2026)
- Gartner, Inc., Gartner Forecasts Worldwide Public Cloud End-User Spending to Total $723 Billion in 2025 (Nov. 19, 2024)
- Grand View Research, Software as a Service Market Size, Share and Trends Analysis Report (2026 edition (base year 2025))
- High Alpha, 2025 SaaS Benchmarks Report (ninth annual) (2025 (page shows no exact date))
- Minnesota Office of the Revisor of Statutes, Minnesota Statutes 325G.57 (automatic renewal and continuous service) (2024 c 114 art 3 s 56)
- Mordor Intelligence, Software as a Service (SaaS) Market Size and Share Analysis (2026 edition (forecast 2026 to 2031))
- New York State Senate, New York General Business Law Section 527-A (automatic renewal) (Revised Nov. 7, 2025)
- Okta, Inc., Businesses at Work 2026 press release (Japanese) (Apr. 30, 2026 (data Nov. 1, 2024 to Oct. 31, 2025))
- Precedence Research, Software as a Service (SaaS) Market Size (2026 edition (base year 2025))
- SaaS Capital, Private SaaS Company Growth Rate Benchmarks (15th annual survey) (2026 edition (2025 growth data; page shows no exact date))
- SaaS Capital, SaaS Retention Benchmarks for Private B2B Companies (Sept. 18, 2025)
- Salesforce, Inc. (filed with the U.S. SEC), Salesforce, Inc. Form 10-K for fiscal year ended January 31, 2026 (Filed March 2, 2026)
- Statista, Software as a Service - Worldwide (Market Insights outlook) (2026 (page shows no update date))
- Synergy Research Group, Annual Revenues from Key Cloud and Digital Services to Pass $5 Trillion in 2031 (Oct. 5, 2026)
- Synergy Research Group, Q2 Cloud Market Passes $143 Billion; Highest Growth Rate in Eight Years (July 30, 2026)
- Torii, Torii Research: Shadow IT Index (October 2026) (Oct. 8, 2026)
- Torii, SaaS Statistics (Torii 2026 SaaS Benchmark findings) (2026 (data January to December 2025))
- World Commerce & Contracting, Contract Management: An Overlooked Driver of Business Agility and Financial Performance (Aug. 2025)
- World Commerce & Contracting, Contracting: The Overlooked Source of Procurement Value (Jan. 23, 2026)
- Zylo, 2026 SaaS Management Index (8th edition) (2026 edition (page shows no exact date))
- U.S. Bureau of Economic Analysis, via FRED, Federal Reserve Bank of St. Louis, Private fixed investment: Nonresidential: Intellectual property products: Software (B985RC1A027NBEA), annual CSV (Updated Sept. 30, 2026)
- U.S. Bureau of Economic Analysis, via FRED, Federal Reserve Bank of St. Louis, Private fixed investment: Nonresidential: Intellectual property products: Software (B985RC1Q027SBEA), quarterly (Updated Sept. 30, 2026)
- U.S. Bureau of Economic Analysis, via FRED, Federal Reserve Bank of St. Louis, Real private fixed investment: Intellectual property products: Software (B985RX1A020NBEA) (Updated Sept. 30, 2026)
- U.S. Census Bureau, Quarterly Selected Services Estimates, Second Quarter 2026 (Release CB26-146) (September 9, 2026)
- U.S. Bureau of Labor Statistics, Employment Projections Table 2.11: Employment and output by industry, 2025 and projected 2035 (2025-35 projections)
- U.S. Bureau of Labor Statistics, Occupational Outlook Handbook: Software Developers, Quality Assurance Analysts, and Testers (2025-35 edition)
- U.S. Office of Management and Budget, IT Dashboard, Federal IT Dashboard home page (FY2025 IT Spending) (Accessed Oct. 17, 2026)
- FedRAMP, U.S. General Services Administration, FedRAMP home page (certified services counter) (Accessed Oct. 17, 2026)
- Zylo, SaaS Statistics (figures from Zylo's 2026 SaaS Management Index) (Updated February 8, 2026)
- Flexera, Flexera 2026 State of the Cloud Report (2026 (survey of 753 respondents, winter 2025))
- Flexera, Flexera 2026 State of ITAM Report (2026 (N=512, fielded early 2026))
- Vertice, SaaS Inflation Index Report (2026 (page shows no exact date))
- CloudZero, The State Of AI Costs In 2025 (2025 (survey of 500 U.S. engineering leaders, March 2025))
- U.S. General Services Administration, GSA Expands OneGov AI Offerings with Discounted, Consumption-Based Access to OpenAI's ChatGPT (September 10, 2026)
- U.S. Government Accountability Office, Federal Software Licenses: Agencies Need to Take Action to Achieve Additional Savings (GAO-24-105717) (January 29, 2024)
- Verizon Business, 2026 Data Breach Investigations Report, Executive Summary (19th edition) (2026 edition)
- Verizon Business, 2025 Data Breach Investigations Report, Executive Summary (2025 edition)
- IBM, IBM Report: 13% Of Organizations Reported Breaches Of AI Models Or Applications (Cost of a Data Breach Report 2025 press release) (July 30, 2025)
- AppOmni, State of SaaS Security Report 2025 (2025 (803 respondents))
- Mandiant, Google Cloud, UNC5537 Targets Snowflake Customer Instances for Data Theft and Extortion (June 10, 2024)
- Cloud Security Alliance, New Cloud Security Alliance Survey Finds Data Loss Prevention (DLP) Often Detects Data Loss Only After It Happens (October 13, 2026)
- FBI Internet Crime Complaint Center (IC3), Federal Bureau of Investigation Internet Crime Report 2025 (2025 annual report)
- Thales, 2025 Thales Cloud Security Study (2025 edition)
- National Venture Capital Association and PitchBook, Q3 2026 PitchBook-NVCA Venture Monitor (Q3 2026 (October 2026))
- Crunchbase News, Global venture funding, Q3 2026 (October 5, 2026)
- Crunchbase News, Sector Snapshot: AI Takes A Growing Share Of Sales And Marketing Startup Funding (September 15, 2026)
- Crunchbase News, Sector Snapshot: Legal Tech Funding Down Slightly From All-Time High (August 26, 2026)
- Bessemer Venture Partners, BVP Nasdaq Emerging Cloud Index data file (Last updated Oct. 16, 2026)
- Google, Google signs agreement to acquire Wiz (March 18, 2025)
- Palo Alto Networks, Palo Alto Networks Announces Agreement to Acquire CyberArk, the Identity Security Leader (July 30, 2025)
- IBM, IBM to Acquire Confluent to Create Smart Data Platform for Enterprise Generative AI (December 8, 2025)
- Salesforce, Salesforce Signs Definitive Agreement to Acquire Informatica (May 27, 2025)
- Thoma Bravo, Proofpoint to Acquire Varonis in a $6.3 Billion Transaction (October 15, 2026)
- Microsoft Corporation, Microsoft Cloud and AI Strength Fuels Fourth Quarter Results (FY26 Q4 press release) (July 29, 2026)
- Salesforce, Inc., Salesforce Announces Fourth Quarter and Fiscal 2026 Results (February 25, 2026)
- Adobe Inc., Adobe Reports Record Q3 Results (Q3 FY2026 earnings press release) (September 10, 2026)
- ServiceNow, Inc., filed with the U.S. Securities and Exchange Commission, ServiceNow fourth quarter and full year 2025 financial results (Form 8-K, Exhibit 99.1) (January 28, 2026)
- Workday, Inc., filed with the U.S. Securities and Exchange Commission, Workday fiscal 2026 fourth quarter and full year financial results (Form 8-K, Exhibit 99.1) (February 24, 2026)
- Atlassian Corporation, filed with the U.S. Securities and Exchange Commission, Atlassian fourth quarter and fiscal year 2026 results (Form 8-K, Exhibit 99.1) (August 6, 2026)
- HubSpot, Inc., filed with the U.S. Securities and Exchange Commission, HubSpot fourth quarter and full year 2025 results (Form 8-K, Exhibit 99.1) (February 11, 2026)
- Shopify Inc., Shopify Delivers Big: 30%+ Growth Across GMV, Revenue, Gross Profit, and Free Cash Flow (Q2 2026 results) (August 5, 2026)
- Freshworks Inc., Freshworks Reports Record Second Quarter 2026 Results (August 4, 2026)
- U.S. Bureau of Labor Statistics, via FRED, Federal Reserve Bank of St. Louis, Producer Price Index by Industry: Software Publishers (PCU511210511210), BLS data (Updated Oct. 15, 2026 (data through Sept. 2026))
- U.S. Bureau of Labor Statistics, via FRED, Federal Reserve Bank of St. Louis, Consumer Price Index for All Urban Consumers: All Items in U.S. City Average (CPIAUCNS), BLS data (Updated Oct. 14, 2026 (data through Sept. 2026))
- U.S. Bureau of Labor Statistics, Consumer Price Index - September 2026 (news release) (October 14, 2026)
- Metronome, State of Usage-Based Pricing 2025 (2025 (survey conducted January 2025))
- ICONIQ, 2025 State of AI Report: The Builder's Playbook (2025 (survey conducted April 2025))
- Salesforce, Inc., Salesforce pricing update: Agentforce add-ons and Enterprise and Unlimited Edition list prices (June 17, 2025)
- Google Workspace (Google LLC), The best of Google AI, now included in Workspace Business and Enterprise plans (January 16, 2025 (updated April 28, 2025))
- Menlo Ventures, 2025: The State of Generative AI in the Enterprise (December 9, 2025)
- Stanford Institute for Human-Centered Artificial Intelligence (HAI), The 2026 AI Index Report (2026 edition)
- Stack Overflow, 2025 Stack Overflow Developer Survey: AI (2025)
- GitHub, Octoverse: A new developer joins GitHub every second as AI leads TypeScript to #1 (October 28, 2025 (updated February 28, 2026))
- Bain & Company, India Venture Capital Report 2026 (April 1, 2026)
- Reserve Bank of India, Developments in India's Balance of Payments for the Month of August 2026 (October 15, 2026)
- U.S. Bureau of Labor Statistics, All employees, software publishers, seasonally adjusted (CES5051320001) (Data through August 2026 (preliminary))
- 1Lattice (with SaaSBoomi), Beyond the Valley: Unlocking India’s US$ 100B Domestic Software Opportunity 2035 (March 25, 2025)
- SaaSBoomi, India’s $100B Domestic Software Opportunity: Why the Next Decade Demands a New Revolution (March 25, 2025)
- ICONIQ, 2026 State of AI Report: The Builder's Economy (July 2026 (survey fielded Q2 2026))
- IBM, IBM Study: One in Four Malicious Breaches are AI-Enabled, Costing Companies $6 Million on Average (Cost of a Data Breach Report 2026 press release) (July 29, 2026)
- UK Department for Science, Innovation and Technology, Cyber Security Breaches Survey 2025/2026 (April 30, 2026)
- Benchmarkit, 2026 B2B SaaS & AI-Native Metrics (2026 (CY-22 to CY-25 longitudinal data))
- Stack Overflow, 2026 Stack Overflow Developer Survey: AI (October 6, 2026)
Cite this page
ClauseAudit, “SaaS Statistics 2026: 150+ Numbers on Spend, Pricing, Security and Contracts”, updated October 17, 2026, https://clauseaudit.com/data/saas-statistics. Free to reuse with a link back (CC BY 4.0).
This page summarises published data and law as checked on October 17, 2026. Figures are updated as new editions are released, and your own situation may differ. It is general information, not legal, tax or financial advice.