SaaS Churn Rate Benchmarks 2026: B2B, SMB and Enterprise
By ClauseAudit Research · 3 sources ·
What is a good SaaS churn rate benchmark?
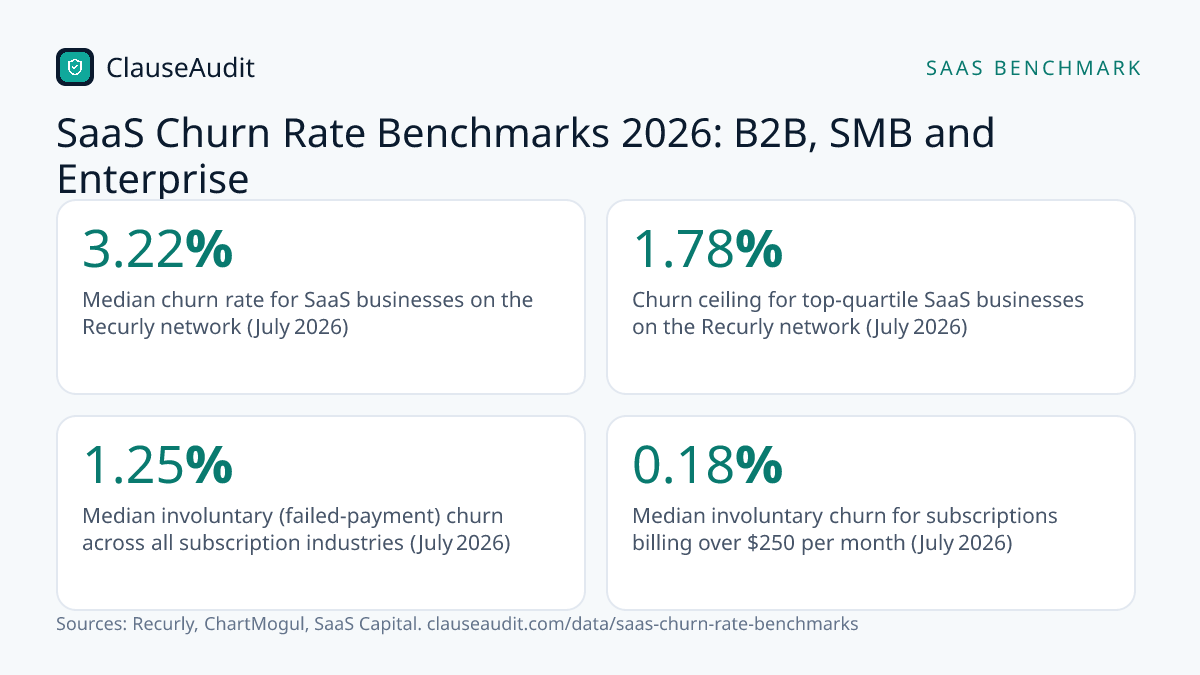
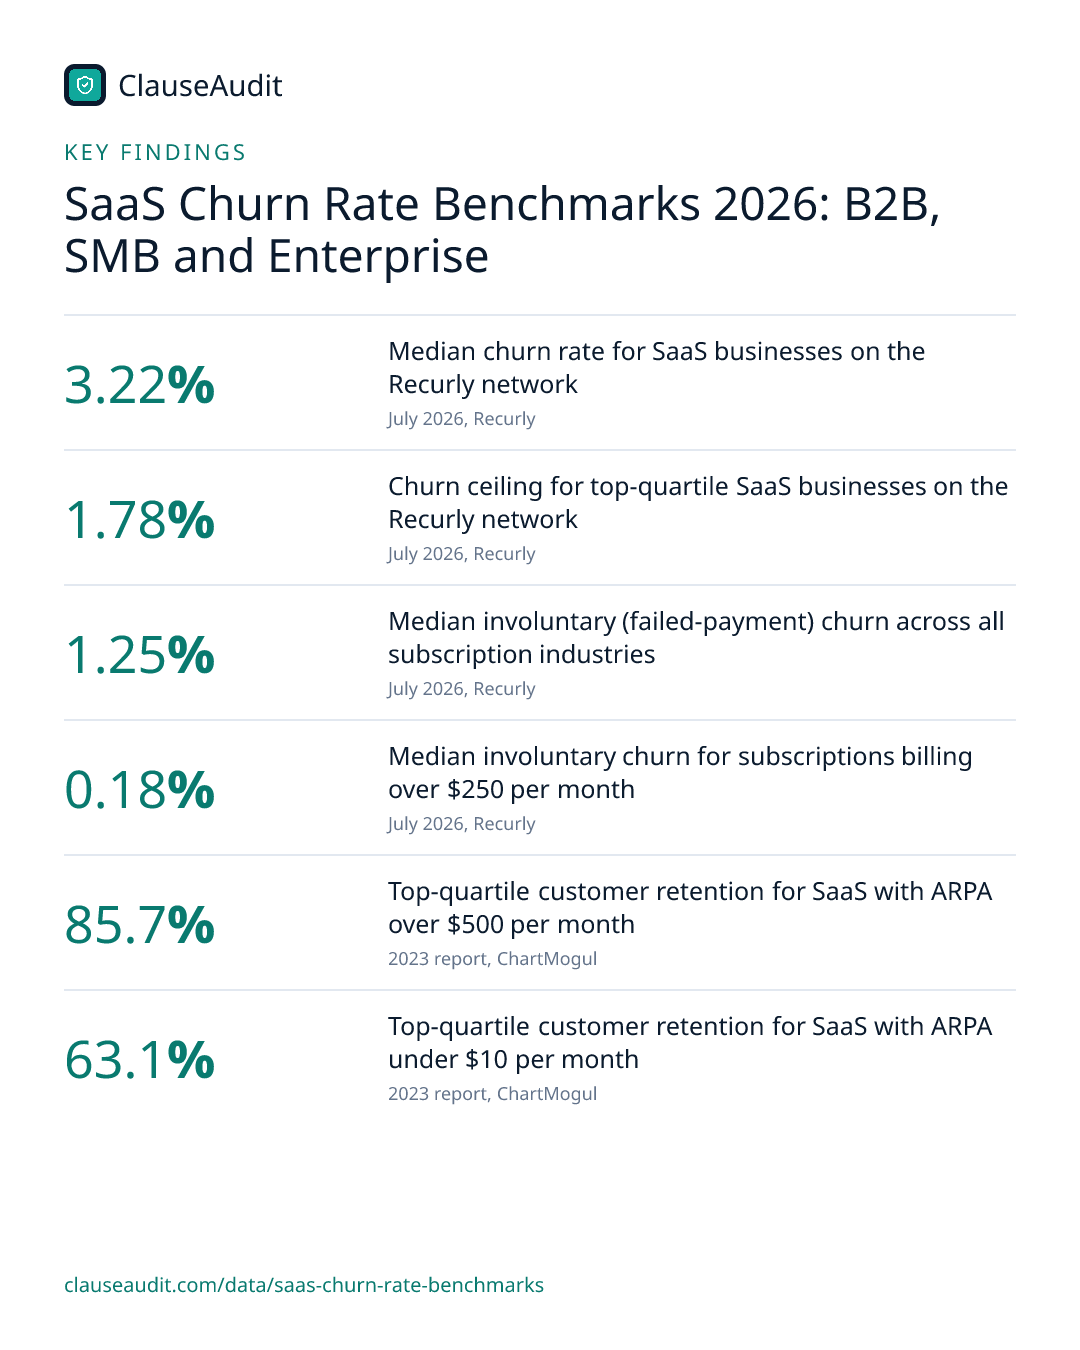
A good SaaS churn rate in 2026 is anything below 3.22%, the median for SaaS businesses on the Recurly network in July 2026. The top quartile keeps churn at 1.78% or below. Churn falls as price rises: in 2023, top-quartile B2B tools billing over $500 a month kept 85.7% of their customers.

- Median churn rate for SaaS businesses on the Recurly network (July 2026, Recurly)
- 3.22%
- Churn ceiling for top-quartile SaaS businesses on the Recurly network (July 2026, Recurly)
- 1.78%
- Median involuntary (failed-payment) churn across all subscription industries (July 2026, Recurly)
- 1.25%
- Median involuntary churn for subscriptions billing over $250 per month (July 2026, Recurly)
- 0.18%
- Top-quartile customer retention for SaaS with ARPA over $500 per month (2023 report, ChartMogul)
- 85.7%
- Top-quartile customer retention for SaaS with ARPA under $10 per month (2023 report, ChartMogul)
- 63.1%
- Best-in-class gross revenue retention when selling to mid-market and enterprise (2023 report, ChartMogul)
- ~95%
- Median net revenue retention, private B2B SaaS with $25,000 to $50,000 ACV (2025, SaaS Capital)
- 102%
Churn is the share of customers who leave in a given period. For a SaaS company it decides whether growth sticks. For a buyer it is a quiet signal about how a vendor writes its contracts.
This page pulls together the latest public benchmarks: Recurly's network data from July 2026, ChartMogul's 2023 retention report and SaaS Capital's 2025 survey of private B2B companies. Below you will find what a good number looks like at each price point, why low churn often comes from contract terms and not just a better product, and what to check before you sign or renew.
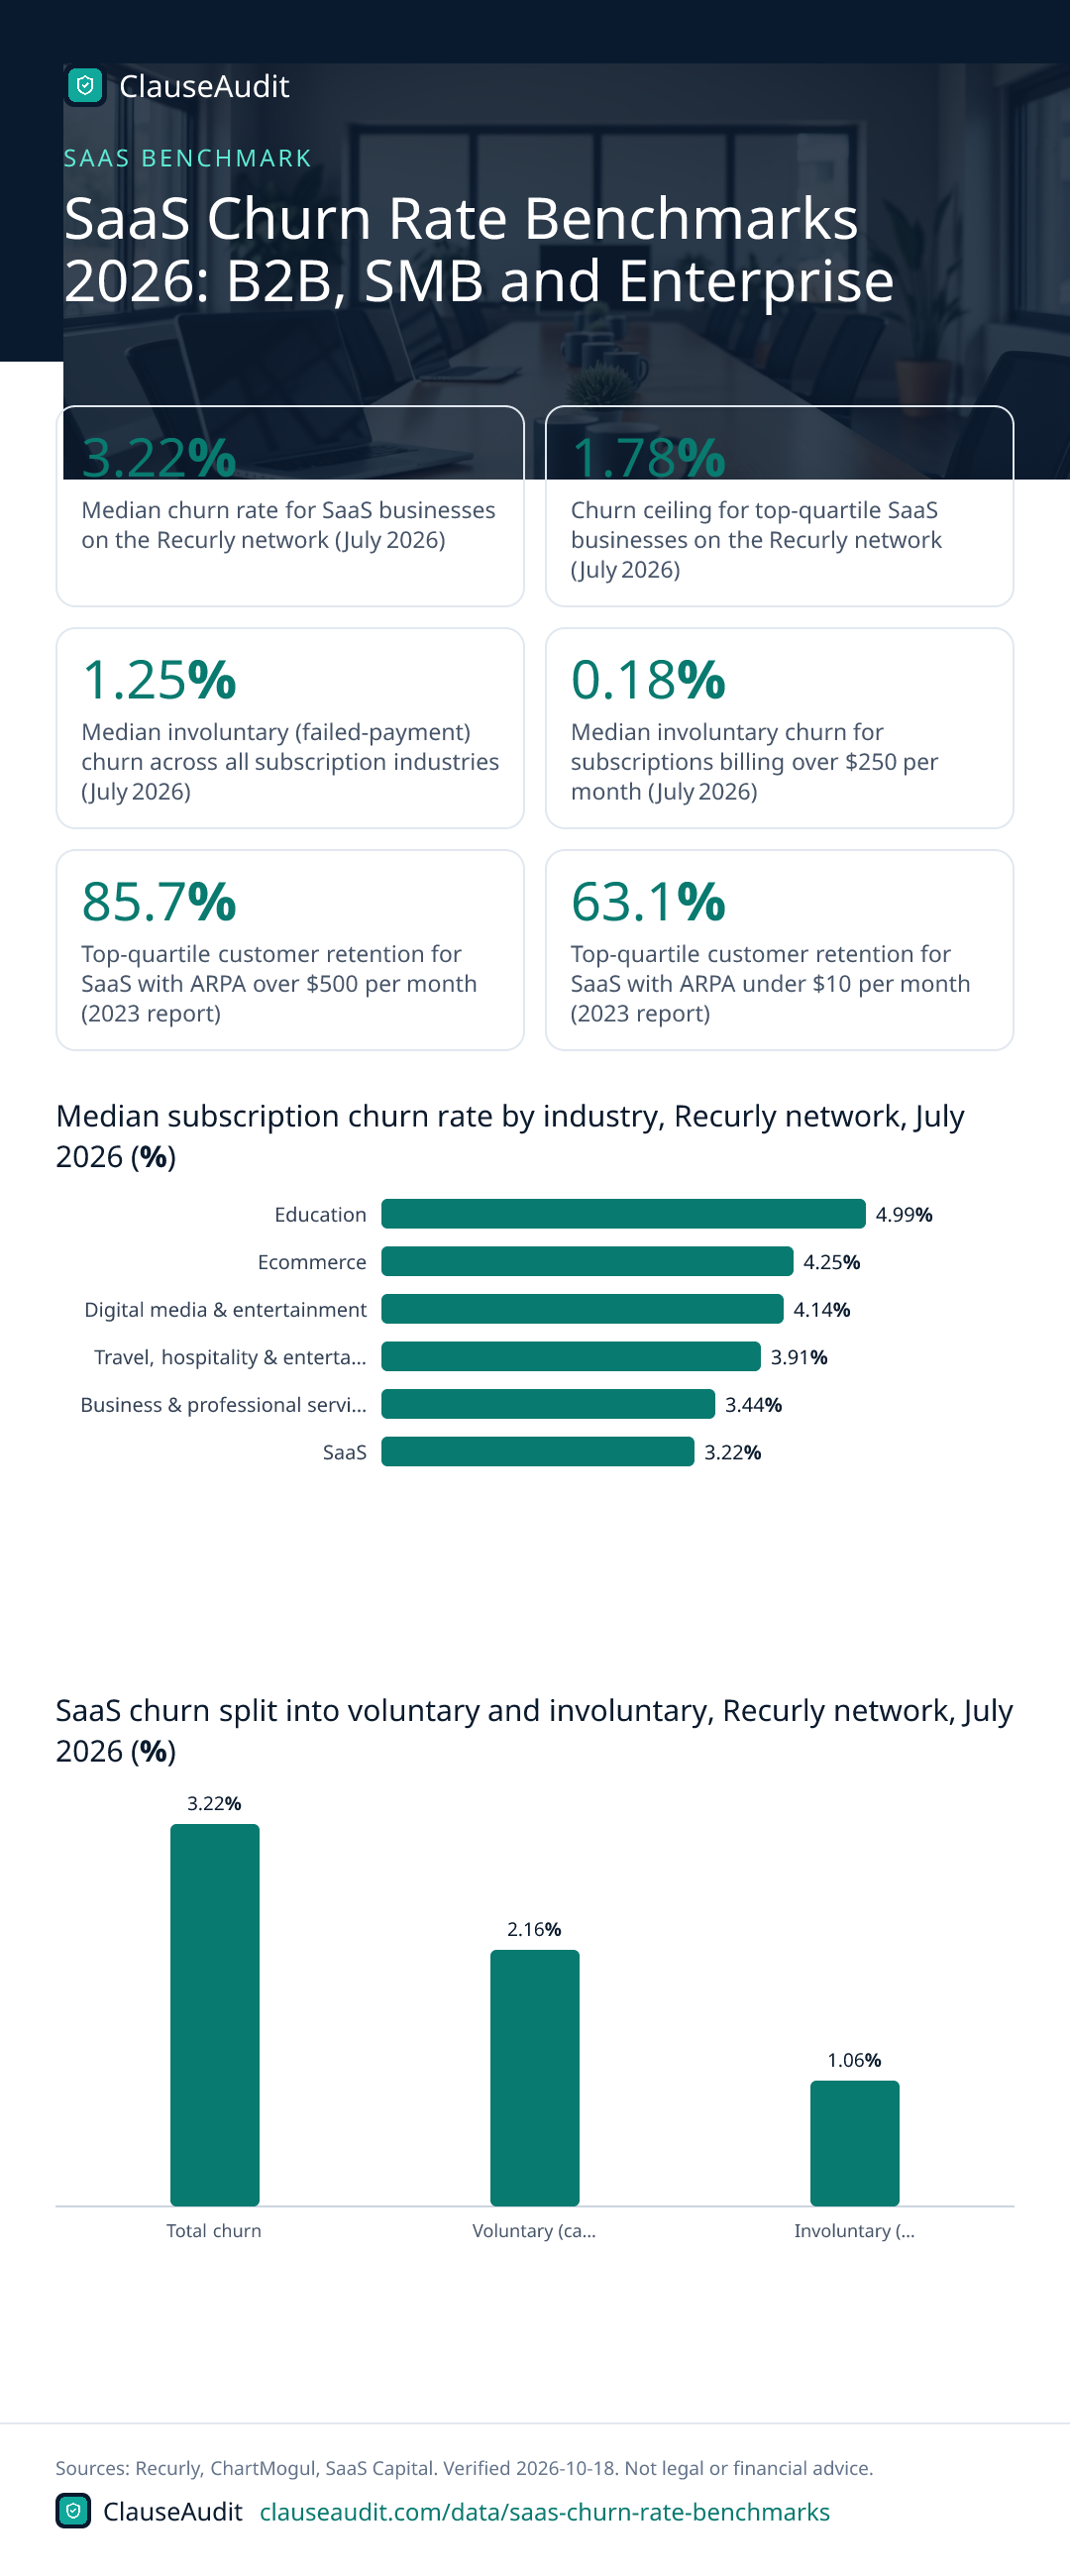
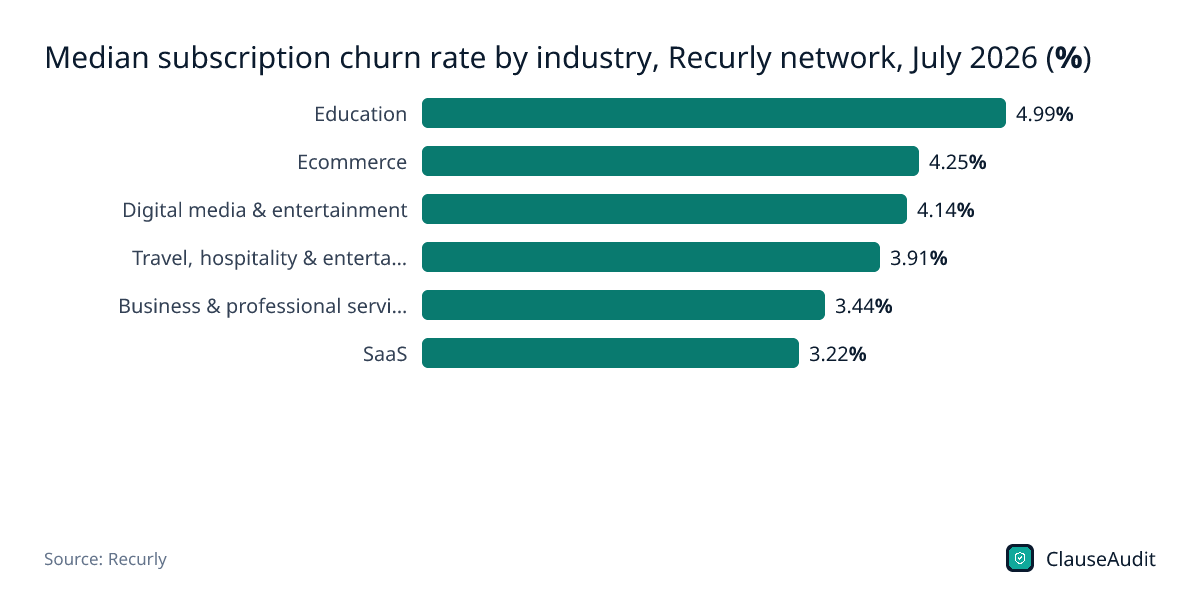
Median subscription churn rate by industry, Recurly network, July 2026 (%)
Chart data
| Label | Value |
|---|---|
| Education | 4.99% |
| Ecommerce | 4.25% |
| Digital media & entertainment | 4.14% |
| Travel, hospitality & entertainment | 3.91% |
| Business & professional services | 3.44% |
| SaaS | 3.22% |
SaaS has the lowest median churn of the six industries Recurly tracks, at 3.22% against 4.99% for education. Business software gets built into daily work and is often billed yearly, so leaving takes more effort than cancelling a streaming app.
Download this chart (PNG)SaaS churn split into voluntary and involuntary, Recurly network, July 2026 (%)
Chart data
| Label | Value (%) |
|---|---|
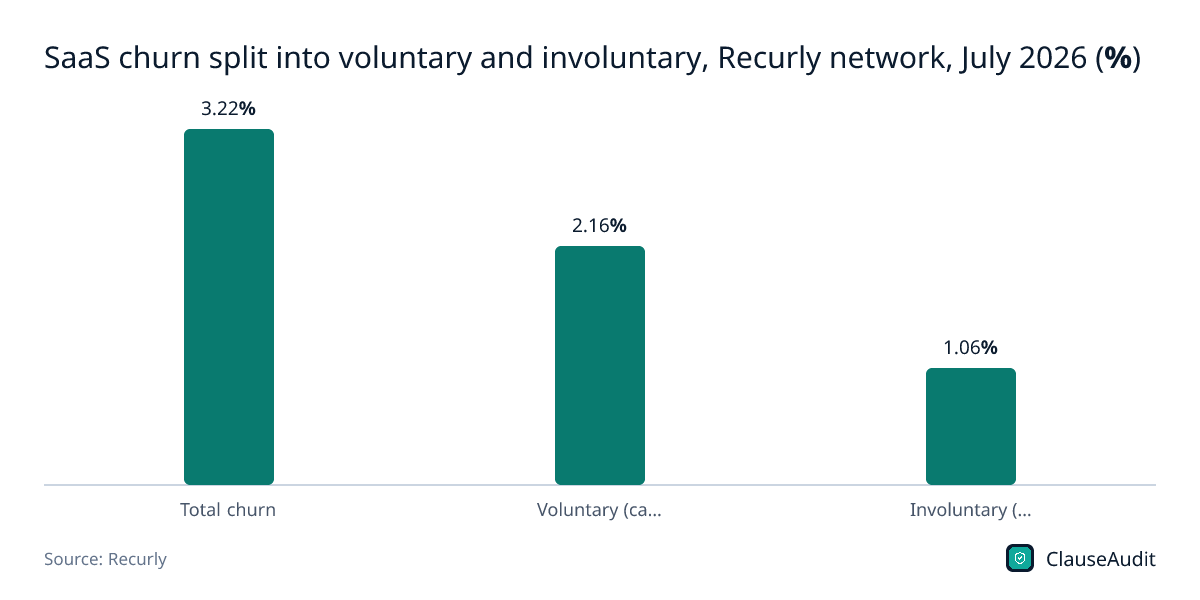
| Total churn | 3.22% |
| Voluntary (cancellations) | 2.16% |
| Involuntary (failed payments) | 1.06% |
Cancellations account for 2.16% and failed payments for 1.06% of SaaS churn. That second slice is customers who never chose to leave, which is why card retry rules and payment clauses matter.
Download this chart (PNG)Median total churn by monthly revenue per customer, Recurly network, July 2026 (%)
Chart data
| Label | Value (%) |
|---|---|
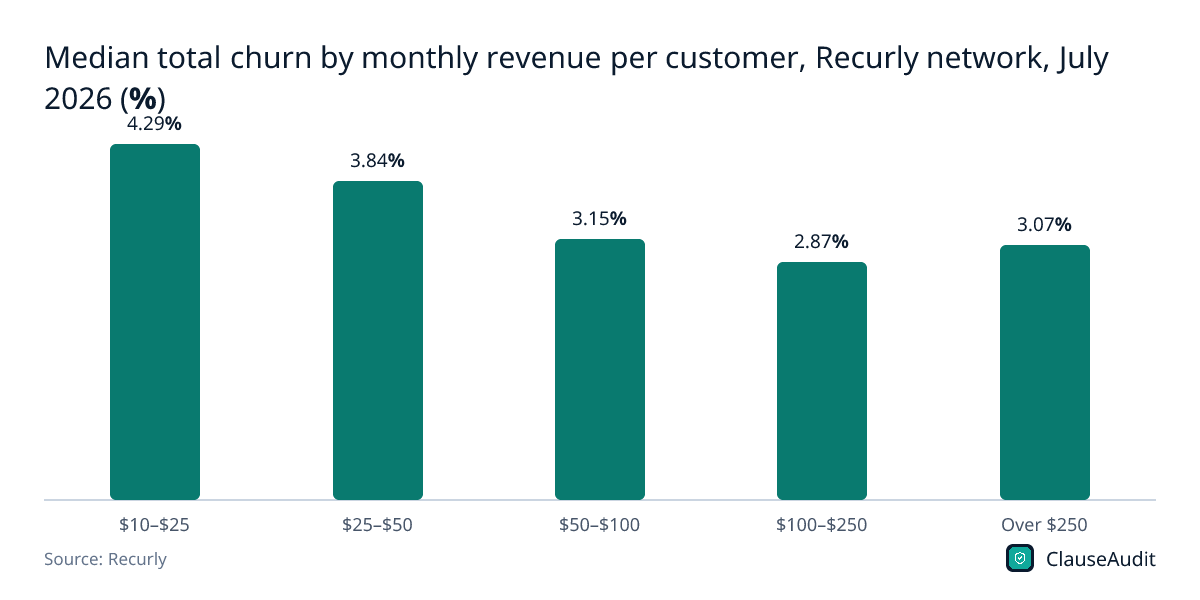
| $10–$25 | 4.29% |
| $25–$50 | 3.84% |
| $50–$100 | 3.15% |
| $100–$250 | 2.87% |
| Over $250 | 3.07% |
Churn mostly drops as the monthly price goes up, from 4.29% in the $10 to $25 band to 2.87% at $100 to $250. The over-$250 group ticks back up to 3.07%, so a higher price alone does not buy loyalty.
Download this chart (PNG)Median involuntary churn by monthly revenue per customer, Recurly network, July 2026 (%)
Chart data
| Label | Value (%) |
|---|---|
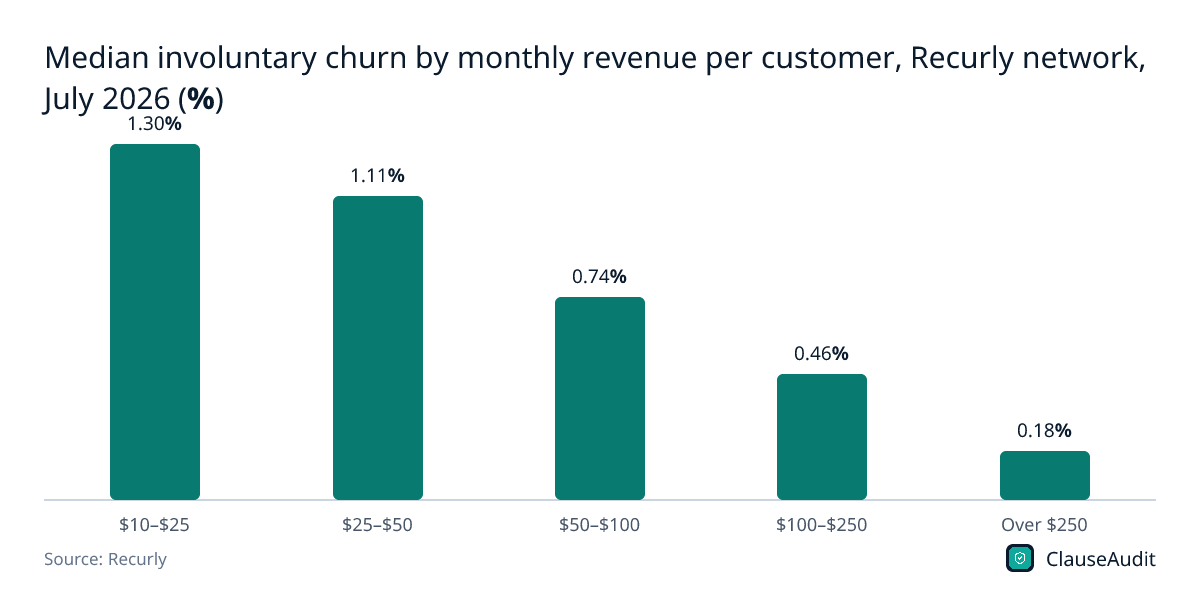
| $10–$25 | 1.30% |
| $25–$50 | 1.11% |
| $50–$100 | 0.74% |
| $100–$250 | 0.46% |
| Over $250 | 0.18% |
Failed-payment churn falls steadily with price, from 1.30% to 0.18%. Bigger accounts usually pay by invoice or have a finance team watching the card, so fewer renewals fail by accident.
Download this chart (PNG)Churn across all subscription industries, Recurly network, July 2026 (%)
Chart data
| Label | Value (%) |
|---|---|
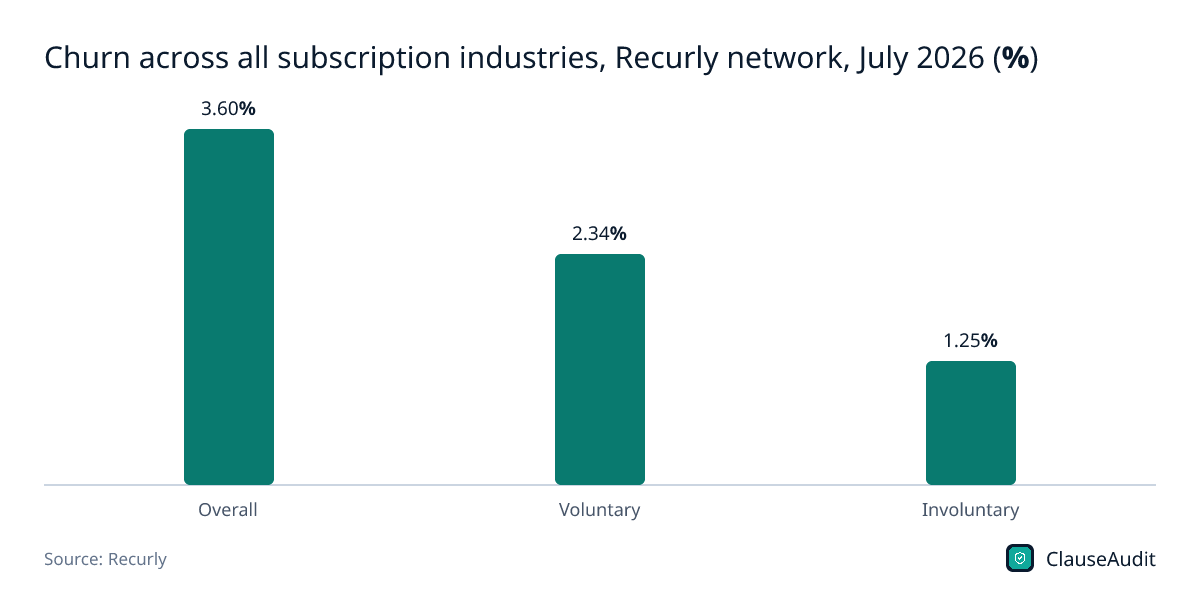
| Overall | 3.60% |
| Voluntary | 2.34% |
| Involuntary | 1.25% |
Across all subscription industries, overall churn is 3.60%, so SaaS sits below the wider subscription market. Recurly labels these figures a little differently from its SaaS numbers, so compare them loosely.
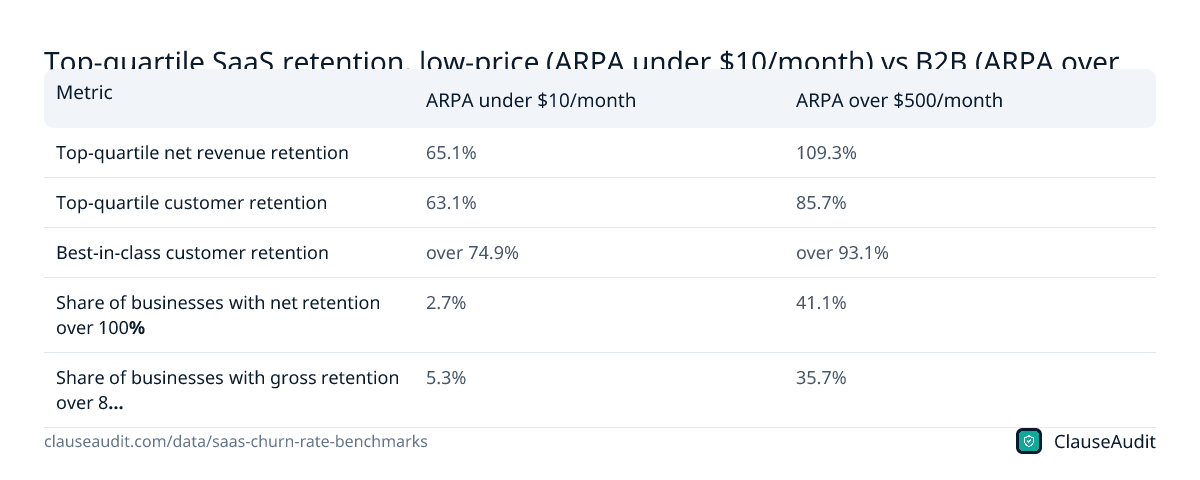
Download this chart (PNG)Top-quartile SaaS retention, low-price (ARPA under $10/month) vs B2B (ARPA over $500/month), ChartMogul 2023
| Metric | ARPA under $10/month | ARPA over $500/month |
|---|---|---|
| Top-quartile net revenue retention | 65.1% | 109.3% |
| Top-quartile customer retention | 63.1% | 85.7% |
| Best-in-class customer retention | over 74.9% | over 93.1% |
| Share of businesses with net retention over 100% | 2.7% | 41.1% |
| Share of businesses with gross retention over 85% | 5.3% | 35.7% |
Source: ChartMogul, SaaS Retention Report 2023. Download as image
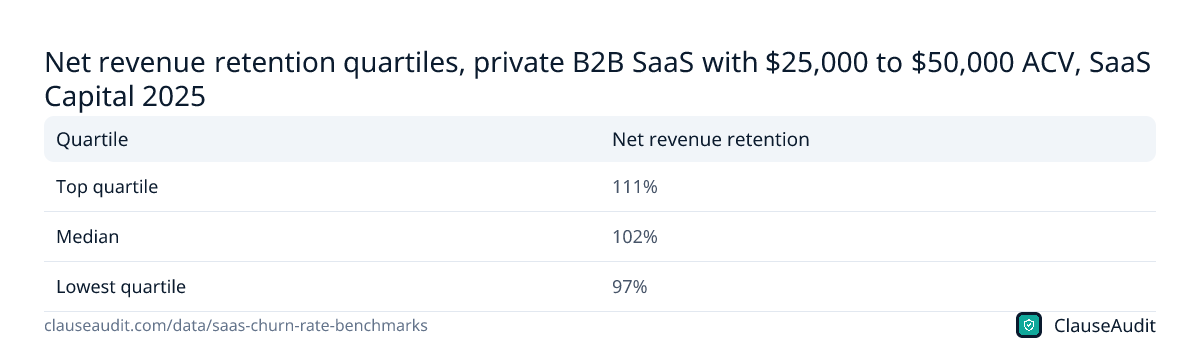
Net revenue retention quartiles, private B2B SaaS with $25,000 to $50,000 ACV, SaaS Capital 2025
| Quartile | Net revenue retention |
|---|---|
| Top quartile | 111% |
| Median | 102% |
| Lowest quartile | 97% |
Source: SaaS Capital, 2025 SaaS Retention Benchmarks for Private B2B Companies. Download as image
What is a good churn rate for SaaS in 2026?
On the Recurly network, the median SaaS business posted churn of 3.22% in July 2026. The top quartile came in at 1.78% or below. If your number sits under the median, you are doing better than most. If it sits near the top-quartile line, you are in strong company.
One caution before you compare. Recurly calls these annual rates, but its own worked example treats monthly and yearly churn very differently. The safe reading is that these are Recurly's network medians, to be compared with churn measured the same way. Setting a monthly figure from your billing tool against an annual benchmark is the easiest way to fool yourself.
Price changes the picture too. Across all subscription industries on Recurly's network, churn was 4.29% for plans billing $10 to $25 a month and 2.87% for plans at $100 to $250. A cheap self-serve tool and a large enterprise contract should not be held to the same bar.
How does B2B churn compare with SMB and consumer SaaS?
The clearest split is by account size. ChartMogul's 2023 report found that top-quartile SaaS companies with ARPA over $500 a month kept 85.7% of their customers. For companies with ARPA under $10 a month, the top quartile kept 63.1%. Same industry, very different economics.
Revenue retention widens the gap. Top-quartile net revenue retention was 109.3% for the higher-priced group and 65.1% for the low-priced one. Only 2.7% of the low-price businesses pushed net retention past 100%, against 41.1% of the B2B group.
ChartMogul's 2023 report puts best-in-class gross revenue retention at about 95% for companies selling to mid-market and enterprise customers. SaaS Capital's 2025 data for private B2B companies with $25,000 to $50,000 in annual contract value shows median net revenue retention of 102%, with the top quartile at 111% and the lowest quartile at 97%.
Put simply, higher-priced B2B customers leave less often, and the ones who stay often spend more. Small-business and consumer customers come and go much faster, so a vendor selling to them has to keep replacing lost accounts just to stand still.
Why is enterprise SaaS churn so low?
Part of it is the product. Once a tool holds your customer records, runs payroll or sits inside your daily workflow, switching hurts. Part of it is people. Enterprise accounts usually have a named contact at the vendor who spots trouble early.
A big share of it is the contract. Enterprise deals are often annual or multi-year, renew automatically and require written notice to cancel well before the renewal date. Miss that window and you are locked in for another term, even if nobody on your team still uses the product. On the vendor's dashboard, that counts as retention.
Payment method matters as well. Across all subscription industries on Recurly's network, involuntary churn was 1.30% for plans at $10 to $25 a month and just 0.18% for plans over $250. Larger customers often pay by invoice, so they rarely lose access because a card expired.
The gap between gross and net retention tells you something too. Gross retention counts only what you keep. Net retention adds upgrades, extra seats and price increases from the customers who stayed. A vendor with net retention above 100% is growing inside its existing accounts, and some of that growth may be coming from renewal price bumps written into contracts like yours.
What do churn benchmarks mean for you as a SaaS buyer?
If you buy software for a small business, low industry churn is not proof that customers are happy. Some of it is friction built into the agreement. Read the renewal and cancellation terms with that in mind.
Here is how it plays out. You sign up for a project management tool on an annual plan. The contract auto-renews unless you cancel in writing a set number of days before the term ends, and it lets the vendor raise prices at renewal. You decide to switch near the end of the year, then learn the notice window closed weeks ago. You now owe another full year, possibly at a higher price.
A few habits keep you out of that spot:
- Put the cancellation deadline in your calendar the day you sign, not the day you want out.
- Ask for renewal at the same price, or a written cap on increases.
- Push for a shorter first term if the tool is new to your team.
- Make sure you can cancel by email, instead of by certified letter or a phone call.
- Confirm you can export your data in a usable format after you leave.
What should SaaS founders do with these numbers?
If you sell software, use the benchmark for your price band, not the overall median. Across all subscription industries on Recurly's network in July 2026, plans billing $25 to $50 a month saw median churn of 3.84%, while plans at $50 to $100 saw 3.15%. Pick the band you actually sell into.
Look at revenue retention next to logo churn. Losing a handful of small accounts while your biggest customers add seats can still leave you ahead, and investors and lenders watch revenue retention closely. SaaS Capital's 2025 median of 102% for companies with $25,000 to $50,000 ACV is a fair yardstick for a growing B2B business.
Then split your churn in two. For SaaS on the Recurly network, cancellations made up 2.16% and failed payments 1.06%. Failed-payment churn is usually the cheaper problem to fix. Card updaters, sensible retry schedules and clear payment terms in your customer agreement all help.
Be careful about leaning on lock-in to hit a retention target. State auto-renewal laws and federal regulators keep pushing vendors toward clear disclosures and easy cancellation. Retention that exists only because a customer missed a notice deadline tends to come back as refund demands, chargebacks and angry reviews. Customers who stay because the product works are the ones who expand.
How ClauseAudit helps
Churn benchmarks tell you how sticky a vendor's customers are. Your contract tells you how sticky you are. The renewal, cancellation and pricing terms decide if you can walk away when a tool stops earning its keep.
Upload a SaaS agreement or order form and the automated review flags the clauses that make leaving hard or expensive, in plain English, before you sign or renew.
- Auto-renewal terms and the exact notice window to cancel
- Price increase rights at renewal and whether there is a cap
- Early termination fees or a duty to pay out the rest of the term
- Payment terms, late fees and what happens to access after a failed payment
- Data export and deletion rights when you cancel
- The liability cap and whether it covers a real data loss
Frequently asked questions
What is the average SaaS churn rate?
The median churn rate for SaaS businesses on the Recurly network was 3.22% in July 2026. Recurly labels this an annual median. Top-quartile companies held churn to 1.78% or below. Across every subscription industry Recurly tracks, overall churn was 3.60%, so SaaS sits below the wider subscription market.
What is the difference between voluntary and involuntary churn?
Voluntary churn is when a customer chooses to cancel. Involuntary churn is when a subscription ends because a payment failed, usually an expired or declined card. For SaaS on the Recurly network in July 2026, voluntary churn was 2.16% and involuntary churn was 1.06%. The second kind is often fixable with better retry and card update processes.
What is a good churn rate for B2B SaaS?
For B2B tools with ARPA over $500 a month, ChartMogul's 2023 report put top-quartile customer retention at 85.7% and best-in-class above 93.1%. For mid-market and enterprise sellers, the same report put best-in-class gross revenue retention at about 95%. If you keep more customers than that, you are doing very well by any public benchmark.
What is a good net revenue retention rate?
SaaS Capital's 2025 data for private B2B companies with $25,000 to $50,000 ACV shows a median net revenue retention of 102%. The top quartile reached 111% and the lowest quartile 97%. Anything above 100% means existing customers are spending more over time than you lose to cancellations and downgrades.
Why is churn higher for cheap SaaS plans?
Low-priced plans are easy to start and easy to drop. They are often paid on a personal card with no signed contract, so one click ends them and an expired card can end them by accident. Across all industries on Recurly's network in July 2026, involuntary churn alone was 1.30% for plans at $10 to $25 a month, against 0.18% for plans over $250.
Does low churn mean customers are happy?
Not always. Annual terms, auto-renewal and long notice windows keep customers on the books after they stop using a product. That shows up as retention, not satisfaction. When you size up a vendor, ask how many seats are actually in use, and read the cancellation clause yourself before you sign.
How do I avoid getting stuck in a SaaS contract renewal?
Find the renewal date and notice window before you sign and put both in your calendar. Ask for a cap on renewal price increases, the right to cancel by email and a shorter first term for an untested tool. If the contract already renewed, check if your state's auto-renewal law required a reminder you never got.
Which industry has the lowest subscription churn?
Among the six industries in Recurly's July 2026 data, SaaS had the lowest median churn at 3.22%. Business and professional services came next at 3.44%, then travel, hospitality and entertainment at 3.91%. Education had the highest at 4.99%, with ecommerce at 4.25% and digital media at 4.14%.
Use this data
Every chart and card below is free to reuse under CC BY 4.0. Download what you need and link back to this page.
 Stat cards
 Key findings card
 Infographic
 Median subscription churn rate by industry, Recurly network, July 2026 (%)
 SaaS churn split into voluntary and involuntary, Recurly network, July 2026 (%)
 Median total churn by monthly revenue per customer, Recurly network, July 2026 (%)
 Median involuntary churn by monthly revenue per customer, Recurly network, July 2026 (%)
 Churn across all subscription industries, Recurly network, July 2026 (%)
 Top-quartile SaaS retention, low-price (ARPA under $10/month) vs B2B (ARPA over $500/month), ChartMogul 2023
 Net revenue retention quartiles, private B2B SaaS with $25,000 to $50,000 ACV, SaaS Capital 2025
Embed the infographic
Free to share on your site, blog or slides under CC BY 4.0. Please keep the credit link.
Sources and method
Every number on this page comes from the sources below, each opened and read on or before October 18, 2026. A second, independent review checked every figure against its source and corrected anything that did not match. Figures that could not be confirmed were left out.
- Recurly, Churn rate benchmarks (Recurly network data) (July 2026 data)
- ChartMogul, SaaS Retention Report 2023 (November 1, 2023 (2023 edition, data from over 2,100 SaaS businesses))
- SaaS Capital, 2025 SaaS Retention Benchmarks for Private B2B Companies (September 18, 2025)
Cite this page
ClauseAudit, “SaaS Churn Rate Benchmarks 2026: B2B, SMB and Enterprise”, updated October 18, 2026, https://clauseaudit.com/data/saas-churn-rate-benchmarks. Free to reuse with a link back (CC BY 4.0).
This page summarises published data and law as checked on October 18, 2026. Figures are updated as new editions are released, and your own situation may differ. It is general information, not legal, tax or financial advice.