Average SaaS Spend per Employee: 2026 Benchmarks by Quarter, Industry and Company Size
By ClauseAudit Research · 6 sources ·
What is the average SaaS spend per employee?
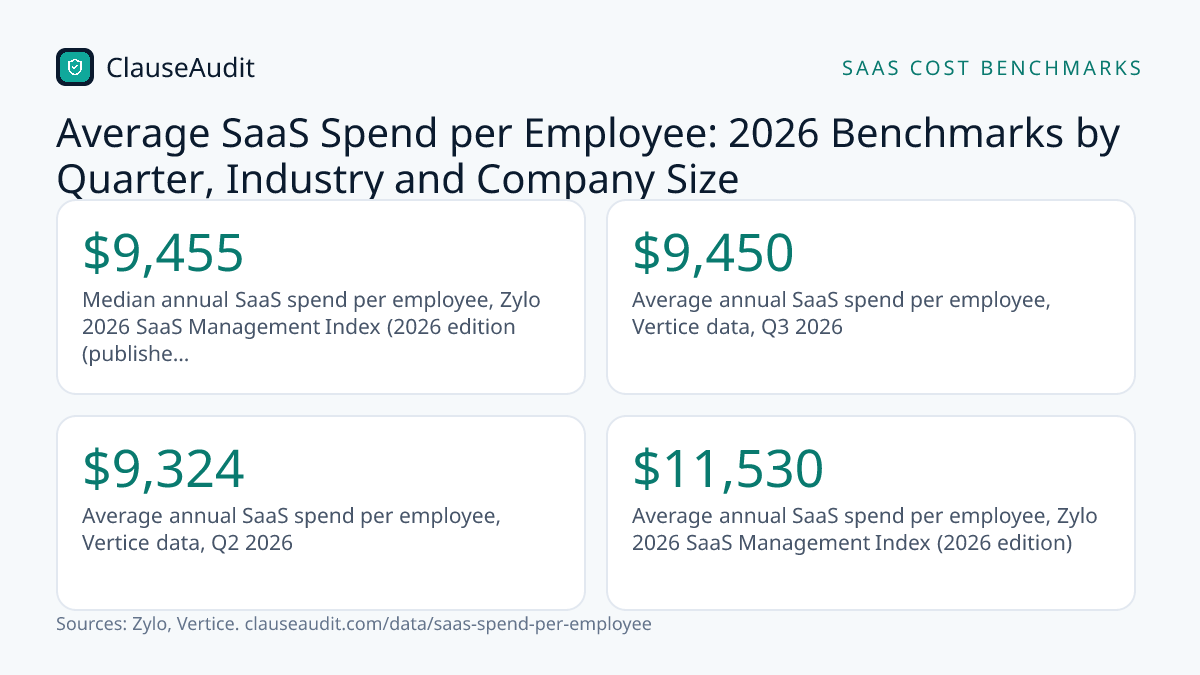
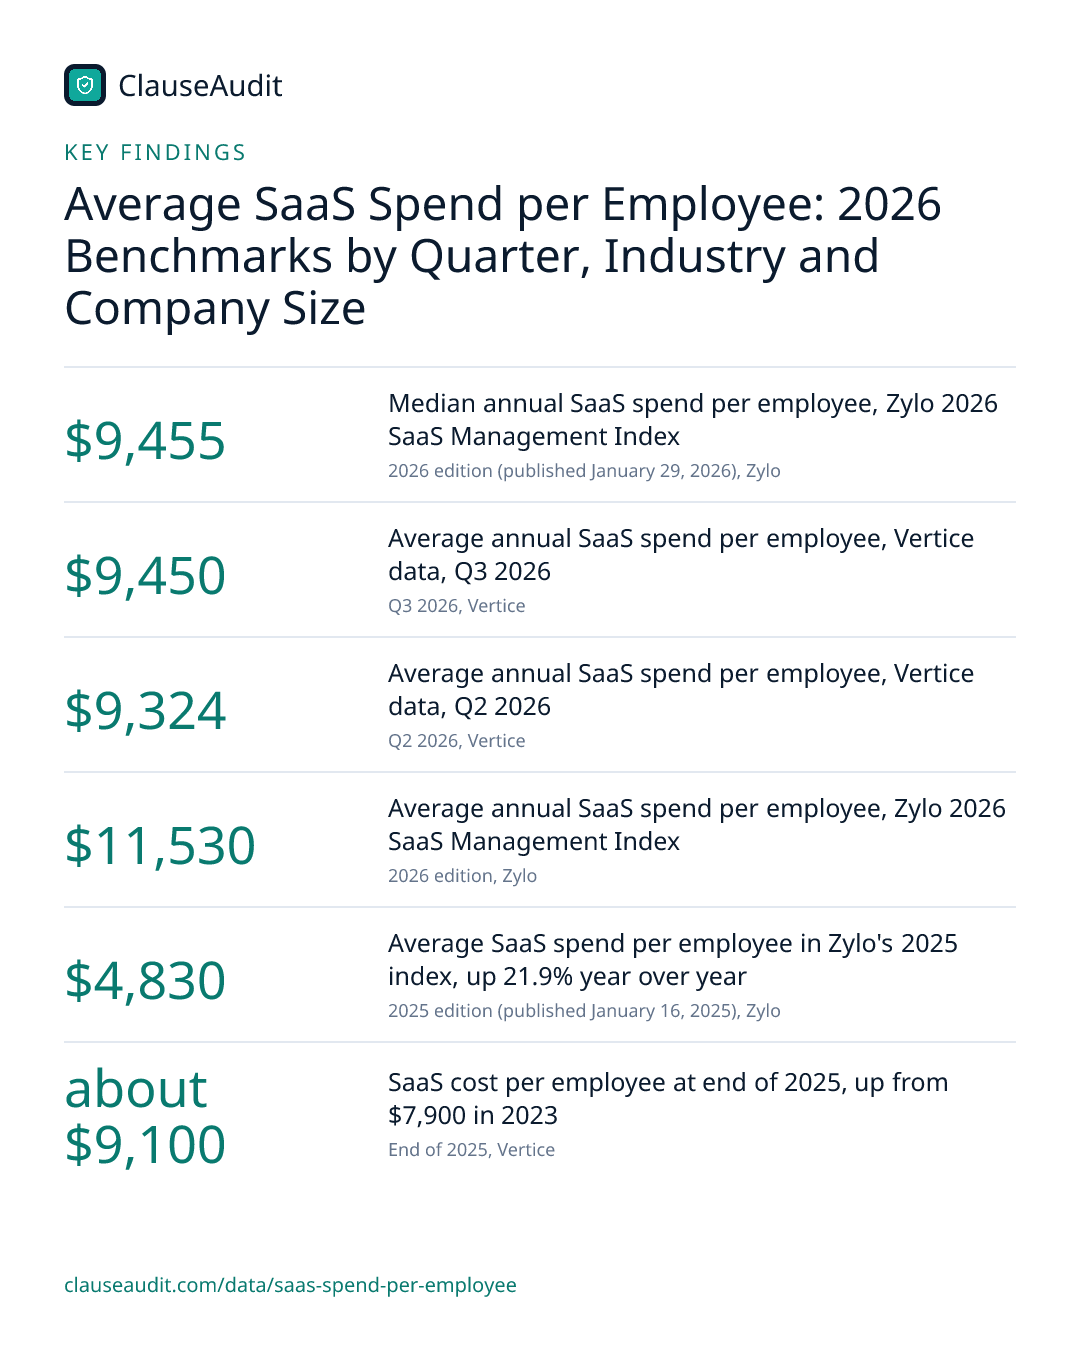
Companies spend about $9,450 per employee per year on SaaS, based on Vertice's preliminary Q3 2026 data, up from $9,324 in Q2. Zylo's 2026 index lands in the same place, with a median of $9,455. Healthcare ($10,150) and IT ($10,050) ran highest in Q1 2025, and media companies far lower.

- Median annual SaaS spend per employee, Zylo 2026 SaaS Management Index (2026 edition (published January 29, 2026), Zylo)
- $9,455
- Average annual SaaS spend per employee, Vertice data, Q3 2026 (Q3 2026, Vertice)
- $9,450
- Average annual SaaS spend per employee, Vertice data, Q2 2026 (Q2 2026, Vertice)
- $9,324
- Average annual SaaS spend per employee, Zylo 2026 SaaS Management Index (2026 edition, Zylo)
- $11,530
- Average SaaS spend per employee in Zylo's 2025 index, up 21.9% year over year (2025 edition (published January 16, 2025), Zylo)
- $4,830
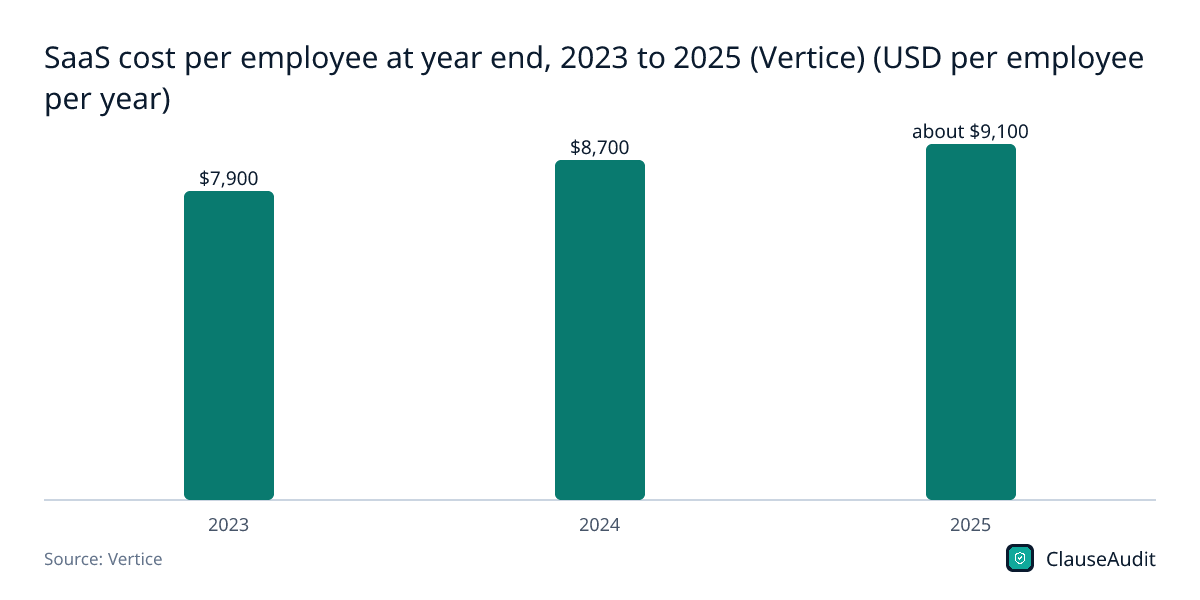
- SaaS cost per employee at end of 2025, up from $7,900 in 2023 (End of 2025, Vertice)
- about $9,100
- IT leaders reporting unexpected charges from consumption-based or AI pricing (12 months before January 2026, Zylo)
- 78%
- Healthcare SaaS spend per employee, the highest industry in Vertice data (Q1 2025, Vertice)
- $10,150
Two well-known SaaS spend trackers now land on almost the same number. Vertice puts average SaaS spend at a preliminary $9,450 per employee per year in Q3 2026, and Zylo's 2026 index puts the median at $9,455. That is the price of the subscriptions behind every seat in a typical company, before payroll, hardware or office space.
The figure matters less as a target than as a check. If your own cost per head sits well above it, you are probably paying for idle seats, overlapping tools or renewals that crept up without anyone reading the notice. This page explains what the benchmarks measure, why they keep climbing, and where in your contracts the money leaks out.
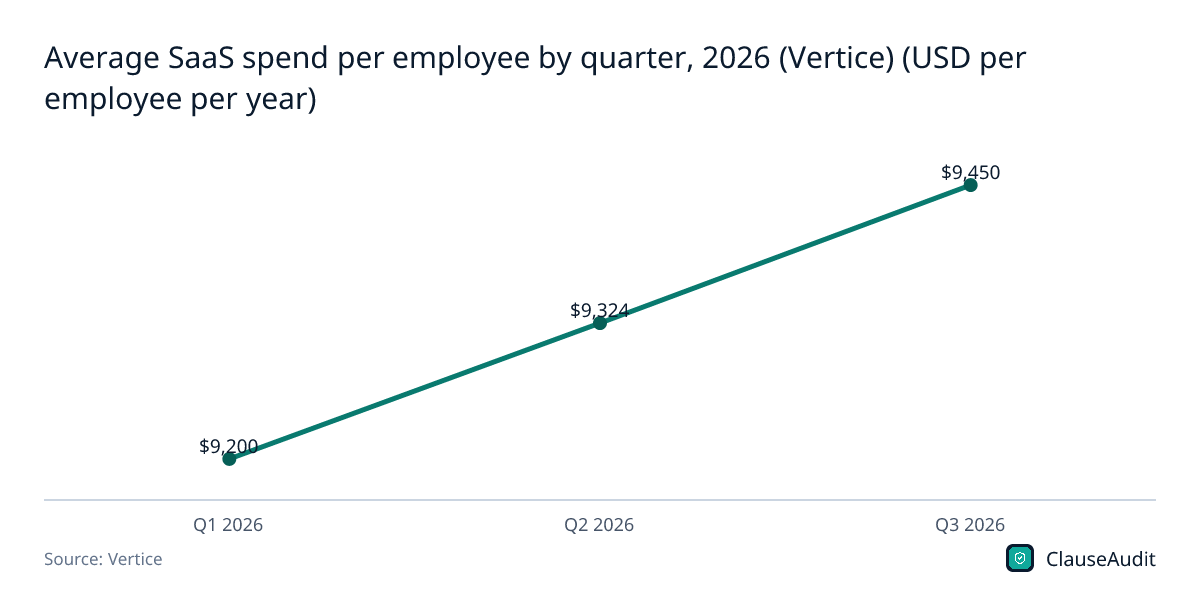
Average SaaS spend per employee by quarter, 2026 (Vertice) (USD per employee per year)
Chart data
| Label | Value (USD per employee per year) |
|---|---|
| Q1 2026 | $9,200 |
| Q2 2026 | $9,324 |
| Q3 2026 | $9,450 |
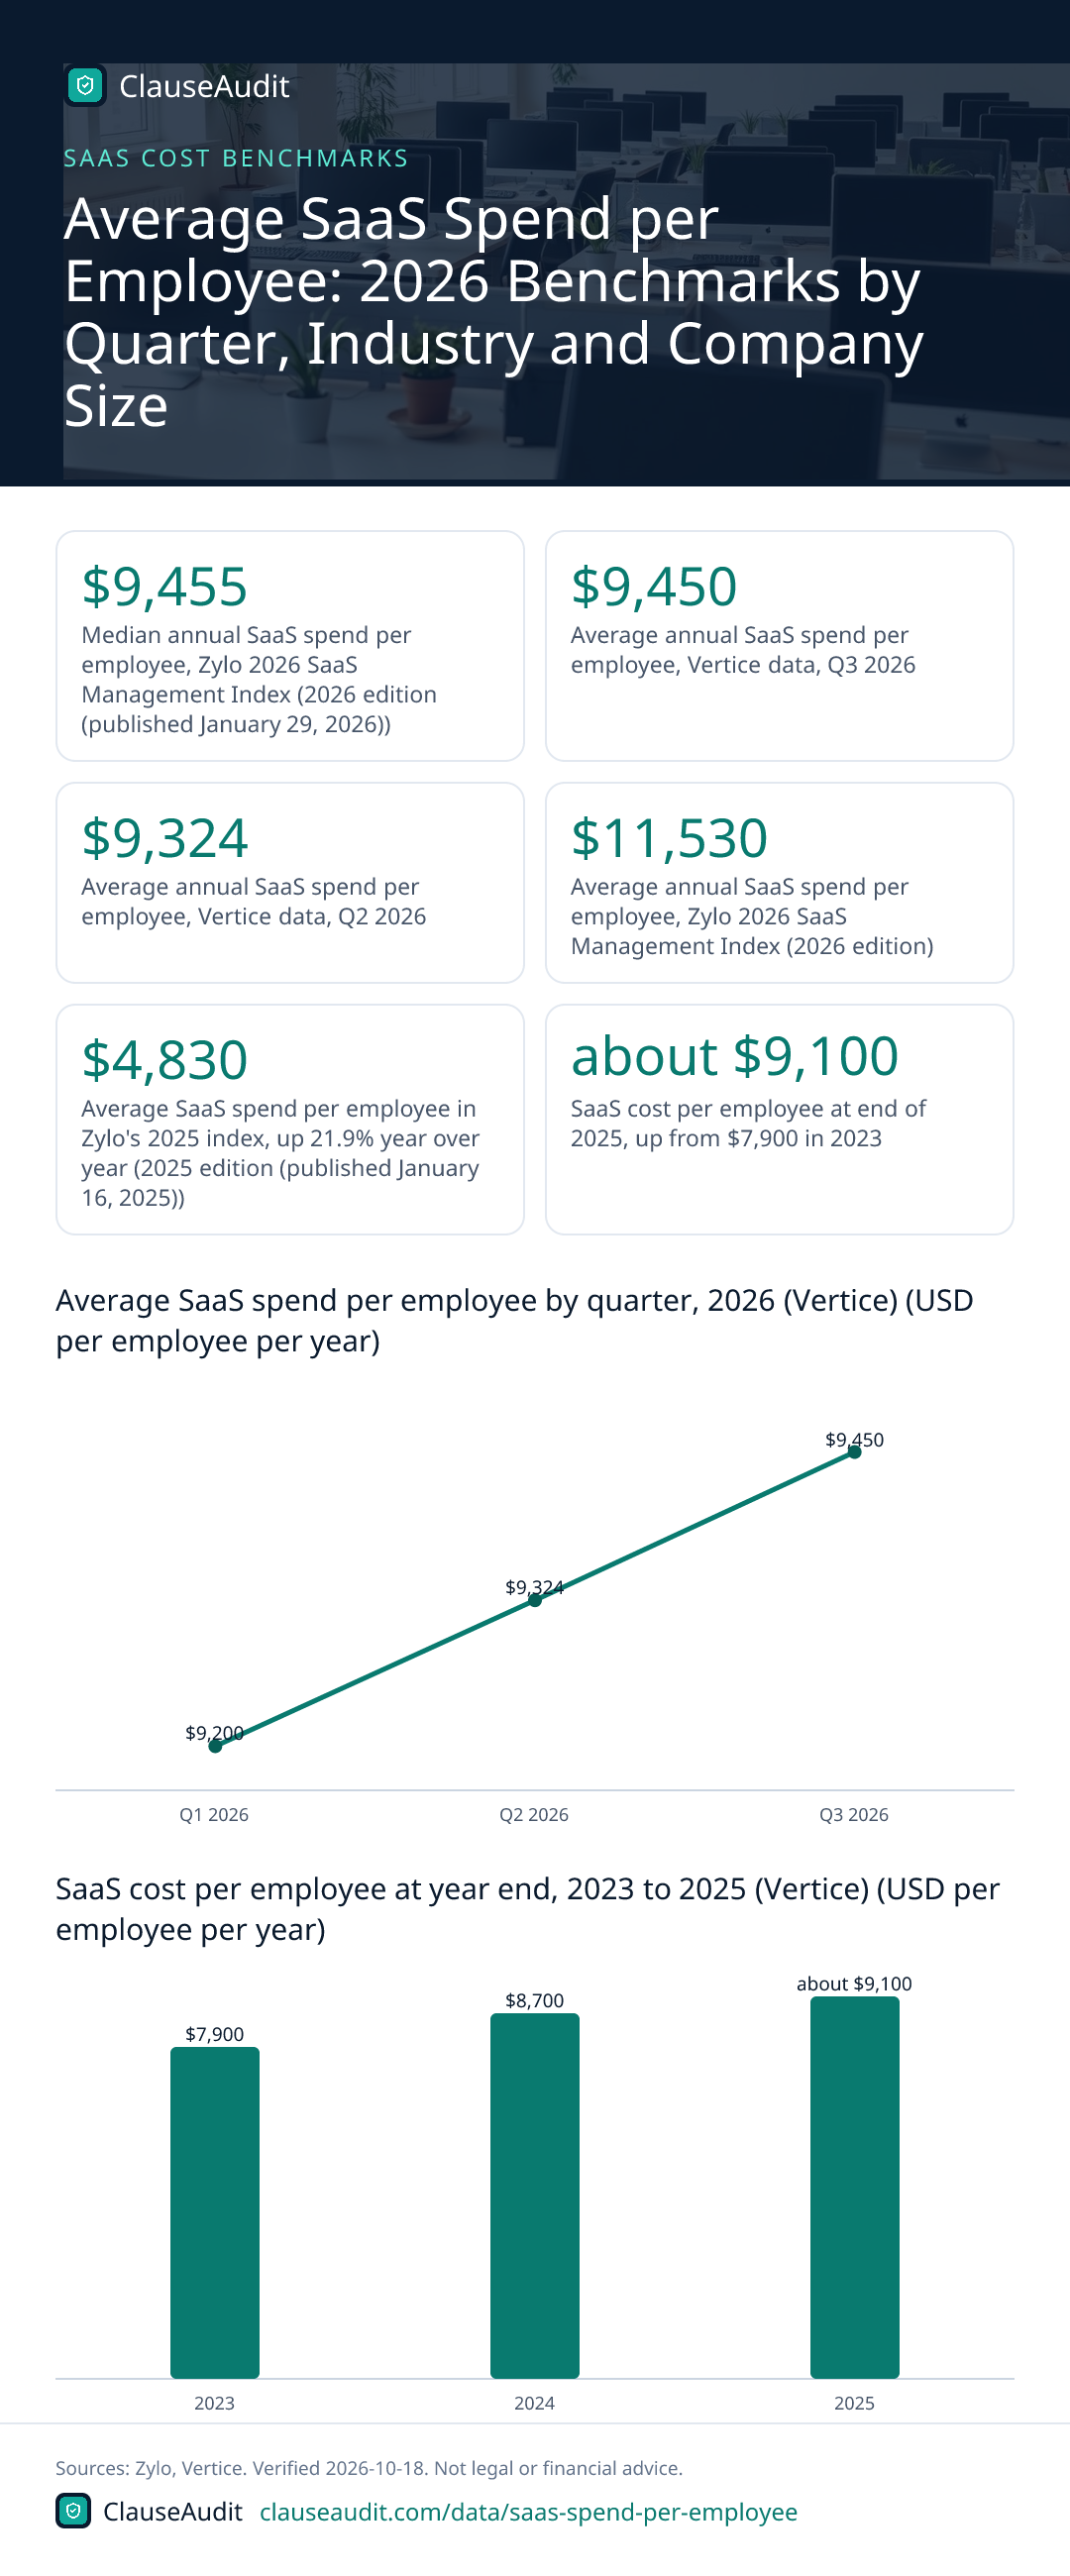
Spend sat at $9,200 for three straight quarters, then started moving again: $9,324 in Q2 2026 and a preliminary $9,450 in Q3. The pause is over.
Download this chart (PNG)SaaS cost per employee at year end, 2023 to 2025 (Vertice) (USD per employee per year)
Chart data
| Label | Value (USD per employee per year) |
|---|---|
| 2023 | $7,900 |
| 2024 | $8,700 |
| 2025 | about $9,100 |
From $7,900 in 2023 to $8,700 in 2024 to about $9,100 at the end of 2025. The yearly jumps are getting smaller, but the line has not turned down.
Download this chart (PNG)SaaS spend per employee by industry, Q1 2025 (Vertice) (USD per employee per year)
Chart data
| Label | Value |
|---|---|
| Healthcare | $10,150 |
| IT | $10,050 |
| Financial & Professional Services | $8,750 |
| Retail & Consumer Goods | $7,750 |
| Media & Entertainment | $3,250 |
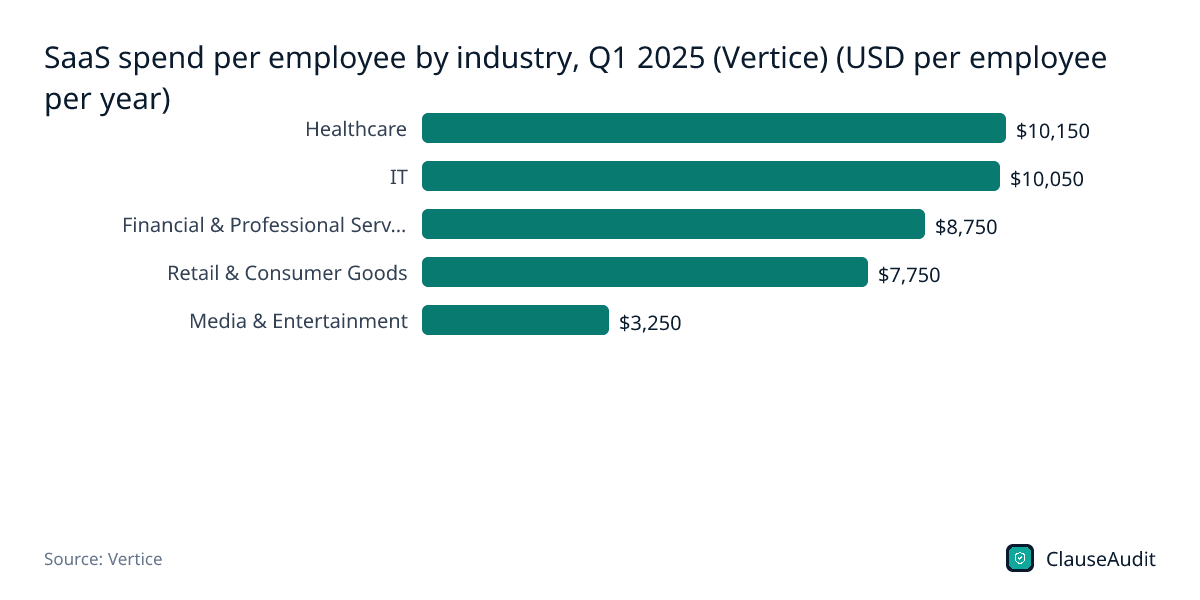
Healthcare ($10,150) and IT ($10,050) spend the most per person, while media and entertainment sits at $3,250. Compare yourself to your own industry, not the overall average.
Download this chart (PNG)Increase in SaaS spend per employee by company size, Q1 2024 to Q1 2025 (Vertice) (%)
Chart data
| Label | Value (%) |
|---|---|
| Mid-market | 40% |
| Enterprise | 28% |
| SMB | 21% |
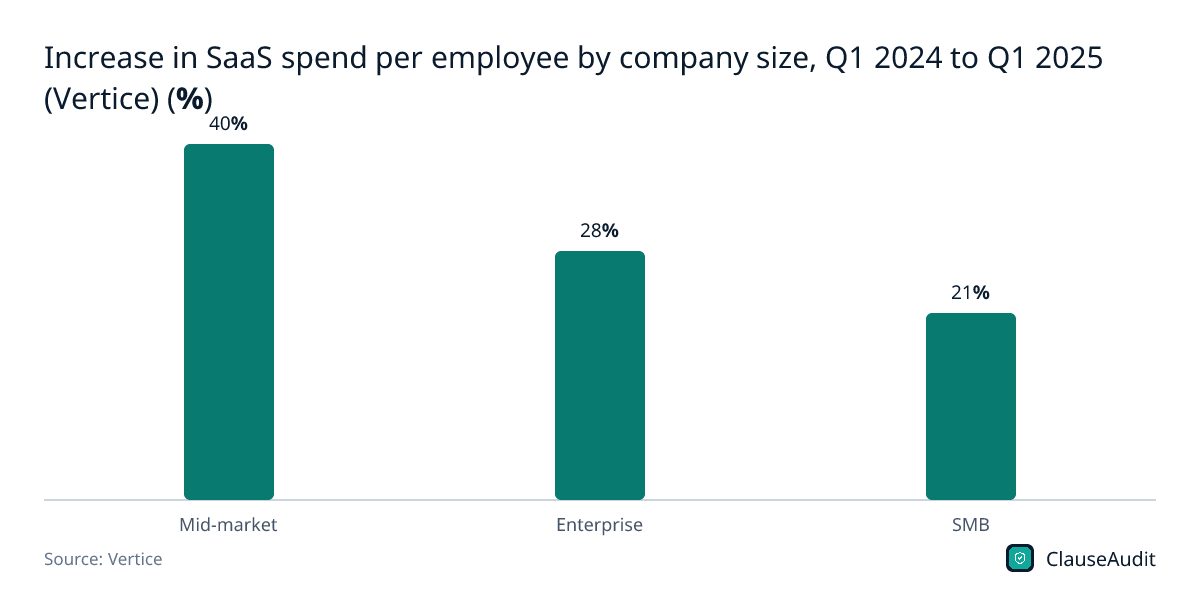
Mid-market companies saw the steepest rise at 40%, against 28% for enterprises and 21% for SMBs. Vertice's numbers show the size of the jump, not the reason for it.
Download this chart (PNG)SaaS spend per employee benchmarks compared
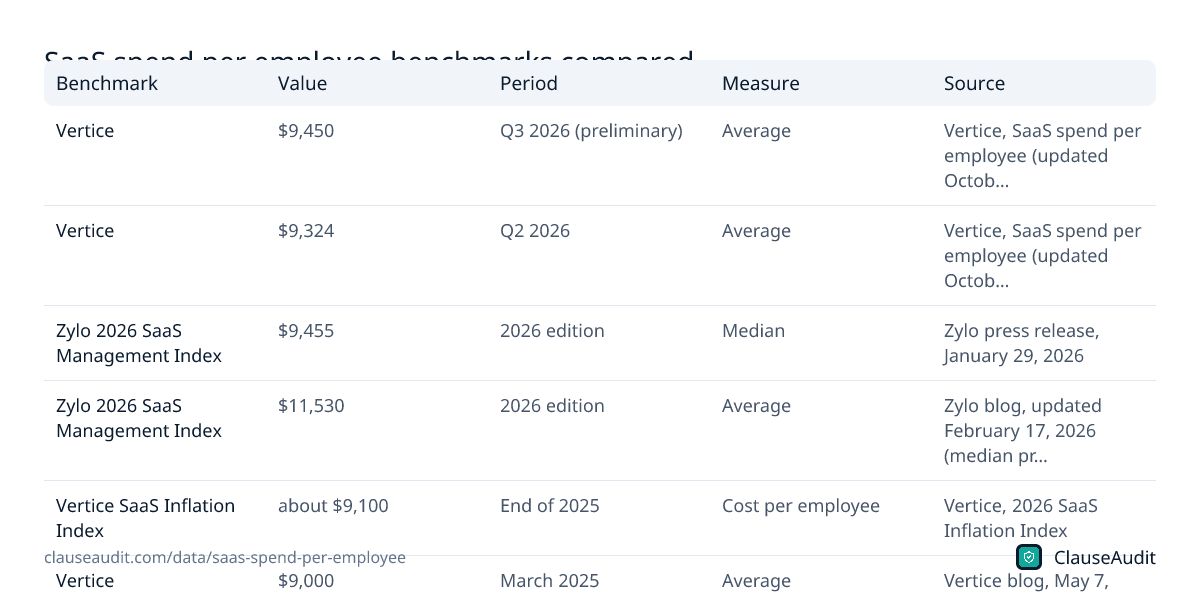
| Benchmark | Value | Period | Measure | Source |
|---|---|---|---|---|
| Vertice | $9,450 | Q3 2026 (preliminary) | Average | Vertice, SaaS spend per employee (updated October 2026) |
| Vertice | $9,324 | Q2 2026 | Average | Vertice, SaaS spend per employee (updated October 2026) |
| Zylo 2026 SaaS Management Index | $9,455 | 2026 edition | Median | Zylo press release, January 29, 2026 |
| Zylo 2026 SaaS Management Index | $11,530 | 2026 edition | Average | Zylo blog, updated February 17, 2026 (median printed there conflicts with press release) |
| Vertice SaaS Inflation Index | about $9,100 | End of 2025 | Cost per employee | Vertice, 2026 SaaS Inflation Index |
| Vertice | $9,000 | March 2025 | Average | Vertice blog, May 7, 2025 |
| Zylo 2025 SaaS Management Index | $4,830 | 2025 edition | Average | Zylo press release, January 16, 2025 |
Source: Vertice, SaaS spend per employee; Zylo, Zylo's 2026 SaaS Management Index Finds AI-Native App Adoption Is Surging, with ChatGPT Now the Most Expensed App; Zylo, Tech Stack Management: Strategy & Best Practices; Vertice, SaaS Inflation Index 2026 Report; Vertice, SaaS Spend per Employee; Zylo, Announcing Zylo's 2025 SaaS Management Index. Download as image
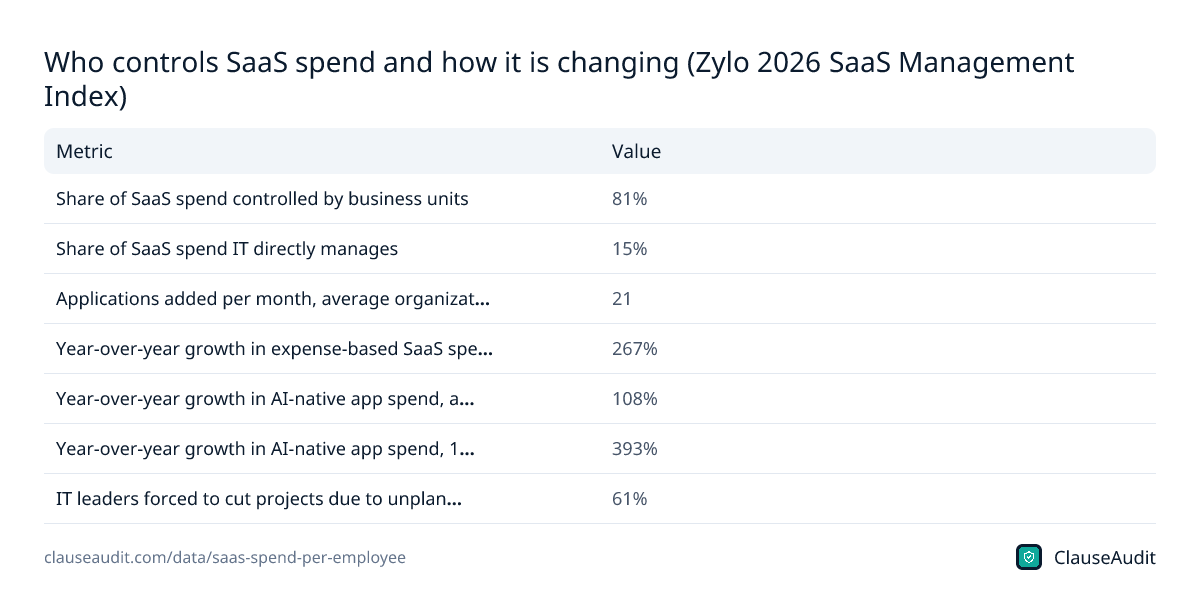
Who controls SaaS spend and how it is changing (Zylo 2026 SaaS Management Index)
| Metric | Value |
|---|---|
| Share of SaaS spend controlled by business units | 81% |
| Share of SaaS spend IT directly manages | 15% |
| Applications added per month, average organization | 21 |
| Year-over-year growth in expense-based SaaS spend | 267% |
| Year-over-year growth in AI-native app spend, all organizations | 108% |
| Year-over-year growth in AI-native app spend, 10,000+ employees | 393% |
| IT leaders forced to cut projects due to unplanned SaaS cost increases | 61% |
Source: Zylo, Zylo's 2026 SaaS Management Index Finds AI-Native App Adoption Is Surging, with ChatGPT Now the Most Expensed App. Download as image
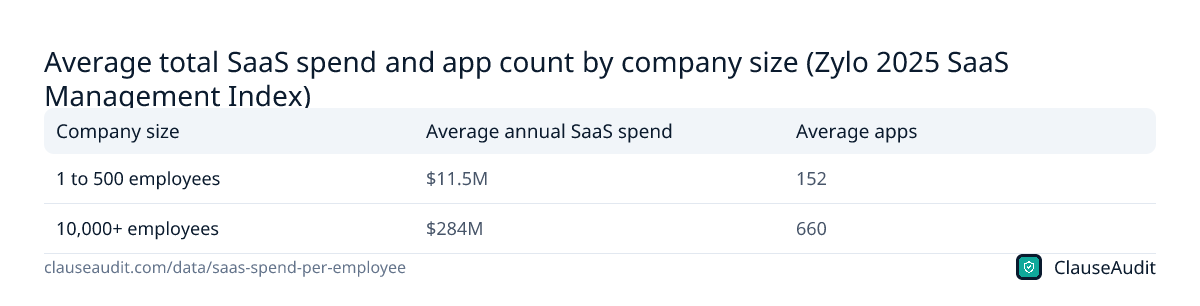
Average total SaaS spend and app count by company size (Zylo 2025 SaaS Management Index)
| Company size | Average annual SaaS spend | Average apps |
|---|---|---|
| 1 to 500 employees | $11.5M | 152 |
| 10,000+ employees | $284M | 660 |
Source: Zylo, Announcing Zylo's 2025 SaaS Management Index. Download as image
What is the average SaaS spend per employee in 2026?
The short answer is roughly $9,450 a year. Vertice's Q3 2026 average is $9,450, a preliminary figure based on data processed so far, and Zylo's 2026 SaaS Management Index reports a median of $9,455. Two different datasets, built from different customers, landing within a few dollars of each other is a decent sign the number is real.
You will also see $11,530 quoted as Zylo's 2026 average. Treat it with care. It comes from a Zylo blog post rather than the press release, and the median printed alongside it conflicts with Zylo's own published median. A higher average than median is normal, since a handful of heavy spenders pull the mean up, but this pair does not line up cleanly.
The same goes for older figures. Zylo's 2025 edition reported an average of $4,830, up 21.9% year over year, but its sample changed a lot between editions, from $40 billion of spend under management to $75 billion. Do not read the gap between $4,830 and $9,455 as spend doubling in a year. One figure is an average and the other a median, and the pool of companies behind them changed.
Keep in mind who these numbers describe. Zylo's data skews toward large organizations, and Vertice's comes from global processed spend rather than US companies alone. Neither is a government statistic. They are good for a sanity check, not for a budget line you copy straight into a spreadsheet.
Why does SaaS spend per employee keep going up?
Vertice's yearly series tells the story plainly: $7,900 in 2023, $8,700 in 2024, about $9,100 at the end of 2025. Its quarterly tracker shows spend holding at $9,200 for three quarters through Q1 2026, then rising again. Because this is a per-employee figure, hiring alone does not explain the climb. The data points instead to pricing and to how much software sits behind each seat.
Three forces show up in the data. First, pricing has become harder to predict. In Zylo's 2026 report, 78% of IT leaders said they got unexpected charges from consumption-based or AI pricing, up from 66.5% a year earlier, and 61% said unplanned SaaS cost increases forced them to cut projects. Usage-based billing sounds fair until a busy month turns into a surprise invoice.
Second, the people buying software are no longer just IT. Zylo found business units control 81% of SaaS spend, while IT directly manages only 15%. The average organization adds 21 applications a month, and expense-based SaaS spend grew 267% year over year. When a manager puts a tool on a company card, there is often nobody negotiating the renewal terms.
Third, new categories are stacking on top of old ones. Year over year, spend on AI-native apps rose 108% across all organizations and 393% at companies with 10,000+ employees.
How does your company compare by industry and size?
Industry matters more than most people expect. In Vertice's Q1 2025 data, healthcare led at $10,150 per employee and IT at $10,050, followed by financial and professional services at $8,750 and retail and consumer goods at $7,750. Media and entertainment came in at just $3,250. A software consultancy spending more than a retailer per head is not a warning sign on its own.
Size shapes the growth rate. Between Q1 2024 and Q1 2025, spend per employee rose 40% at mid-market companies, 28% at enterprises and 21% at SMBs. Zylo's 2025 figures show the scale gap too: companies with 1 to 500 employees averaged $11.5M in total annual SaaS spend across 152 apps, while those with 10,000+ employees averaged $284M across 660 apps.
Here is a quick way to find your own number. Add up every recurring software charge for the past year, including the ones on expense reports and personal cards that got reimbursed. Divide by your headcount. Then compare it to your industry figure, not the headline average.
If you land well above your industry, look first at seat counts and duplicate tools. If you land well below, do not assume you are lean. You may simply have software spread across personal cards that never made it into your total. Either way, the number gives you a starting point for a renewal conversation, and vendors take a buyer who knows their own costs more seriously than one who does not.
What does this mean for freelancers and small teams?
If you work for yourself, you are a company of one, and your software bill is your per-employee spend. Design suites, a CRM, cloud storage, invoicing, a scheduling tool and a video app add up fast. You will not hit enterprise numbers, but the same leaks apply: annual plans that renew quietly, a price bump at renewal, and tools you stopped using months ago.
Small teams have one advantage. You can see every subscription on a single statement. Spend an hour on it each quarter and you will catch most of the waste that larger companies need a whole procurement team to find.
Employees feel this too. In Zylo's survey, 61% of IT leaders said surprise SaaS cost increases forced them to cut projects. Those are often the projects people on the team were counting on.
How do you lower your SaaS cost per employee?
- Build one list of every subscription, owner, seat count and renewal date. Include tools bought on expense cards.
- Put renewal dates on a calendar with a reminder well before each cancellation deadline, not on the renewal day itself.
- Check seat usage before renewal and drop licenses for people who left or never logged in.
- Ask for a cap on renewal price increases in writing before you sign, not after the invoice arrives.
- For usage-based or AI pricing, set spend alerts and ask the vendor for a hard ceiling or a pre-approval step for overages.
- Consolidate overlapping tools. Two project trackers or three file-sharing apps usually means one can go.
- Read the termination and data export terms so you can actually leave when a cheaper option comes along.
How ClauseAudit helps
Most of the money in these benchmarks is locked in by contract terms people skim: the renewal clause, the price change clause and the usage terms. By the time the invoice looks wrong, the window to push back has often closed.
Upload a SaaS agreement or order form and ClauseAudit's automated review flags the terms that drive cost up, explains them in plain English and suggests what to ask for before you sign or renew.
- Auto-renewal and the notice window you need to cancel
- Price increase limits at renewal, or the lack of any cap
- Seat minimums, true-ups and any right to reduce licenses mid-term
- Usage-based or overage pricing and any spending ceiling
- Unilateral changes to terms that take effect if you keep using the service
- Liability cap, termination rights and how you get your data out when you leave
Frequently asked questions
What is the average SaaS spend per employee in 2026?
About $9,450 a year. That is Vertice's preliminary Q3 2026 average, up from $9,324 in Q2. Zylo's 2026 SaaS Management Index reports a median of $9,455. Both cover SaaS subscriptions, not hardware or salaries, and both come from vendor customer data rather than a government survey.
Is SaaS spend per employee going up or down?
Up. Vertice's figures went from $7,900 in 2023 to $8,700 in 2024 and about $9,100 at the end of 2025. Its quarterly tracker held flat at $9,200 for three quarters through Q1 2026, then climbed to $9,324 in Q2. Surprise usage and AI charges, spend outside IT and new AI-native tools all show up in the data.
Which industries spend the most on SaaS per employee?
In Vertice's Q1 2025 data, healthcare led at $10,150 per employee, with IT close behind at $10,050. Financial and professional services spent $8,750 and retail and consumer goods $7,750. Media and entertainment was far lower at $3,250. Compare your company to its own industry rather than the overall average.
Why do Zylo's 2025 and 2026 numbers look so different?
Zylo's 2025 edition reported an average of $4,830, while the 2026 edition reports a median of $9,455. The two are not directly comparable. Zylo's dataset grew from $40 billion to $75 billion in spend under management, so the mix of companies changed, and one figure is an average while the other is a median. Read each edition on its own rather than as a single trend line.
How do I calculate my company's SaaS spend per employee?
Total every recurring software charge over the past twelve months, including tools paid on company cards or reimbursed through expenses. Divide that by your average headcount for the year. Decide whether to count contractors who use paid seats, and stay consistent so you can compare one year with the next.
Who controls most SaaS spending inside a company?
Usually not IT. Zylo's 2026 index found business units control 81% of SaaS spend, while IT directly manages 15%. Expense-based SaaS spend grew 267% year over year. That is why many renewals go unchallenged: the person who bought the tool rarely reads the renewal or price change terms in the contract.
How common are surprise SaaS charges?
Very common. In Zylo's 2026 report, 78% of IT leaders said they received unexpected charges from consumption-based or AI pricing, up from 66.5% the year before. And 61% said unplanned SaaS cost increases forced them to cut projects. Spending alerts and a contractual ceiling on overages are the simplest defenses.
What contract terms raise SaaS costs the most?
Auto-renewal with a long cancellation notice period, renewal price increases with no cap, seat minimums you cannot reduce, and usage-based pricing with no ceiling. Clauses that let the vendor change terms by notice also matter, because continued use can count as acceptance. Check all of these before you sign or renew.
Use this data
Every chart and card below is free to reuse under CC BY 4.0. Download what you need and link back to this page.
 Stat cards
 Key findings card
 Infographic
 Average SaaS spend per employee by quarter, 2026 (Vertice) (USD per employee per year)
 SaaS cost per employee at year end, 2023 to 2025 (Vertice) (USD per employee per year)
 SaaS spend per employee by industry, Q1 2025 (Vertice) (USD per employee per year)
 Increase in SaaS spend per employee by company size, Q1 2024 to Q1 2025 (Vertice) (%)
 SaaS spend per employee benchmarks compared
 Who controls SaaS spend and how it is changing (Zylo 2026 SaaS Management Index)
 Average total SaaS spend and app count by company size (Zylo 2025 SaaS Management Index)
Embed the infographic
Free to share on your site, blog or slides under CC BY 4.0. Please keep the credit link.
Sources and method
Every number on this page comes from the sources below, each opened and read on or before October 18, 2026. A second, independent review checked every figure against its source and corrected anything that did not match. Figures that could not be confirmed were left out.
- Zylo, Zylo's 2026 SaaS Management Index Finds AI-Native App Adoption Is Surging, with ChatGPT Now the Most Expensed App (January 29, 2026 (2026 SaaS Management Index, eighth edition))
- Zylo, Tech Stack Management: Strategy & Best Practices (May 28, 2025; updated February 17, 2026)
- Zylo, Announcing Zylo's 2025 SaaS Management Index (January 16, 2025 (2025 SaaS Management Index, seventh edition))
- Vertice, SaaS spend per employee (Last updated October 2026)
- Vertice, SaaS Inflation Index 2026 Report (2026 edition)
- Vertice, SaaS Spend per Employee (May 7, 2025)
Cite this page
ClauseAudit, “Average SaaS Spend per Employee: 2026 Benchmarks by Quarter, Industry and Company Size”, updated October 18, 2026, https://clauseaudit.com/data/saas-spend-per-employee. Free to reuse with a link back (CC BY 4.0).
This page summarises published data and law as checked on October 18, 2026. Figures are updated as new editions are released, and your own situation may differ. It is general information, not legal, tax or financial advice.