Employment Contract Statistics 2026: 160+ Numbers on Non-Competes, NDAs, Arbitration and Severance
By ClauseAudit Research · 163 statistics · 91 sources ·
What are the key employment contract statistics for 2026?
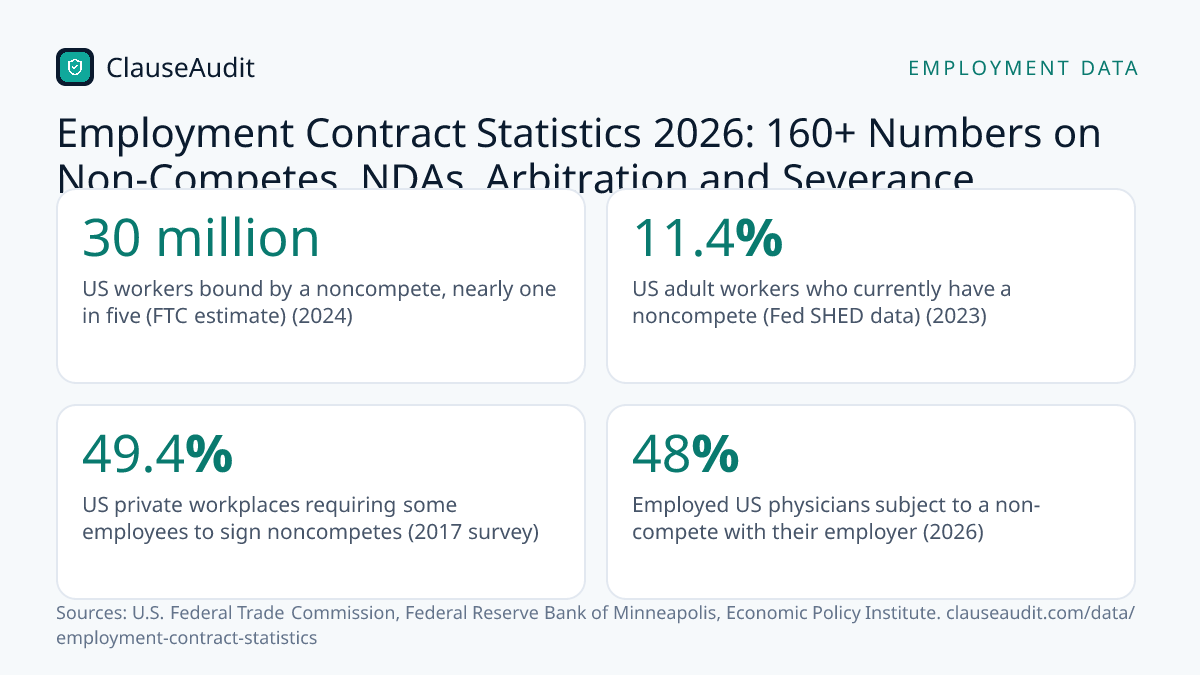
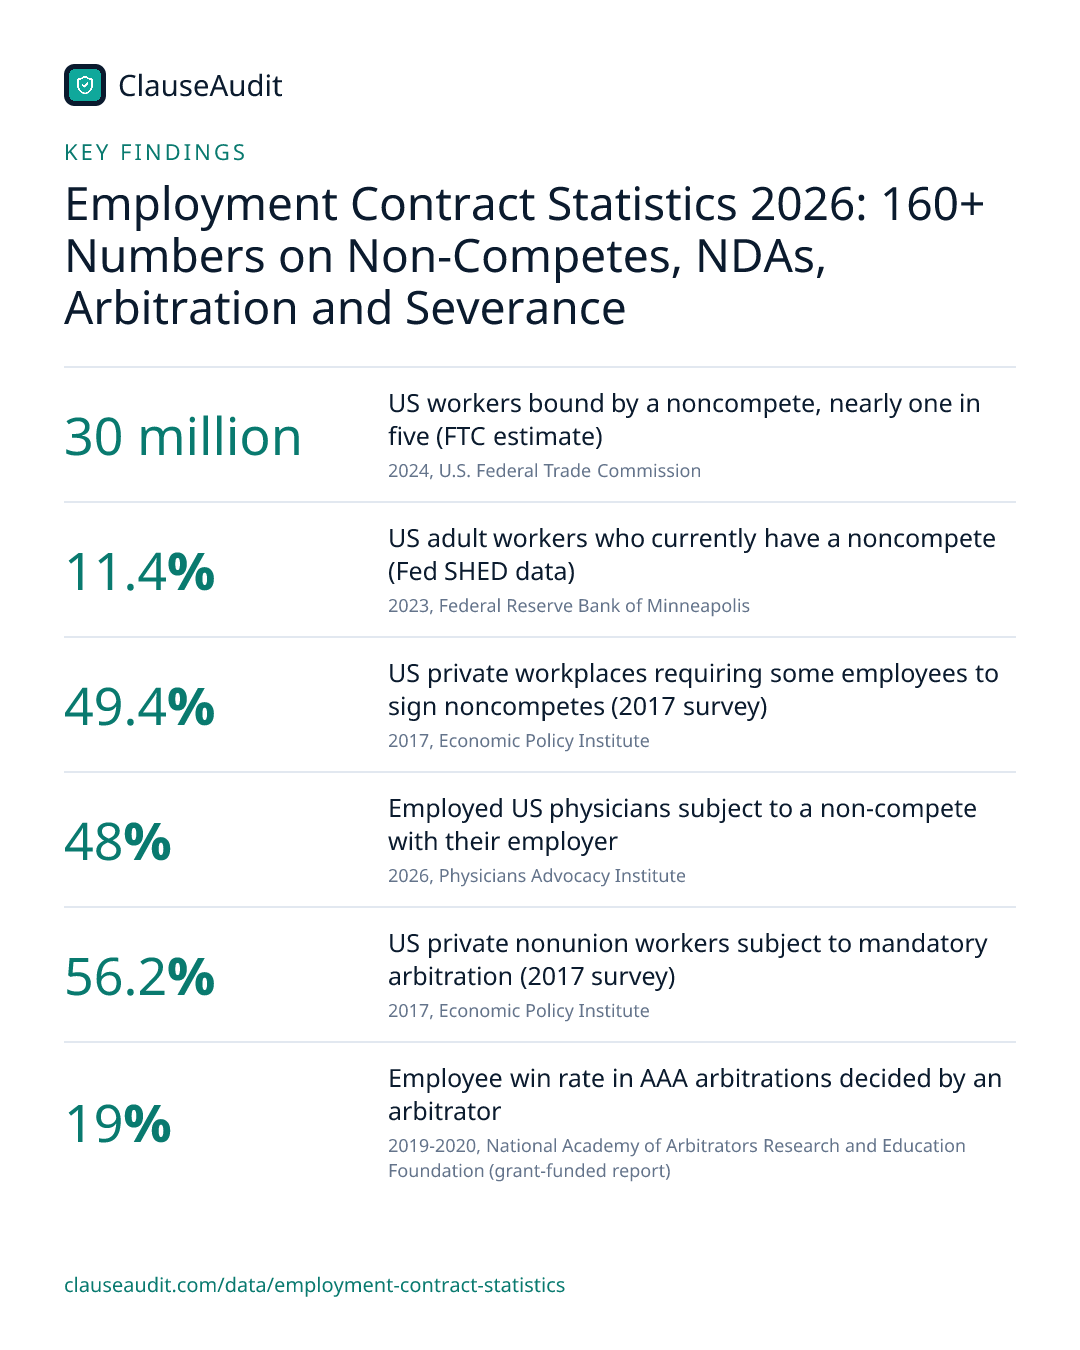
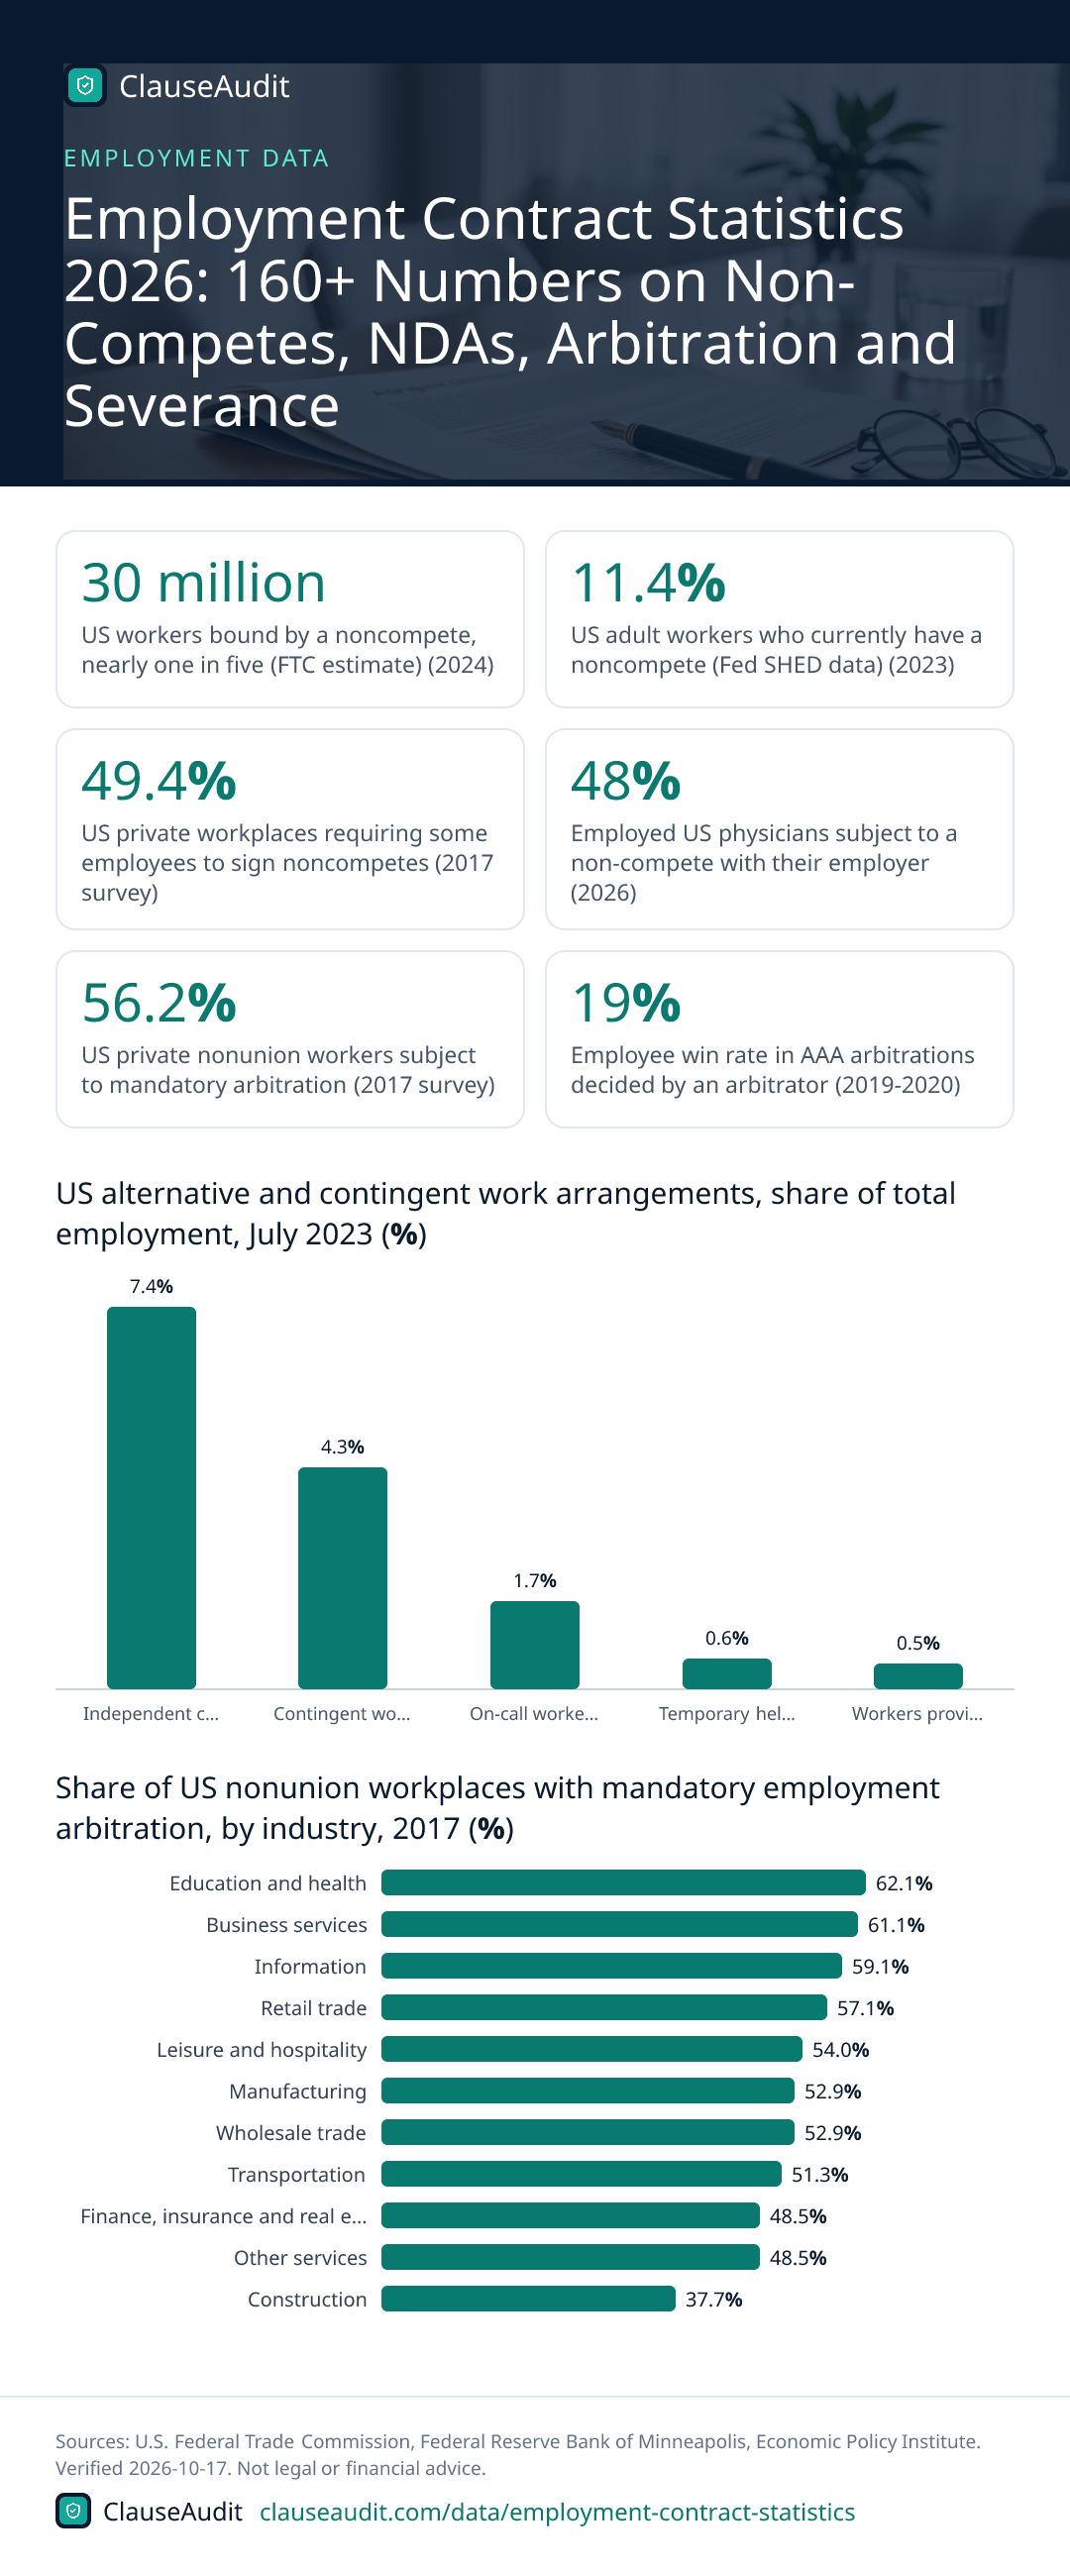
The FTC estimated 30 million US workers were bound by a noncompete in 2024, and Federal Reserve survey data put the share at 11.4% of adult workers. In 2017, 56.2% of private nonunion workers were subject to mandatory arbitration. Employers announced 1,206,374 job cuts in 2025, up 58% on 2024.

- US workers bound by a noncompete, nearly one in five (FTC estimate) (2024, U.S. Federal Trade Commission)
- 30 million
- US adult workers who currently have a noncompete (Fed SHED data) (2023, Federal Reserve Bank of Minneapolis)
- 11.4%
- US private workplaces requiring some employees to sign noncompetes (2017 survey) (2017, Economic Policy Institute)
- 49.4%
- Employed US physicians subject to a non-compete with their employer (2026, Physicians Advocacy Institute)
- 48%
- US private nonunion workers subject to mandatory arbitration (2017 survey) (2017, Economic Policy Institute)
- 56.2%
- Employee win rate in AAA arbitrations decided by an arbitrator (2019-2020, National Academy of Arbitrators Research and Education Foundation (grant-funded report))
- 19%
- US job cuts announced by employers in 2025, up 58% on 2024 (2025, Challenger, Gray & Christmas)
- 1,206,374
- India regular salaried workers with no written job contract (2022, International Labour Organization and Institute for Human Development)
- 61.9%
This page collects more than 160 employment contract statistics in twelve groups: written contracts and work arrangements, how many workers have non-competes, non-competes by industry and pay, state non-compete laws, the economic effects of non-competes, NDAs, mandatory arbitration, arbitration outcomes, severance, executive agreements, IP assignment and non-solicitation, and India.
The figures come from agencies such as the BLS, FTC, EEOC, SEC and GAO, state statutes, Federal Reserve research, academic studies and industry reports. Each one carries its source and period, and the data was checked on October 17, 2026.
Written Employment Contract Statistics: Who Actually Has One
BLS data on work arrangements, tenure and union coverage shows how US workers are employed, from independent contractors and temps to union-covered staff. UK, Australian and survey data add comparison points.
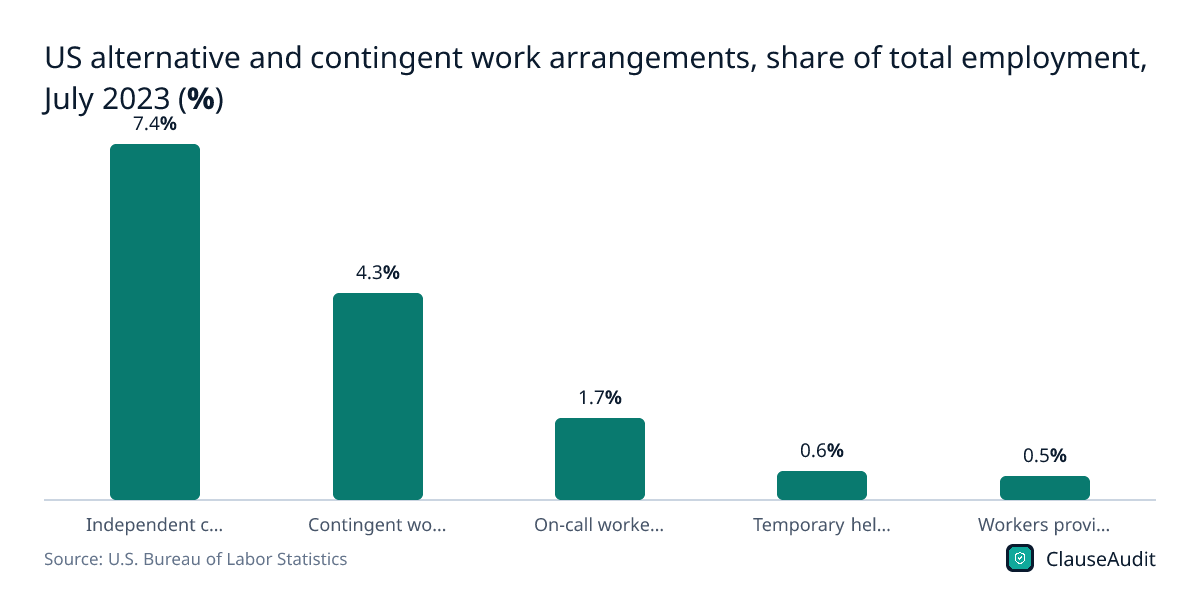
- 6.9 million US workers, or 4.3% of the employed, held contingent jobs (jobs not expected to last) as their sole or main job in July 2023. (U.S. Bureau of Labor Statistics, Contingent and Alternative Employment Arrangements, July 2023, July 2023)
- 11.9 million Americans worked as independent contractors in July 2023, equal to 7.4% of total US employment. (U.S. Bureau of Labor Statistics, Contingent and Alternative Employment Arrangements, July 2023, July 2023)
- 84.6% of US independent contractors on their sole or main job were self-employed rather than on an employer payroll in July 2023. (U.S. Bureau of Labor Statistics, Contingent and Alternative Employment Arrangements, July 2023, July 2023)
- 2.8 million US workers were on-call workers who report only when needed, 1.7% of total employment in July 2023. (U.S. Bureau of Labor Statistics, Contingent and Alternative Employment Arrangements, July 2023, July 2023)
- 945,000 Americans worked through temporary help agencies in July 2023, just 0.6% of total employment. (U.S. Bureau of Labor Statistics, Contingent and Alternative Employment Arrangements, July 2023, July 2023)
- 44.8% of US contingent workers said they would have preferred a permanent job, versus 40.8% who preferred their contingent arrangement. (U.S. Bureau of Labor Statistics, Contingent and Alternative Employment Arrangements, July 2023, July 2023)
- 4.1 years was the median time US wage and salary workers had been with their current employer in January 2026, up from 3.9 years in 2024. (U.S. Bureau of Labor Statistics, Employee Tenure in January 2026, January 2026)
- 3.9 years was the median employer tenure of US private-sector employees in January 2026, well below the 5.6 years in the public sector. (U.S. Bureau of Labor Statistics, Employee Tenure in January 2026, January 2026)
- 16.5 million US wage and salary workers were represented by a union in 2025, including nonmembers covered by union contracts. (U.S. Bureau of Labor Statistics, Union Members, 2025, 2025)
- 3.7% of Australian employees were employed on a fixed-term contract in August 2025. (Australian Bureau of Statistics, Working arrangements, August 2025, August 2025)
- 19% of Australian employees, 2.4 million people, were employed on a casual basis in August 2025. (Australian Bureau of Statistics, Working arrangements, August 2025, August 2025)
- 74.9M Americans now earn income independently, according to MBO Partners' 2026 State of Independence report. (MBO Partners, 2026 State of Independence Report, 2026 report)
- 16% of US adults had ever earned money from an online gig platform as of a 2021 Pew Research Center survey. (Pew Research Center, The State of Gig Work in 2021, August 2021)
- 1.23 million UK workers were on a zero-hours contract in their main job in April to June 2026, 3.6% of people in employment. (Office for National Statistics, EMP17: People in employment on zero hours contracts (August 2026 edition, Table 1), April-June 2026)
Figure 1: US alternative and contingent work arrangements, share of total employment, July 2023 (%)
Chart data
| Label | Value (%) |
|---|---|
| Independent contractors | 7.4% |
| Contingent workers | 4.3% |
| On-call workers | 1.7% |
| Temporary help agency workers | 0.6% |
| Workers provided by contract firms | 0.5% |
Non-Compete Agreement Statistics: How Many Workers Are Bound
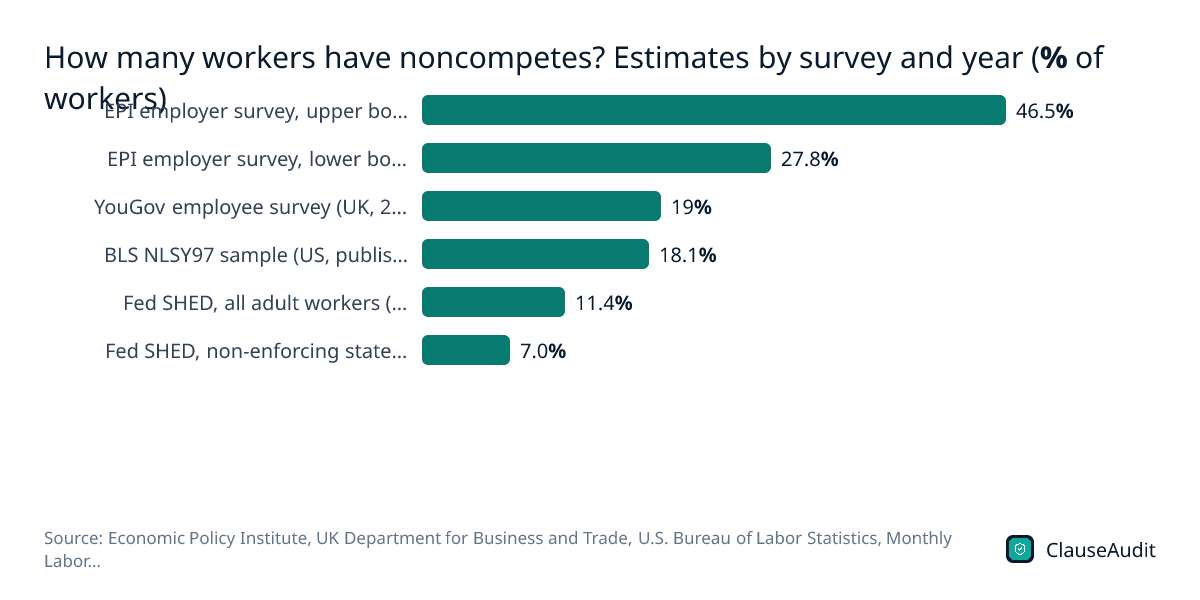
Estimates of how many workers have non-competes depend on who is asked. Employer surveys, worker surveys and federal agency estimates give different numbers, from 11.4% of adult workers to as much as 46.5% of private-sector workers.
- 30 million U.S. workers, nearly one in five Americans, were estimated to be bound by a noncompete when the FTC issued its 2024 rule. (U.S. Federal Trade Commission, FTC Announces Rule Banning Noncompetes, April 2024)
- 11.4% of U.S. adult workers currently had a noncompete in Federal Reserve household survey data analyzed by the Minneapolis Fed in 2023. (Federal Reserve Bank of Minneapolis, New data on non-compete contracts and what they mean for workers, June 2023)
- 7.0% of workers in California, North Dakota and Oklahoma, which do not enforce noncompetes, still had one, versus 12.0% in the other 47 states, in 2022 Federal Reserve survey data (Minneapolis Fed, 2023). (Federal Reserve Bank of Minneapolis, New data on non-compete contracts and what they mean for workers, June 2023)
- 13.2% of U.S. workers aged 35 to 44 reported having a noncompete, compared with only 7.3% of workers aged 65 to 74, in 2022 Federal Reserve survey data (Minneapolis Fed, 2023). (Federal Reserve Bank of Minneapolis, New data on non-compete contracts and what they mean for workers, June 2023)
- 18 percent of workers in the BLS National Longitudinal Survey of Youth 1997 sample were covered by a noncompete, a 2022 Monthly Labor Review study found. (U.S. Bureau of Labor Statistics, Monthly Labor Review, Noncompete agreements, bargaining, and wages: evidence from the National Longitudinal Survey of Youth 1997 (Rothstein and Starr), June 2022)
- 32 percent of top-decile earners ($45+ an hour) in the NLSY97 had a noncompete in a 2022 BLS study, versus 9 to 11 percent in the bottom two deciles. (U.S. Bureau of Labor Statistics, Monthly Labor Review, Noncompete agreements, bargaining, and wages: evidence from the National Longitudinal Survey of Youth 1997 (Rothstein and Starr), June 2022)
- 49.4% of U.S. private-sector establishments in a 2017 national survey required at least some employees to sign a noncompete. (Economic Policy Institute, Noncompete agreements: Ubiquitous, harmful to wages and to competition (Colvin and Shierholz), 2017 survey (published December 2019))
- 31.8% of surveyed U.S. establishments required every employee to sign a noncompete, regardless of pay or job duties, in a 2017 national employer survey. (Economic Policy Institute, Noncompete agreements: Ubiquitous, harmful to wages and to competition (Colvin and Shierholz), 2017 survey (published December 2019))
- 27.8% to 46.5% of U.S. private-sector workers, or 36 million to 60 million people, were estimated to be under noncompetes based on a 2017 employer survey. (Economic Policy Institute, Noncompete agreements: Ubiquitous, harmful to wages and to competition (Colvin and Shierholz), 2017 survey (published December 2019))
- 29.0% of surveyed U.S. workplaces with average pay under $13.00 an hour required all their workers to sign noncompetes in 2017. (Economic Policy Institute, Noncompete agreements: Ubiquitous, harmful to wages and to competition (Colvin and Shierholz), 2017 survey (published December 2019))
- 55.4% of private employers responding to GAO's 2022 survey (247 of 446) said they use noncompetes for at least some workers; the survey is not generalizable. (U.S. Government Accountability Office, Noncompete Agreements: Use Is Widespread to Protect Business' Interests (GAO-23-103785), 2022 survey (published May 2023))
- Over half of employers using noncompetes in GAO's 2022 survey said all of their hourly and part-time workers were bound by one. (U.S. Government Accountability Office, Noncompete Agreements: Use Is Widespread to Protect Business' Interests (GAO-23-103785), 2022 survey (published May 2023))
- 19% of UK employees, an estimated 5.6 million people in Great Britain, said their contract contained a non-compete clause in a 2022 government-commissioned YouGov survey. (UK Department for Business and Trade, Non-compete clauses: impact assessment, April-May 2022 survey (published May 2023))
Figure 2: How many workers have noncompetes? Estimates by survey and year (% of workers)
Chart data
| Label | Value |
|---|---|
| EPI employer survey, upper bound (US, 2017) | 46.5% |
| EPI employer survey, lower bound (US, 2017) | 27.8% |
| YouGov employee survey (UK, 2022) | 19% |
| BLS NLSY97 sample (US, published 2022) | 18.1% |
| Fed SHED, all adult workers (US, published 2023) | 11.4% |
| Fed SHED, non-enforcing states CA/ND/OK (US, published 2023) | 7.0% |
Non-Compete Use by Industry, Wage Level and Occupation
Non-competes are more common in higher-paid, more educated work, but they also reach hourly service jobs, as recent FTC enforcement actions show.
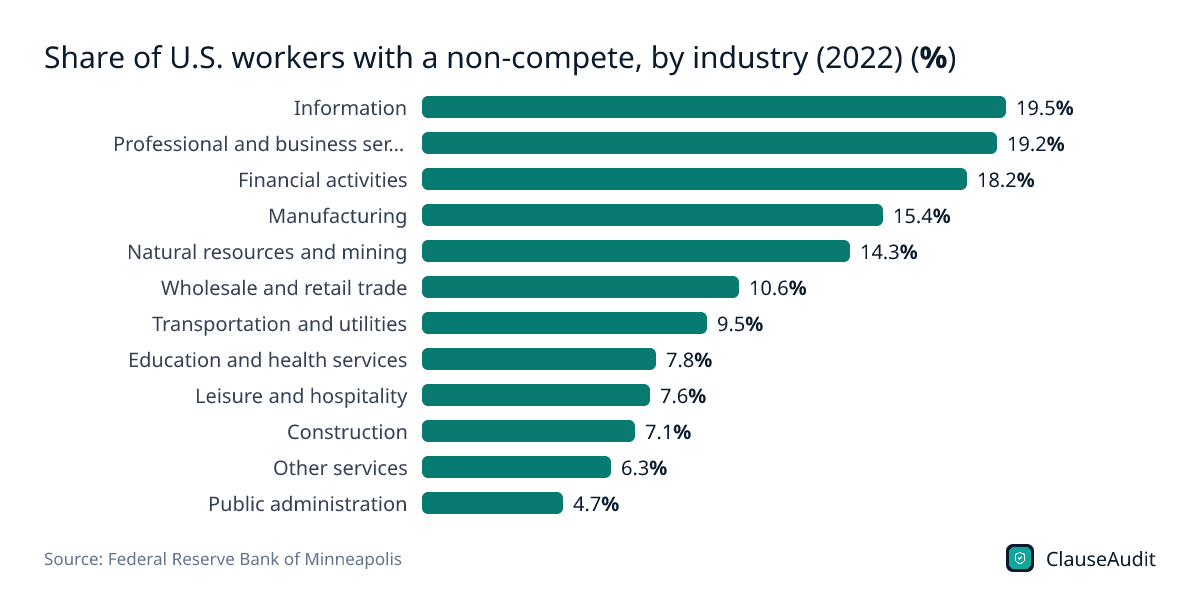
- 19.5% of U.S. workers in the information industry reported having a non-compete in 2022 Federal Reserve survey data, the highest of any industry. (Federal Reserve Bank of Minneapolis, New data on non-compete contracts and what they mean for workers, 2022)
- 19.2% of U.S. professional services workers and 18.2% of finance workers had non-competes in 2022, per a Minneapolis Fed analysis of Federal Reserve survey data. (Federal Reserve Bank of Minneapolis, New data on non-compete contracts and what they mean for workers, 2022)
- 4.7% of U.S. public administration workers had non-competes in 2022, versus 7.1% in construction and 7.8% in education, among the lowest industry rates. (Federal Reserve Bank of Minneapolis, New data on non-compete contracts and what they mean for workers, 2022)
- 15.6% of U.S. workers with family income of $100,000 or more had a non-compete in 2022, versus 9% of those earning under $25,000. (Federal Reserve Bank of Minneapolis, New data on non-compete contracts and what they mean for workers, 2022)
- 15.4% of U.S. workers with a bachelor's degree or more had a non-compete in 2022, compared with 5.9% of those with only a high school diploma or GED. (Federal Reserve Bank of Minneapolis, New data on non-compete contracts and what they mean for workers, 2022)
- 48% of employed U.S. physicians said they are subject to a non-compete agreement with their current employer in a 2026 survey of 1,003 physicians. (Physicians Advocacy Institute, Corporate Ownership's Impact on Physicians' Practice Experience: 2026 PAI Employed Physician Survey, April-May 2026)
- About 45% of U.S. workplaces where the typical worker has a college degree used non-competes for all employees, per a 2017 establishment survey analysed by EPI. (Economic Policy Institute, Noncompete agreements: Ubiquitous, harmful to wages and to competition (Colvin and Shierholz), 2017)
- More than 18,000 pest-control employees at Rollins, including technicians and customer-service representatives, would be freed from noncompetes under an FTC proposed order announced in April 2026. (U.S. Federal Trade Commission, FTC Takes Action Against Noncompete Agreements, Securing Protections for Workers, 2026)
- Nearly 1,800 employees of Gateway Services, the largest U.S. pet cremation business, would be freed from one-year nationwide noncompetes under an FTC proposed order in September 2025. (U.S. Federal Trade Commission, FTC Takes Action to Protect Workers from Noncompete Agreements, 2025)
- 13 other pest-control companies received FTC noncompete warning letters alongside the Rollins action, a sign of industry-wide use in low-wage service work. (U.S. Federal Trade Commission, FTC Takes Action Against Noncompete Agreements, Securing Protections for Workers, 2026)
- Over 40% of UK workers in ICT and in professional and scientific services believe they have a non-compete clause, the highest sector rates the CMA found. (UK Competition and Markets Authority, CMA response to working paper on options for reform of non-compete clauses in employment contracts, 2024)
- 20% to 30% of UK workers even in lower-paid jobs believe they are covered by a non-compete, with such clauses slightly more common in higher-paid jobs (CMA survey, 2023). (UK Competition and Markets Authority, Competition and market power in UK labour markets, 2023 survey (published January 2024))
Figure 3: Share of U.S. workers with a non-compete, by industry (2022) (%)
Chart data
| Label | Value |
|---|---|
| Information | 19.5% |
| Professional and business services | 19.2% |
| Financial activities | 18.2% |
| Manufacturing | 15.4% |
| Natural resources and mining | 14.3% |
| Wholesale and retail trade | 10.6% |
| Transportation and utilities | 9.5% |
| Education and health services | 7.8% |
| Leisure and hospitality | 7.6% |
| Construction | 7.1% |
| Other services | 6.3% |
| Public administration | 4.7% |
Non-Compete Laws by State: Bans, Income Thresholds and the FTC Rule
With the FTC dropping its defense of the federal rule in 2025, state law decides whether a non-compete can be enforced. States now range from full bans to income thresholds to Florida's pro-enforcement statute.
- $524 per year was the FTC's 2024 estimate of the added earnings for the average worker under its nationwide non-compete ban. (U.S. Federal Trade Commission, FTC Announces Rule Banning Noncompetes, April 2024)
- 8,500 additional new businesses a year were projected by the FTC from banning non-competes, from business formation growing 2.7% per year. (U.S. Federal Trade Commission, FTC Announces Rule Banning Noncompetes, April 2024)
- 3-1 was the FTC vote in September 2025 to dismiss its appeals and accept vacatur of the non-compete rule, ending the federal ban. (U.S. Federal Trade Commission, Federal Trade Commission Files to Accede to Vacatur of Non-Compete Clause Rule, September 2025)
- $126,858.83 is Washington's 2026 annual earnings threshold; non-competes with employees earning less are void, up from $116,593.18 in 2023. (Washington State Department of Labor & Industries, Non-Compete Agreements (earnings thresholds), 2026)
- $317,147.09 is Washington's 2026 earnings threshold for enforcing a non-compete against an independent contractor. (Washington State Department of Labor & Industries, Non-Compete Agreements (earnings thresholds), 2026)
- June 30, 2027 is when Washington's amended statute makes all noncompetition covenants void and unenforceable, regardless of when the parties entered them. (Washington State Legislature, RCW 49.62.020 Noncompetition covenants: when void and unenforceable, Effective June 30, 2027)
- $5,000 per worker or prospective worker is the penalty in Colorado for violating Colorado's restrictive covenant law, in effect since August 2022. (Colorado General Assembly, HB22-1317 Restrictive Employment Agreements, Effective August 10, 2022)
- 150% of the state minimum wage is Maryland's earnings floor; non-competes for employees earning at or below it are null and void. (Maryland General Assembly, Maryland Code, Labor and Employment 3-716, Current law)
- $350,000 in total annual compensation is the Maryland cutoff below which non-competes for licensed direct-patient-care health workers are void. (Maryland General Assembly, Maryland Code, Labor and Employment 3-716, Current law)
- 400% of the federal poverty level is Maine's wage floor; employers may not require non-competes from workers earning at or below it. (Maine Legislature, 26 M.R.S. 599-A Restrictions on noncompete agreements, Current law)
- $10,000 per violation is Virginia's civil penalty for employers who use non-competes with low-wage employees earning under the state average weekly wage. (Virginia General Assembly (Legislative Information System), Code of Virginia 40.1-28.7:8 Prohibiting noncompete agreements for low-wage employees, Current law)
- 4 years is the maximum non-compete period under Florida's 2025 CHOICE Act for covered employees earning over twice their county's annual mean wage. (Florida Legislature, Florida Statutes 542.43 Definitions (CHOICE Act), Effective July 1, 2025)
- 7 days is the minimum time Florida employers must give a covered employee to review a CHOICE Act non-compete before the offer expires. (Florida Legislature, Florida Statutes 542.45 Covered noncompete agreements, Effective July 1, 2025)
- $151,164 in total annual compensation defined a 'senior executive' under the FTC's 2024 non-compete rule, which a federal court blocked and the FTC later stopped defending. (Federal Trade Commission, Noncompete Rule (rule page and status), 2024)
- Over 25,000 of the more than 26,000 public comments on the FTC's proposed rule supported a categorical ban on non-competes. (Federal Trade Commission (Federal Register, via GovInfo), Non-Compete Clause Rule, final rule (89 FR 38342), 2023 comment period (rule published May 2024))
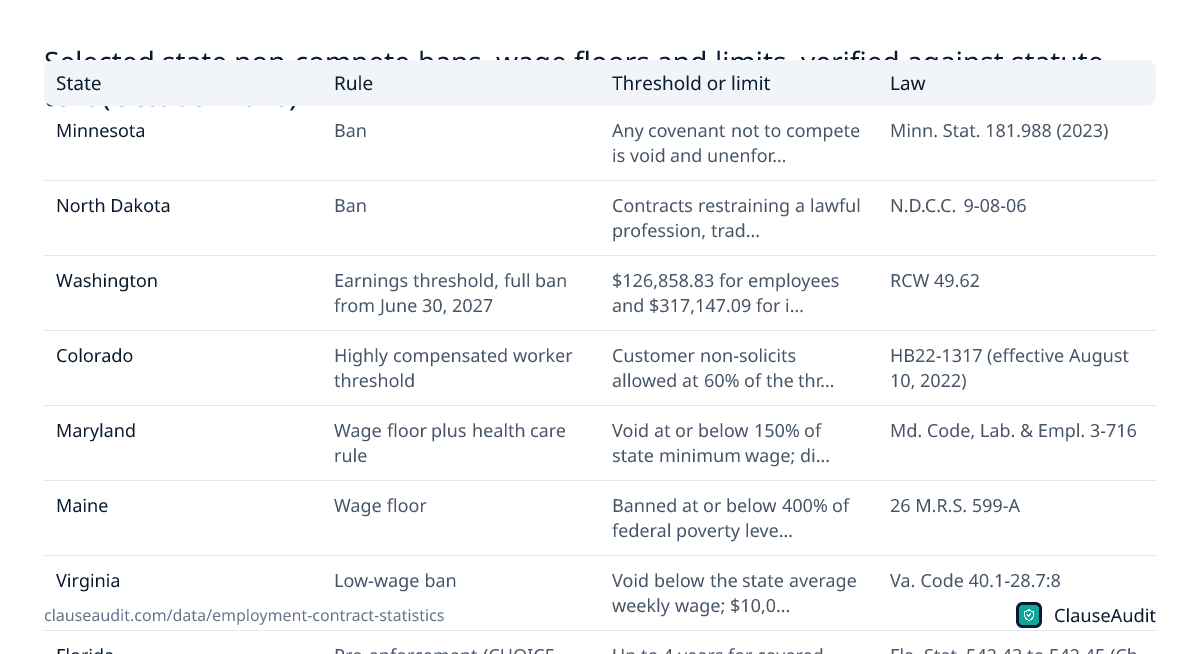
| State | Rule | Threshold or limit | Law |
|---|---|---|---|
| Minnesota | Ban | Any covenant not to compete is void and unenforceable (sale-of-business and dissolution exceptions) | Minn. Stat. 181.988 (2023) |
| North Dakota | Ban | Contracts restraining a lawful profession, trade or business are void (sale-of-goodwill and dissolution exceptions) | N.D.C.C. 9-08-06 |
| Washington | Earnings threshold, full ban from June 30, 2027 | $126,858.83 for employees and $317,147.09 for independent contractors (2026); over 18 months presumed unreasonable | RCW 49.62 |
| Colorado | Highly compensated worker threshold | Customer non-solicits allowed at 60% of the threshold; $5,000 penalty per worker | HB22-1317 (effective August 10, 2022) |
| Maryland | Wage floor plus health care rule | Void at or below 150% of state minimum wage; direct patient care at or below $350,000; above that, max 1 year and 10 miles | Md. Code, Lab. & Empl. 3-716 |
| Maine | Wage floor | Banned at or below 400% of federal poverty level; 3 business days notice; not effective until 1 year of employment | 26 M.R.S. 599-A |
| Virginia | Low-wage ban | Void below the state average weekly wage; $10,000 civil penalty per violation | Va. Code 40.1-28.7:8 |
| Florida | Pro-enforcement (CHOICE Act) | Up to 4 years for covered employees earning over twice the county annual mean wage; at least 7 days to review | Fla. Stat. 542.43 to 542.45 (Ch. 2025-213) |
Economic Impact of Non-Competes: Wages, Mobility and Startups
Economists measure what happens to pay, job changes and new businesses when states make non-competes easier or harder to enforce. These figures are estimates from academic and government studies.
- 3.5% to 13.7% higher average earnings for all U.S. workers is the projected effect of making noncompetes unenforceable nationwide, according to an NBER study revised in 2024. (National Bureau of Economic Research, The Labor Market Effects of Legal Restrictions on Worker Mobility (NBER Working Paper 31929; Johnson, Lavetti and Lipsitz), December 2024)
- Approximately 2% lower average earnings follow a move from the 25th to the 75th percentile of state noncompete enforceability, NBER researchers estimate. (National Bureau of Economic Research, The Labor Market Effects of Legal Restrictions on Worker Mobility (NBER Working Paper 31929; Johnson, Lavetti and Lipsitz), December 2024)
- 3.8% fewer within-industry job changes occur in high-noncompete-use industries when enforceability rises from the 25th to the 75th percentile, the same NBER study finds. (National Bureau of Economic Research, The Labor Market Effects of Legal Restrictions on Worker Mobility (NBER Working Paper 31929; Johnson, Lavetti and Lipsitz), December 2024)
- 16-18% decline in citation-weighted patenting follows an average-sized increase in noncompete enforceability, according to a 2024 NBER innovation study. (National Bureau of Economic Research, Innovation, Inventor Mobility, and the Enforceability of Noncompete Agreements (NBER Working Paper 31487; Johnson, Lipsitz and Pei), December 2024)
- 3.1% fewer new businesses form after an average-sized increase in noncompete enforceability, the same NBER innovation study estimates. (National Bureau of Economic Research, Innovation, Inventor Mobility, and the Enforceability of Noncompete Agreements (NBER Working Paper 31487; Johnson, Lipsitz and Pei), December 2024)
- 7.0% less job creation at new businesses follows an average-sized increase in noncompete enforceability, suggesting stricter rules also slow startup growth. (National Bureau of Economic Research, Innovation, Inventor Mobility, and the Enforceability of Noncompete Agreements (NBER Working Paper 31487; Johnson, Lipsitz and Pei), December 2024)
- 11 percent higher job mobility and 4 percent higher new-hire wages followed Hawaii's 2015 noncompete ban for tech workers, a 2022 Journal of Human Resources study found. (Journal of Human Resources (University of Wisconsin Press), Locked In? The Enforceability of Covenants Not to Compete and the Careers of High-Tech Workers (Balasubramanian et al.), April 2022)
- 4.6 percent lower cumulative earnings after eight years for tech workers who start in an average-enforcement state rather than a non-enforcing one, per the 2022 study. (Journal of Human Resources (University of Wisconsin Press), Locked In? The Enforceability of Covenants Not to Compete and the Careers of High-Tech Workers (Balasubramanian et al.), April 2022)
- 4.3 percent higher physician prices result from a 10 percent increase in noncompete enforceability, according to a 2021 study of 1996-2007 data. (American Economic Journal: Applied Economics (American Economic Association), Physician Practice Organization and Negotiated Prices: Evidence from State Law Changes (Hausman and Lavetti), April 2021 (1996-2007 data))
- Up to $194 billion in lower U.S. health care costs over a decade was the FTC's 2024 estimate of the benefit of its noncompete ban rule. (U.S. Federal Trade Commission, FTC Announces Rule Banning Noncompetes, April 2024)
- About 25 percent more pay for noncompete-bound NLSY97 workers shrinks to 5.0 percent once advanced worker and job controls are added, a 2022 BLS Monthly Labor Review study found. (U.S. Bureau of Labor Statistics, Monthly Labor Review, Noncompete agreements, bargaining, and wages: evidence from the National Longitudinal Survey of Youth 1997 (Rothstein and Starr), June 2022)
- 10 percentage points more likely to ask for a raise or promotion, and 7 points more likely to apply for new jobs, were U.S. workers with noncompetes in 2023 Minneapolis Fed analysis. (Federal Reserve Bank of Minneapolis, New data on non-compete contracts and what they mean for workers, June 2023)
- At least 400,000 UK employees would be working for a competitor or running a competing business if not for their non-compete clause, the UK government estimated in 2023. (UK Department for Business and Trade, Non-compete clauses: impact assessment, May 2023)
- About 1.4 percent lower wages followed a one-standard-deviation increase in state non-compete enforcement, a 2016 U.S. Treasury analysis of 2014 Current Population Survey data found. (U.S. Department of the Treasury, Office of Economic Policy, Non-compete Contracts: Economic Effects and Policy Implications, 2014 data (published March 2016))
- 10 percent lower wages at age 50 in a maximally enforcing state than a minimally enforcing one, versus 5 percent at age 25, per the 2016 Treasury analysis. (U.S. Department of the Treasury, Office of Economic Policy, Non-compete Contracts: Economic Effects and Policy Implications, 2014 data (published March 2016))
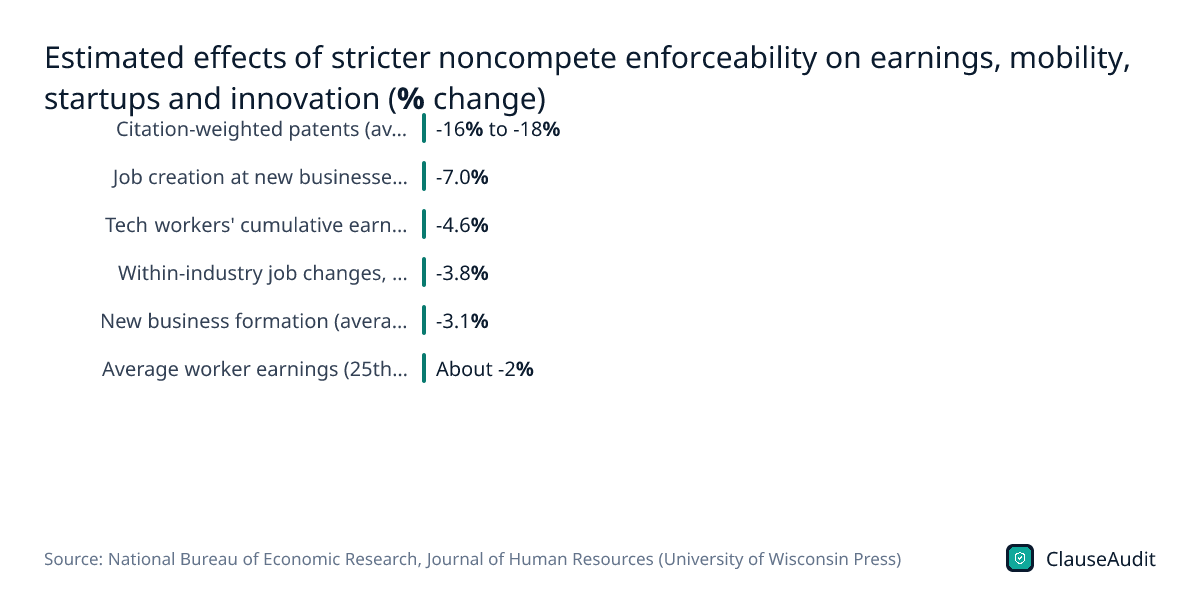
Figure 5: Estimated effects of stricter noncompete enforceability on earnings, mobility, startups and innovation (% change)
Chart data
| Label | Value |
|---|---|
| Citation-weighted patents (average-sized increase) | -16% to -18% |
| Job creation at new businesses (average-sized increase) | -7.0% |
| Tech workers' cumulative earnings after 8 years (average vs non-enforcing state) | -4.6% |
| Within-industry job changes, high-use industries (25th to 75th percentile) | -3.8% |
| New business formation (average-sized increase) | -3.1% |
| Average worker earnings (25th to 75th percentile) | About -2% |
NDA Statistics: Confidentiality and Non-Disclosure Agreements at Work
Few surveys count workplace NDAs directly, so this section draws on federal and state laws that limit them, EEOC charge data and regulator findings on agreements that kept employees from reporting misconduct.
- 2022 is when the federal Speak Out Act made pre-dispute NDAs and non-disparagement clauses unenforceable in sexual assault and sexual harassment disputes. (U.S. Government Publishing Office (govinfo), Speak Out Act, Public Law 117-224, December 7, 2022)
- $10,000 in statutory damages, or actual damages if higher, is what Washington employers owe for NDA terms that gag workers about discrimination, harassment or wage violations. (Washington State Legislature, RCW 49.44.211: Nondisclosure and nondisparagement provisions, 2022)
- Seven public companies settled SEC charges in September 2024 over employment, separation and other agreements that impeded employees from reporting misconduct to the SEC. (U.S. Securities and Exchange Commission, SEC Charges Seven Public Companies with Violations of Whistleblower Protection Rule, September 2024)
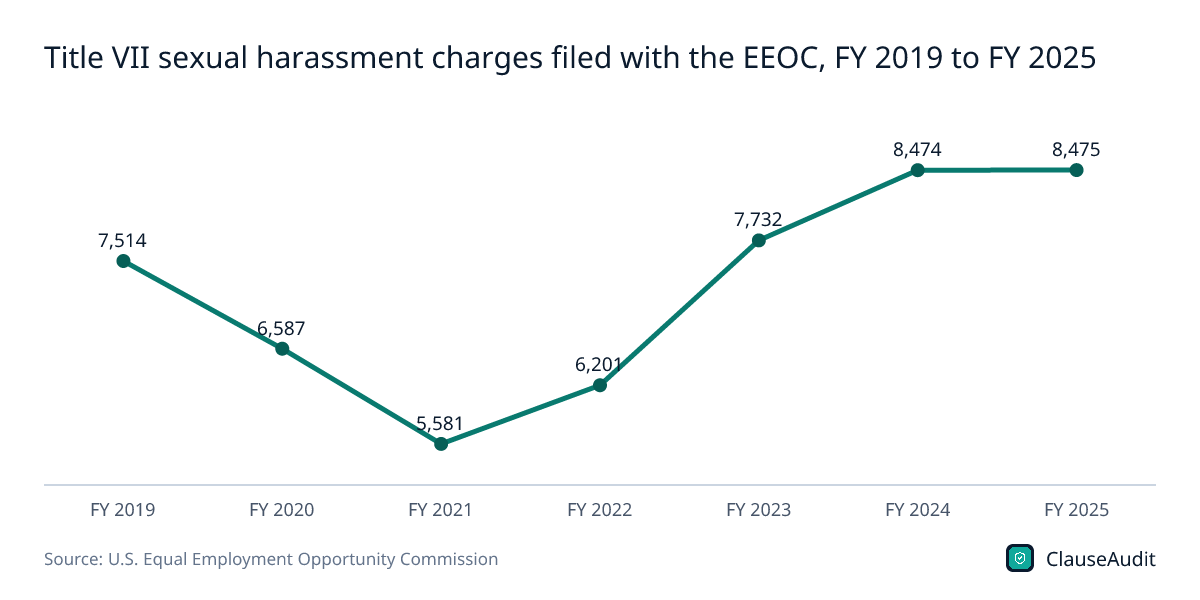
- 8,475 Title VII sexual harassment charges were filed with the EEOC in fiscal 2025, up from 5,581 in fiscal 2021. (U.S. Equal Employment Opportunity Commission, Table E2c. Title VII Sexual Harassment Charge Receipts and Resolutions by Type of Resolution FY 2010 - FY 2025, FY 2025)
- 33% of employed U.S. physicians reported being subject to a nondisclosure agreement with their current employer in a 2026 Physicians Advocacy Institute survey. (Physicians Advocacy Institute, Corporate Ownership's Impact on Physicians' Practice Experience: 2026 PAI Employed Physician Survey, April-May 2026)
- 865 EEOC sexual harassment charges were resolved by settlement in fiscal 2025, about 10% of the 8,689 resolutions that year. (U.S. Equal Employment Opportunity Commission, Table E2c. Title VII Sexual Harassment Charge Receipts and Resolutions by Type of Resolution FY 2010 - FY 2025, FY 2025)
- $86.12 million in monetary benefits was obtained for sexual harassment charges through the EEOC administrative process in fiscal 2025, excluding litigation. (U.S. Equal Employment Opportunity Commission, Table E2c. Title VII Sexual Harassment Charge Receipts and Resolutions by Type of Resolution FY 2010 - FY 2025, FY 2025)
- 984 UK wholesale financial firms answered the FCA's survey on non-financial misconduct, including use of confidentiality agreements, covering 2021 to 2023. (UK Financial Conduct Authority, Culture and non-financial misconduct survey: findings, 2021-2023)
- 23% of discrimination cases at surveyed UK financial firms ended with the complainant signing a settlement or confidentiality agreement, the highest of any misconduct type. (UK Financial Conduct Authority, Culture and non-financial misconduct survey: findings, 2021-2023)
- 124 confidentiality agreements were signed by complainants in discrimination cases at surveyed UK financial firms, versus 42 in bullying and harassment cases. (UK Financial Conduct Authority, Culture and non-financial misconduct survey: findings, 2021-2023)
- 1 October 2025 is when UK NDAs became unenforceable to the extent they stop crime victims from speaking to police, qualified lawyers or victim support services. (UK Ministry of Justice (GOV.UK), Victims and Prisoners Act 2024: changes to non-disclosure agreements, October 2025)
- 1 August 2025 is when England's Office for Students condition E6 took effect, barring universities from new contract terms that stop students disclosing harassment or misconduct. (Office for Students (England), Condition E6: Harassment and sexual misconduct, August 2025)
- Almost one third of the roughly 90,000 charges filed with the EEOC in fiscal 2015 included a workplace harassment allegation, the EEOC's 2016 task force reported. (U.S. Equal Employment Opportunity Commission, Select Task Force on the Study of Harassment in the Workplace: Report of Co-Chairs, FY2015 (published June 2016))
- Approximately 27,000 whistleblower tips were received by the SEC in fiscal 2025, and it awarded more than $60 million to 48 individual whistleblowers. (U.S. Securities and Exchange Commission, Office of the Whistleblower Annual Report to Congress for Fiscal Year 2025, FY2025)
Figure 6: Title VII sexual harassment charges filed with the EEOC, FY 2019 to FY 2025
Chart data
| Label | Value |
|---|---|
| FY 2019 | 7,514 |
| FY 2020 | 6,587 |
| FY 2021 | 5,581 |
| FY 2022 | 6,201 |
| FY 2023 | 7,732 |
| FY 2024 | 8,474 |
| FY 2025 | 8,475 |
Mandatory Arbitration Statistics in Employment Contracts
Mandatory arbitration clauses send employment disputes to a private arbitrator instead of a court. The main national estimate comes from a 2017 survey of private-sector workplaces.
- 56.2% of US private-sector nonunion employees were subject to mandatory employment arbitration in a 2017 national establishment survey. (Economic Policy Institute, The growing use of mandatory arbitration (Alexander J.S. Colvin), 2017)
- 60.1 million American workers had lost access to the courts for employment claims because of mandatory arbitration, per a 2017 survey extrapolation. (Economic Policy Institute, The growing use of mandatory arbitration (Alexander J.S. Colvin), 2017)
- 30.1% of US employers requiring mandatory arbitration also included class action waivers in their procedures in 2017. (Economic Policy Institute, The growing use of mandatory arbitration (Alexander J.S. Colvin), 2017)
- 24.7 million US private-sector nonunion workers, 23.1% of them, could not bring a class action over employment rights as of 2017. (Economic Policy Institute, The growing use of mandatory arbitration (Alexander J.S. Colvin), 2017)
- 65.1% of US establishments belonging to companies with 1,000 or more employees used mandatory arbitration in 2017, versus 53.9% of all establishments. (Economic Policy Institute, The growing use of mandatory arbitration (Alexander J.S. Colvin), 2017)
- 64.5% of US workplaces with average pay under $13.00 an hour imposed mandatory arbitration in 2017, the highest of any wage quartile. (Economic Policy Institute, The growing use of mandatory arbitration (Alexander J.S. Colvin), 2017)
- 59.1% of African American workers and 57.6% of female workers were estimated to be subject to mandatory arbitration in 2017. (Economic Policy Institute, The growing use of mandatory arbitration (Alexander J.S. Colvin), 2017)
- 335-97 was the US House vote passing the Ending Forced Arbitration of Sexual Assault and Sexual Harassment Act on February 7, 2022. (Office of the Clerk, U.S. House of Representatives, Roll Call 33, H.R. 4445, February 2022)
- March 3, 2022 is when Public Law 117-90 took effect, letting workers void pre-dispute arbitration of sexual assault and harassment claims. (U.S. Government Publishing Office (govinfo), Public Law 117-90, Ending Forced Arbitration of Sexual Assault and Sexual Harassment Act of 2021, March 2022)
- $1 million is the defense contract size above which contractors may not force employees to arbitrate Title VII or sexual assault and harassment claims. (Acquisition.gov (U.S. General Services Administration), DFARS 222.7402 Policy (arbitration restrictions for defense contractors), Current regulation)
- $350 is the most an employee is asked to pay in AAA filing fees for an employer-mandated employment arbitration case. (American Arbitration Association, Employment Arbitration, 2026)
- $400 is the only fee an employee must pay at JAMS when arbitration is required as a condition of employment; the employer pays the rest. (JAMS, Arbitration Fees, 2026)
- 17 months was the median time to an award in AAA employment arbitrations closed in 2025, versus 34.1 months to trial in US District Court. (American Arbitration Association, Employment Arbitration, 2025)
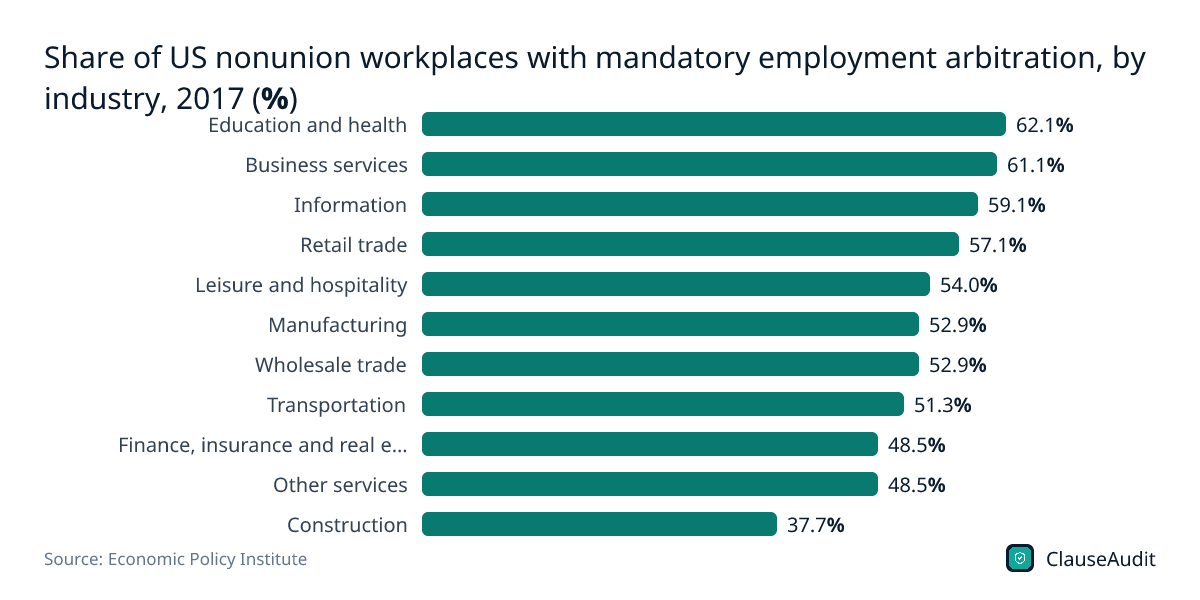
Figure 7: Share of US nonunion workplaces with mandatory employment arbitration, by industry, 2017 (%)
Chart data
| Label | Value |
|---|---|
| Education and health | 62.1% |
| Business services | 61.1% |
| Information | 59.1% |
| Retail trade | 57.1% |
| Leisure and hospitality | 54.0% |
| Manufacturing | 52.9% |
| Wholesale trade | 52.9% |
| Transportation | 51.3% |
| Finance, insurance and real estate | 48.5% |
| Other services | 48.5% |
| Construction | 37.7% |
Employment Arbitration Outcomes: Win Rates, Awards and Mass Arbitration
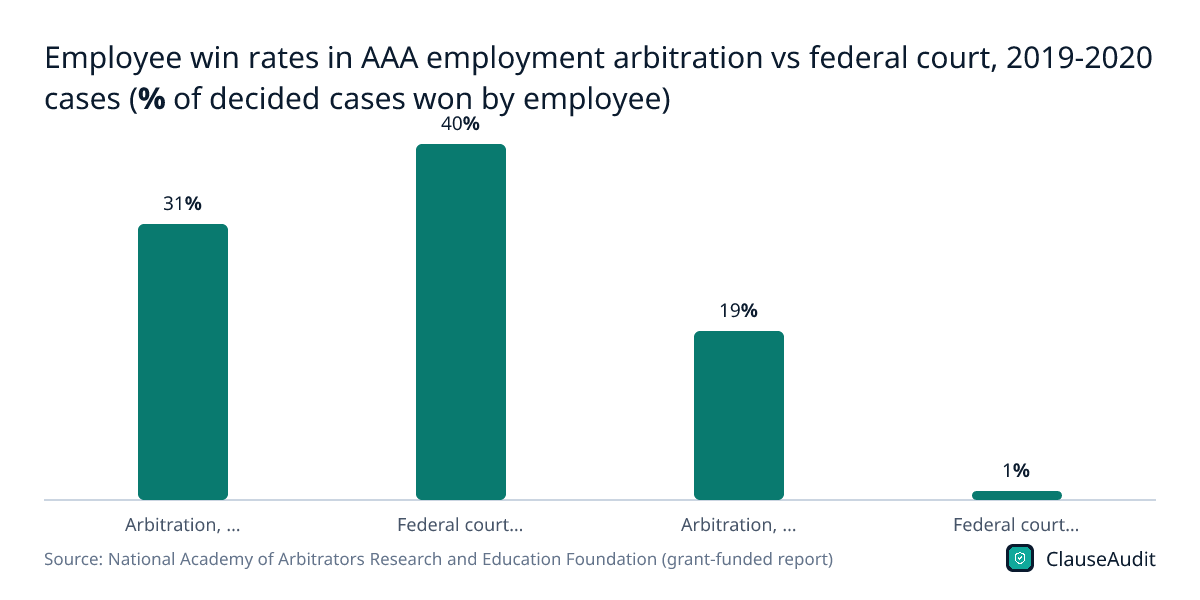
Win rates in arbitration and court are hard to compare because different cases reach a decision in each. Read these figures alongside the study and the years they cover.
- 19% of AAA employment cases decided by an arbitrator in 2019-2020 were won by the employee, versus 1% of federal court cases decided by trial or motion. (National Academy of Arbitrators Research and Education Foundation (grant-funded report), Comparative Analysis of Employment Arbitration and Employment Litigation (Katz, Kochan, Maltby, St. Antoine and Sherwyn), 2019-2020 cases (published November 2023))
- 31% of AAA employment arbitrations decided after a hearing in 2019-2020 went to the employee, compared with 40% of federal employment cases decided at trial. (National Academy of Arbitrators Research and Education Foundation (grant-funded report), Comparative Analysis of Employment Arbitration and Employment Litigation (Katz, Kochan, Maltby, St. Antoine and Sherwyn), 2019-2020 cases (published November 2023))
- $39K was the median damages award in civil rights employment arbitrations in 2019-2020, versus $406K in federal court litigation. (National Academy of Arbitrators Research and Education Foundation (grant-funded report), Comparative Analysis of Employment Arbitration and Employment Litigation (Katz, Kochan, Maltby, St. Antoine and Sherwyn), 2019-2020 cases (published November 2023))
- $24K was the median damages award in Fair Labor Standards Act arbitrations in 2019-2020, versus $123K in federal court litigation. (National Academy of Arbitrators Research and Education Foundation (grant-funded report), Comparative Analysis of Employment Arbitration and Employment Litigation (Katz, Kochan, Maltby, St. Antoine and Sherwyn), 2019-2020 cases (published November 2023))
- 14.8 months was the median time from filing to resolution for employment cases tried in arbitration in 2019-2020, versus 31 months in federal court. (National Academy of Arbitrators Research and Education Foundation (grant-funded report), Comparative Analysis of Employment Arbitration and Employment Litigation (Katz, Kochan, Maltby, St. Antoine and Sherwyn), 2019-2020 cases (published November 2023))
- 80% of AAA employment arbitration cases settled in 2019-2020, compared with a 72% settlement rate for federal employment litigation. (National Academy of Arbitrators Research and Education Foundation (grant-funded report), Comparative Analysis of Employment Arbitration and Employment Litigation (Katz, Kochan, Maltby, St. Antoine and Sherwyn), 2019-2020 cases (published November 2023))
- 37.7% of employment arbitrations ending in awards in 2014-2021 were won by employees, versus 10.8% of federal lawsuits, in a study funded by the U.S. Chamber's legal reform institute. (U.S. Chamber of Commerce Institute for Legal Reform, Fairer, Faster, Better III: An Empirical Assessment of Consumer and Employment Arbitration (ndp | analytics; funded by the U.S. Chamber of Commerce Institute for Legal Reform), 2014-2021 cases (published March 2022))
- $142,332 was the median award to employees who won in arbitration in 2014-2021, versus $68,956 in federal court, according to the same Chamber-funded study. (U.S. Chamber of Commerce Institute for Legal Reform, Fairer, Faster, Better III: An Empirical Assessment of Consumer and Employment Arbitration (ndp | analytics; funded by the U.S. Chamber of Commerce Institute for Legal Reform), 2014-2021 cases (published March 2022))
- 21.4 percent was the employee win rate in AAA mandatory employment arbitrations from 2003 to 2007, a 2015 EPI briefing paper reported, below federal and state court trial rates. (Economic Policy Institute, The arbitration epidemic (EPI Briefing Paper #414; Stone and Colvin), 2003-2007 cases (published December 2015))
- 1 in 10,400 U.S. employees covered by mandatory arbitration actually filed a claim each year, the Economic Policy Institute estimated in 2018. (Economic Policy Institute, The growing use of mandatory arbitration (Alexander J.S. Colvin), April 2018)
- 77% of AAA employment arbitration cases closed in 2025 settled before an award, and 22% settled before any arbitrator compensation was incurred. (American Arbitration Association, Employment Arbitration, Cases closed in 2025)
- About 7% of employment mass-arbitration merits cases closed in 2025 ended in an award, up from about 2% in 2024, versus 9% of individual employment cases. (American Arbitration Association, What 2025 Data Reveals About a Shifting Landscape (mass arbitration), 2024-2025)
- 269 new employment mass-arbitration demands reached the AAA in 2025, after one mass arbitration of about 30,000 cases had inflated 2024 filings. (American Arbitration Association, What 2025 Data Reveals About a Shifting Landscape (mass arbitration), 2025)
Figure 8: Employee win rates in AAA employment arbitration vs federal court, 2019-2020 cases (% of decided cases won by employee)
Chart data
| Label | Value (% of decided cases won by employee) |
|---|---|
| Arbitration, decided after hearing | 31% |
| Federal court, decided at trial | 40% |
| Arbitration, all decided cases (hearing or motion) | 19% |
| Federal court, all decided cases (trial or motion) | 1% |
Severance Pay Statistics: Formulas, Weeks of Pay and Releases
US private employers are not required by federal law to pay severance, so the amount is set by contract or company policy. Layoff counts and the rules for releases show when these terms come into play.
- 1,206,374 job cuts were announced by U.S. employers in 2025, up 58% from 761,358 in 2024 and the most since 2020. (Challenger, Gray & Christmas, 2025 Year-End Challenger Report: Highest Q4 Layoffs Since 2008; Lowest YTD Hiring Since 2010, 2025)
- 308,167 announced job cuts came from government in 2025, mostly federal, making it the top source of layoff plans that year. (Challenger, Gray & Christmas, 2025 Year-End Challenger Report: Highest Q4 Layoffs Since 2008; Lowest YTD Hiring Since 2010, 2025)
- 573,195 job cuts were announced by U.S. employers from January through September 2026, down 39% from the first nine months of 2025. (Challenger, Gray & Christmas, Job Cuts Fall in September; Hiring Plans Up 3% Over 2025 On Weak Early Seasonal Hiring, Jan-Sep 2026)
- 3.3 million U.S. workers with at least three years of tenure were displaced from their jobs between January 2023 and December 2025. (U.S. Bureau of Labor Statistics, Worker Displacement: 2023-2025 (Displaced Workers Summary), 2023-2025)
- About 45% of long-tenured displaced U.S. workers received written advance notice that their jobs would end, rising to about 58% in plant or company closings. (U.S. Bureau of Labor Statistics, Worker Displacement: 2023-2025 (Displaced Workers Summary), 2023-2025)
- 1.6 million layoffs and discharges occurred in the U.S. in August 2026, a rate of 1.0% of employment. (U.S. Bureau of Labor Statistics, Job Openings and Labor Turnover Summary, August 2026, August 2026)
- One week of basic pay per year of service for the first 10 years, then two weeks per year after that, is the federal employee severance formula. (U.S. Office of Personnel Management, Fact Sheet: Severance Pay, 2026)
- 2.5% is added to a federal employee's basic severance allowance for each full three months of age over 40. (U.S. Office of Personnel Management, Fact Sheet: Severance Pay, 2026)
- 52 weeks is the lifetime maximum severance pay a U.S. federal employee can receive. (U.S. Office of Personnel Management, Fact Sheet: Severance Pay, 2026)
- 21 days is the minimum time workers 40 and older must get to consider a severance release of age claims, or 45 days in a group layoff. (U.S. Equal Employment Opportunity Commission, Q&A: Understanding Waivers of Discrimination Claims in Employee Severance Agreements, 2026)
- Seven days is the revocation window after signing an age-discrimination waiver, and it cannot be changed or waived by either party. (U.S. Equal Employment Opportunity Commission, Q&A: Understanding Waivers of Discrimination Claims in Employee Severance Agreements, 2026)
- 22% is the federal flat withholding rate on supplemental wages, a category the IRS says includes severance pay; the rate is 37% above $1 million. (Internal Revenue Service, Publication 15 (2026), (Circular E), Employer's Tax Guide, 2026)
- £22,530 is the maximum UK statutory redundancy payment for redundancies on or after 6 April 2026, with weekly pay capped at £751 and service capped at 20 years. (GOV.UK, Redundancy: your rights - Redundancy pay, April 2026)
- 26 weeks of pay is the maximum statutory severance an employer must pay under Ontario's Employment Standards Act in Canada. (Government of Ontario, Your guide to the Employment Standards Act: Severance pay, 2026)
- 5 years of service, at an employer with a global payroll of at least $2.5 million, is the usual route to statutory severance pay in Ontario. (Government of Ontario, Your guide to the Employment Standards Act: Severance pay, 2026)
| Jurisdiction | Formula | Eligibility or adjustment | Cap |
|---|---|---|---|
| U.S. private employers | No federal requirement under the FLSA; severance is set by contract or policy | Not applicable | None set by federal law |
| U.S. federal employees (OPM) | 1 week of basic pay per year of service for the first 10 years, 2 weeks per year after | 12 months' continuous service; +2.5% per full 3 months of age over 40 | 52 weeks in a lifetime |
| United Kingdom (statutory redundancy) | 0.5 week's pay per year under 22, 1 week aged 22-40, 1.5 weeks aged 41+ | 2 years' service | 20 years counted; weekly pay capped at £751; maximum £22,530 (from 6 April 2026) |
| Ontario, Canada (ESA) | Regular weekly wages times completed years of employment (plus months/12) | 5+ years' service and $2.5 million global payroll, or 50+ employees severed in six months on a closure | 26 weeks |
Executive Employment Agreement and CEO Severance Statistics
Executive agreements are shaped by tax rules, proxy adviser policies and SEC clawback rules. Several of these thresholds sit at about three times pay.
- 3 times the base amount, the executive's average pay over the prior 5 taxable years, is the IRS golden parachute threshold for change-in-control payments. (Legal Information Institute, Cornell Law School, 26 U.S. Code 280G Golden parachute payments, Current law)
- 20 percent is the federal excise tax executives owe on excess golden parachute payments, on top of ordinary income tax. (Legal Information Institute, Cornell Law School, 26 U.S. Code 4999 Golden parachute payments (excise tax), Current law)
- 3 times base salary and bonus is the level above which ISS flags new or amended severance or change-in-control payments as problematic in 2026. (ISS (Institutional Shareholder Services), United States Proxy Voting Guidelines, Benchmark Policy Recommendations, Effective February 1, 2026)
- 2.99 times average salary plus bonus is the severance level above which the Council of Institutional Investors says shareholders should ratify executive agreements. (Council of Institutional Investors, CII Policies on Corporate Governance, Current policy)
- three years is the longest term CII says executive employment contracts should run, with a specified termination date and no open-ended rollover. (Council of Institutional Investors, CII Policies on Corporate Governance, Current policy)
- three completed fiscal years of incentive pay must be recoverable from executives after an accounting restatement under SEC Rule 10D-1, adopted October 2022. (U.S. Securities and Exchange Commission, SEC Adopts Compensation Recovery Listing Standards and Disclosure Rules (Press Release 2022-192), October 2022)
- 180 days or more outstanding clawback amounts owed by any current or former named executive officer must be disclosed under the SEC recovery rules. (U.S. Securities and Exchange Commission, Fact Sheet: Recovery of Erroneously Awarded Compensation, October 2022)
- October 2, 2023 is the date on or after which incentive pay received by executives of Nasdaq-listed companies became subject to mandatory clawback policies, under listing standards the SEC approved in June 2023. (U.S. Securities and Exchange Commission (Federal Register), Order Granting Accelerated Approval of Nasdaq Rule 5608 (Recovery of Erroneously Awarded Executive Compensation), 88 FR 39294, October 2023)
- 118 companies reported clawback recovery analysis results in annual reports or proxy statements filed from early 2024 to mid-2026, per Compensia. (Harvard Law School Forum on Corporate Governance, Compensation Clawbacks: Surveying the Disclosures to Date (Compensia), 2024 to mid-2026)
- $10.3 million was the median US CEO golden parachute value in 2023, down 22% from $13.1 million in 2022, according to ISS research. (Harvard Law School Forum on Corporate Governance, Golden Parachutes Face Investor Scrutiny (ISS Corporate Solutions), 2023)
- 61 shareholder proposals seeking a vote on executive severance were filed at Russell 3000 companies from 2020 through August 2023, and 15% passed. (Harvard Law School Forum on Corporate Governance, Golden Parachutes Face Investor Scrutiny (ISS Corporate Solutions), January 2020 to August 2023)
- 15.6% of US say-on-golden-parachute votes failed in 2022, a six-year high, up from 11.8% in 2021. (Harvard Law School Forum on Corporate Governance, U.S. Say-On-Golden Parachute Failure Rate and CEO Golden Parachute Values in 2022 (ISS), 2022)
- 4.7 years was the median tenure of CEOs at the Equilar 500, the largest US public companies by revenue, as of October 2023. (Equilar, Executive Factbook, October 2023)
| Rule or policy | What it governs | Threshold | Source |
|---|---|---|---|
| IRC Section 280G | Golden parachute definition | Payments equal to or above 3 times the base amount (average of most recent 5 taxable years) | 26 U.S.C. 280G |
| IRC Section 4999 | Excise tax on excess parachute payments | 20 percent of the excess payment | 26 U.S.C. 4999 |
| ISS benchmark policy (2026) | Problematic new or amended severance | Generally over 3 times base salary and bonus; single triggers and excise tax gross-ups also flagged | ISS US Proxy Voting Guidelines |
| Council of Institutional Investors | Shareholder ratification of severance | Over 2.99 times average salary plus bonus for the prior three years; contracts no longer than three years | CII Policies on Corporate Governance |
| SEC Rule 10D-1 | Mandatory clawback lookback | Three completed fiscal years before a restatement; pay received on or after October 2, 2023 | SEC Release 2022-192 |
IP Assignment, Non-Solicitation and Other Restrictive Covenant Statistics
Employers give trade secret and client protection as the main reasons for non-competes. Litigation data and no-poach enforcement show how these clauses play out.
- 95% of employers using noncompetes in GAO's 2022 survey cited protecting trade secrets, intellectual property or proprietary information as a reason. (U.S. Government Accountability Office, Noncompete Agreements: Use Is Widespread to Protect Business' Interests (GAO-23-103785), 2022 survey (published May 2023))
- 91% of noncompete-using employers in GAO's 2022 survey said they use them to protect client and customer contacts from departing workers. (U.S. Government Accountability Office, Noncompete Agreements: Use Is Widespread to Protect Business' Interests (GAO-23-103785), 2022 survey (published May 2023))
- 67% of noncompete-using employers in GAO's 2022 survey said they use them to prevent the recruiting of staff, investors or other resources. (U.S. Government Accountability Office, Noncompete Agreements: Use Is Widespread to Protect Business' Interests (GAO-23-103785), 2022 survey (published May 2023))
- 57% of noncompete-using employers in GAO's 2022 survey said they use them to protect research and development spending. (U.S. Government Accountability Office, Noncompete Agreements: Use Is Widespread to Protect Business' Interests (GAO-23-103785), 2022 survey (published May 2023))
- 5.4% less pay goes to employees bound by all four restrictions (nondisclosure, non-solicitation, non-recruitment and noncompete) than to those with only an NDA, a 2024 study found. (Syracuse University Whitman School of Management, Employment Restrictions on Resource Transferability and Value Appropriation from Employees (Balasubramanian, Starr and Yamaguchi; Strategic Management Journal, forthcoming), May 2024)
- 58 percent of major franchisors' contracts in 2016 Franchise Disclosure Documents barred franchisees from poaching each other's workers, Krueger and Ashenfelter found in 2018. (National Bureau of Economic Research, Theory and Evidence on Employer Collusion in the Franchise Sector (NBER Working Paper 24831; Krueger and Ashenfelter), 2016 documents (published July 2018))
- 237 corporate franchise chains, from McDonald's to Jiffy Lube, signed binding agreements to end no-poach clauses nationwide under Washington's 2018-2020 initiative. (Washington State Office of the Attorney General, AG Report: Ferguson's initiative ends no-poach practices nationally at 237 corporate franchise chains, June 2020)
- Nearly 200,000 U.S. franchise locations, including more than 4,700 in Washington, were covered by the no-poach agreements Washington's attorney general secured by 2020. (Washington State Office of the Attorney General, AG Report: Ferguson's initiative ends no-poach practices nationally at 237 corporate franchise chains, June 2020)
- Approximately 65 percent of corporate franchise chains investigated by Washington's attorney general through 2020 included no-poach provisions in their franchise contracts. (Washington State Office of the Attorney General, AG Report: Ferguson's initiative ends no-poach practices nationally at 237 corporate franchise chains, June 2020)
- Over 1,500 federal trade secret cases were filed in 2025, the highest annual total Lex Machina has ever recorded. (LexisNexis Lex Machina, Lex Machina 2026 Trade Secret Litigation Report: Federal Trade Secret Filings Hit an All-Time High in 2025 (press release), 2025)
- More than 80 percent of new federal trade secret lawsuits each year include claims under the federal Defend Trade Secrets Act, according to Lex Machina. (LexisNexis Lex Machina, Lex Machina 2026 Trade Secret Litigation Report: Federal Trade Secret Filings Hit an All-Time High in 2025 (press release), January 2026)
- More than $716 million in actual damages was awarded by juries in federal trade secret cases from 2023 to 2025, plus $510 million in punitive damages. (LexisNexis Lex Machina, Lex Machina 2026 Trade Secret Litigation Report: Federal Trade Secret Filings Hit an All-Time High in 2025 (press release), 2023-2025)
- 54% of employers answering the UK consultation said they could protect their business through other means, such as IP law or confidentiality clauses, if non-competes were banned. (UK Department for Business and Trade, Non-compete clauses: government response to consultation, May 2023)
| State | Statute | Carve-out covers | History note as printed |
|---|---|---|---|
| Minnesota | Minn. Stat. 181.78 | Inventions made entirely on own time with no employer equipment, supplies, facility or trade secrets, unless related to employer's business or R&D or resulting from work for the employer | 1977 c 47 s 1; 1986 c 444 |
| Washington | RCW 49.44.140 | Same own-time, no-employer-resources test with the same two exceptions | 1979 ex.s. c 177 s 2 |
| Kansas | K.S.A. 44-130 | Same own-time, no-employer-resources test with the same two exceptions | L. 1986, ch. 186, § 1 |
| Delaware | 19 Del. C. § 805 | Same own-time, no-employer-resources test with the same two exceptions | 64 Del. Laws, c. 257, § 1; 70 Del. Laws, c. 186, § 1 |
| New York | N.Y. Labor Law § 203-F | Same own-time, no-employer-resources test with the same two exceptions | Most recent revision 2023-09-22 |
India Employment Contract Statistics: Written Contracts, Leave and Social Security
Most work in India happens outside formal employment, and many salaried workers have no written contract at all. ILO and government survey data track the change over time.
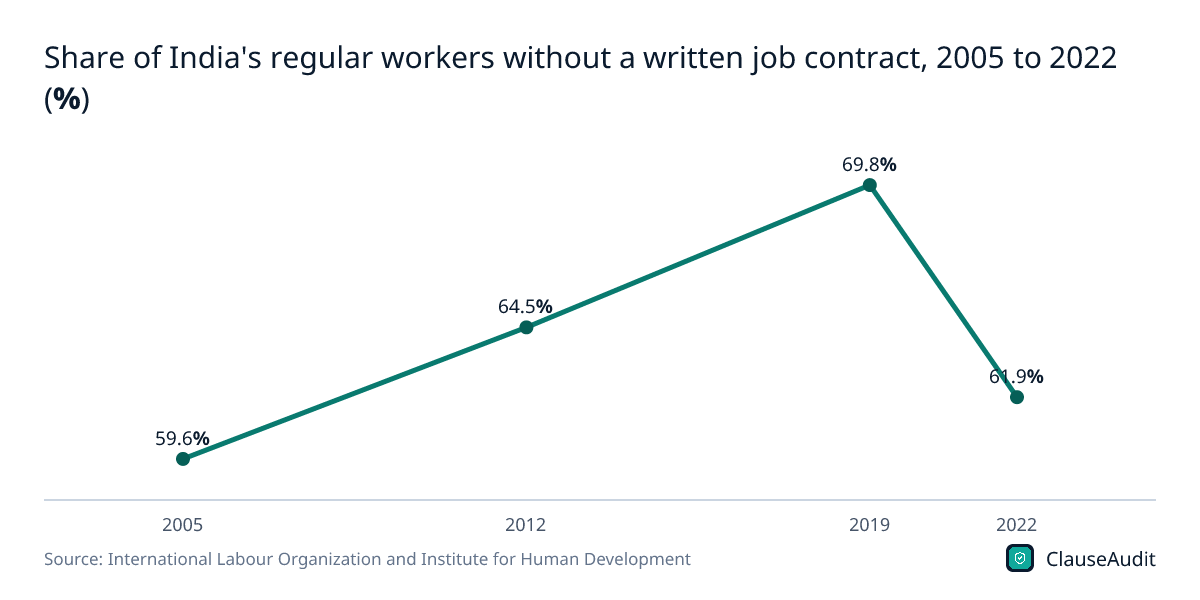
- 61.9% of India's regular wage and salaried workers had no written job contract in 2022, according to the ILO's India Employment Report 2024. (International Labour Organization and Institute for Human Development, India Employment Report 2024: Youth employment, education and skills, 2022)
- 69.8% of regular workers in India lacked a written contract in 2019, up from 59.6% in 2005, before the share fell during the pandemic. (International Labour Organization and Institute for Human Development, India Employment Report 2024: Youth employment, education and skills, 2005-2019)
- 26.4% of India's regular workers had a long-term written contract of more than three years in 2022, down from 35.9% in 2005. (International Labour Organization and Institute for Human Development, India Employment Report 2024: Youth employment, education and skills, 2022)
- 30.7% of young regular workers in India had a written contract in 2022, and only 15% had a long-term written contract. (International Labour Organization and Institute for Human Development, India Employment Report 2024: Youth employment, education and skills, 2022)
- 41.6% of adult regular workers in India had a written contract in 2022, compared with 30.7% of young regular workers. (International Labour Organization and Institute for Human Development, India Employment Report 2024: Youth employment, education and skills, 2022)
- 90.3% of total employment in India was informal in 2022, with regular formal employment only 9.4% of all jobs. (International Labour Organization and Institute for Human Development, India Employment Report 2024: Youth employment, education and skills, 2022)
- 23.6% of India's workers were in regular wage or salaried employment in 2025, up from 22.4% in 2024. (National Statistics Office, Ministry of Statistics and Programme Implementation, Government of India, Press Note on Periodic Labour Force Survey (PLFS) Annual Report, 2025 [January 2025 - December 2025], 2025)
- 56.2% of India's workers were self-employed in 2025, down from 58.2% in 2023, leaving most work outside formal employment contracts. (National Statistics Office, Ministry of Statistics and Programme Implementation, Government of India, Press Note on Periodic Labour Force Survey (PLFS) Annual Report, 2025 [January 2025 - December 2025], 2025)
- 20.2% of India's workers were casual labourers in 2025, roughly one in five, little changed from 20.0% in 2024. (National Statistics Office, Ministry of Statistics and Programme Implementation, Government of India, Press Note on Periodic Labour Force Survey (PLFS) Annual Report, 2025 [January 2025 - December 2025], 2025)
- ₹24,217 was average monthly earnings for male regular wage and salaried workers in India in 2025, versus ₹18,353 for women. (National Statistics Office, Ministry of Statistics and Programme Implementation, Government of India, Press Note on Periodic Labour Force Survey (PLFS) Annual Report, 2025 [January 2025 - December 2025], 2025)
- 61.6 crore people aged 15 and above were employed in India on average during January to December 2025. (National Statistics Office, Ministry of Statistics and Programme Implementation, Government of India, Press Note on Periodic Labour Force Survey (PLFS) Annual Report, 2025 [January 2025 - December 2025], 2025)
- 31.89 crore unorganised workers had registered on India's e-Shram portal by August 2026, and women made up 54.28% of registrants. (Press Information Bureau, Government of India, 5 Years of e-Shram Portal: Building an Inclusive Social Security Ecosystem, August 2026)
- 1-2% of annual turnover, capped at 5% of payouts to workers, is what platform aggregators must contribute to a social security fund under India's Code on Social Security. (Press Information Bureau, Government of India, Labour Reforms: Formalising and Safeguarding India's Gig & Platform Workforce, 2025)
Figure 12: Share of India's regular workers without a written job contract, 2005 to 2022 (%)
Chart data
| Label | Value (%) |
|---|---|
| 2005 | 59.6% |
| 2012 | 64.5% |
| 2019 | 69.8% |
| 2022 | 61.9% |
What the numbers mean for workers
Non-competes are not limited to senior staff. The FTC estimated 30 million US workers were bound by one in 2024, and in a 2017 employer survey 49.4% of private workplaces required at least some employees to sign. Among workplaces with average pay under $13.00 an hour, 29.0% required all of their workers to sign one.
A clause in your contract does not mean a court will enforce it. In California, North Dakota and Oklahoma, which do not enforce non-competes, 7.0% of workers still reported having one. A federal court blocked the FTC's 2024 nationwide ban, and in September 2025 the FTC voted 3-1 to drop its appeals and accept vacatur of the rule, so state law now decides. Minnesota and North Dakota void most non-competes, Washington sets a 2026 threshold of $126,858.83 for employees and bans all of them from June 30, 2027, and Florida allows terms of up to 4 years for covered high earners.
Arbitration clauses matter just as much. In 2017, 56.2% of private nonunion workers were subject to mandatory arbitration, and 30.1% of employers that required it also included class action waivers. Employees won 19% of AAA cases decided by an arbitrator in 2019-2020, but the median civil rights damages award was $39K, against $406K in federal court litigation.
Severance is a contract term, not a right
Employers announced 1,206,374 job cuts in 2025, up 58% from 2024, and 3.3 million long-tenured workers were displaced between January 2023 and December 2025. Only about 45% of those displaced workers got written advance notice.
No federal law requires private employers to pay severance, so what you get depends on your contract or company policy. Federal employees, by contrast, get one week of basic pay per year of service for the first 10 years and two weeks per year after that, capped at 52 weeks. If you are 40 or older and asked to waive age claims, you must get at least 21 days to consider the release, or 45 days in a group layoff, plus 7 days to revoke after signing.
What to do with this data
- Check which state's law governs your non-compete and if your pay falls below that state's threshold. Colorado can fine employers $5,000 per worker, and Virginia $10,000 per violation for non-competes with low-wage employees.
- Read the arbitration clause for a class action waiver. Since March 3, 2022, workers can choose to take sexual assault and harassment claims to court even if they signed one.
- Look for NDA terms that bar reporting misconduct. The Speak Out Act of 2022 limits pre-dispute NDAs in harassment cases, and the SEC charged seven companies in September 2024 over agreements that impeded reports.
- Check the invention assignment clause. Minnesota, Washington, Kansas, Delaware and New York void assignments of inventions made on your own time without employer resources.
- Ask for the severance formula in writing before you sign, not when you are laid off.
- For employers: a narrower clause is easier to defend. In GAO's 2022 survey, 95% of employers using non-competes cited protecting trade secrets, and 54% of employers answering a UK consultation said IP law or confidentiality clauses could protect them instead.
Check your employment contract before you sign
The figures on this page point to the same clauses: non-competes that may not hold up in your state, arbitration terms that waive class actions, broad NDAs and severance that exists only if the contract says so. An automated review of your agreement flags those terms, explains them in plain English and checks them against the rules for your state.
- Non-compete length, geography and any state ban or pay threshold that applies
- Mandatory arbitration, class action waivers and who pays the fees
- NDA scope and whether it limits reporting harassment or misconduct
- Invention and IP assignment, including work done on your own time
- Severance amount, release terms and review periods
- Non-solicitation of clients and coworkers after you leave
Frequently asked questions
How many workers have non-compete agreements?
Estimates vary by method. The FTC put the number at 30 million US workers, nearly one in five, in 2024. Federal Reserve survey data showed 11.4% of adult workers had one, and a 2017 employer survey estimated 27.8% to 46.5% of private-sector workers.
Are non-competes banned in the US?
Not nationally. A federal court blocked the FTC's 2024 rule, and in September 2025 the FTC voted 3-1 to drop its appeals and accept vacatur of the rule. State law now applies: Minnesota and North Dakota void most non-competes, and Washington makes all of them void from June 30, 2027.
How common is mandatory arbitration in employment contracts?
In a 2017 national survey, 56.2% of US private-sector nonunion employees were subject to mandatory arbitration, an estimated 60.1 million workers. Of employers requiring it, 30.1% also included class action waivers.
Do employees win in arbitration or in court?
It depends on how cases are counted. Employees won 19% of AAA employment cases decided by an arbitrator in 2019-2020, versus 1% of federal cases decided by trial or motion. After a full hearing, employees won 31% in arbitration and 40% at federal trial, and median civil rights damages were $39K against $406K.
Is severance pay required by law?
Not for US private employers; severance is set by contract or company policy. Federal employees get one week of basic pay per year for the first 10 years of service and two weeks per year after that, up to 52 weeks in a lifetime.
Can an NDA stop me from reporting harassment?
The federal Speak Out Act of 2022 made pre-dispute NDAs unenforceable in sexual assault and harassment disputes. Washington sets $10,000 in statutory damages for NDA terms that gag workers about discrimination, harassment or wage violations.
How many doctors sign non-competes?
In a 2026 Physicians Advocacy Institute survey of 1,003 physicians, 48% of employed physicians said they were subject to a non-compete with their current employer, and 33% reported being subject to a nondisclosure agreement.
Use this data
Every chart and card below is free to reuse under CC BY 4.0. Download what you need and link back to this page.
 Stat cards
 Key findings card
 Infographic
 US alternative and contingent work arrangements, share of total employment, July 2023 (%)
 Share of US nonunion workplaces with mandatory employment arbitration, by industry, 2017 (%)
 How many workers have noncompetes? Estimates by survey and year (% of workers)
 Estimated effects of stricter noncompete enforceability on earnings, mobility, startups and innovation (% change)
 Employee win rates in AAA employment arbitration vs federal court, 2019-2020 cases (% of decided cases won by employee)
 Share of U.S. workers with a non-compete, by industry (2022) (%)
 Title VII sexual harassment charges filed with the EEOC, FY 2019 to FY 2025
 Share of India's regular workers without a written job contract, 2005 to 2022 (%)
 Selected state non-compete bans, wage floors and limits, verified against statute text (October 2026)
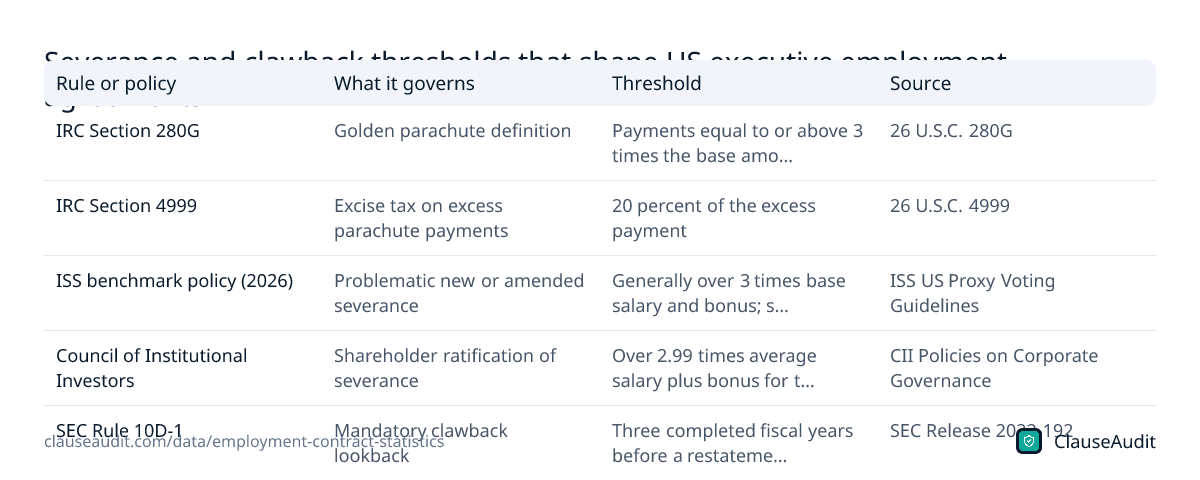 Severance and clawback thresholds that shape US executive employment agreements
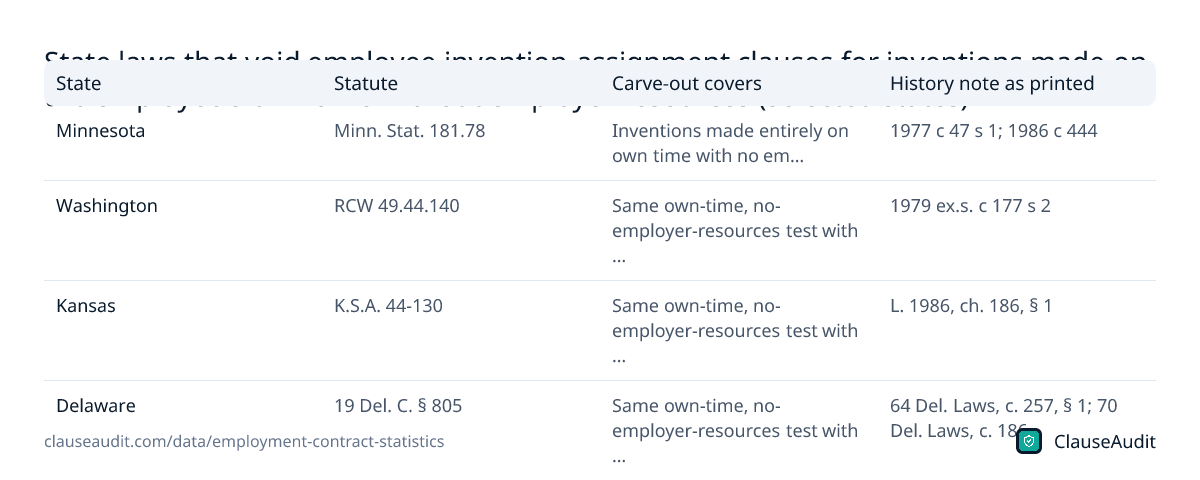 State laws that void employee invention-assignment clauses for inventions made on the employee's own time without employer resources (selected states)
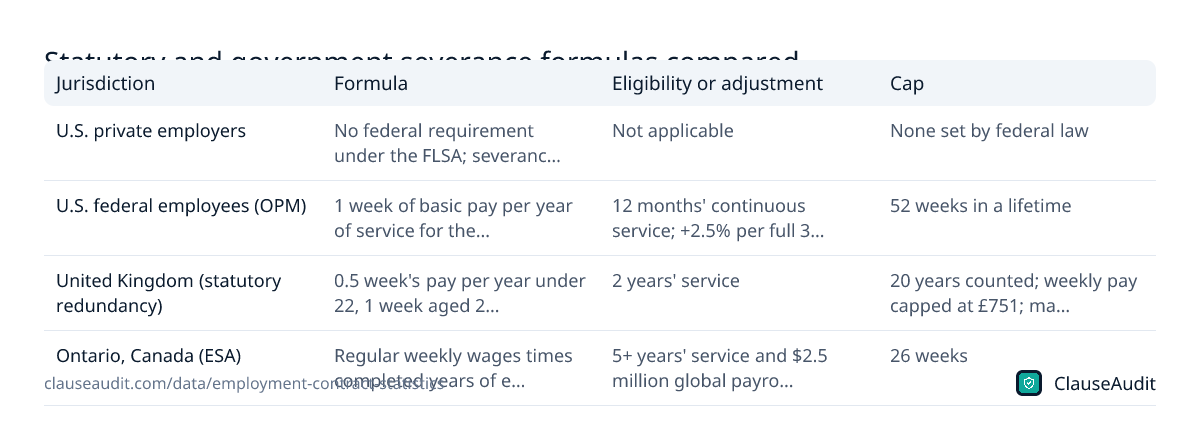 Statutory and government severance formulas compared
Embed the infographic
Free to share on your site, blog or slides under CC BY 4.0. Please keep the credit link.
Sources and method
Every number on this page comes from the sources below, each opened and read on or before October 17, 2026. A second, independent review checked every figure against its source and corrected anything that did not match. Figures that could not be confirmed were left out.
- U.S. Bureau of Labor Statistics, Contingent and Alternative Employment Arrangements, July 2023 (November 8, 2024)
- U.S. Bureau of Labor Statistics, Employee Tenure in January 2026 (September 24, 2026)
- U.S. Bureau of Labor Statistics, Union Members, 2025 (February 18, 2026)
- Australian Bureau of Statistics, Working arrangements, August 2025 (December 12, 2025)
- Pew Research Center, The State of Gig Work in 2021 (December 8, 2021)
- MBO Partners, 2026 State of Independence Report (2026 edition)
- U.S. Federal Trade Commission, FTC Announces Rule Banning Noncompetes (April 23, 2024)
- U.S. Federal Trade Commission, Federal Trade Commission Files to Accede to Vacatur of Non-Compete Clause Rule (September 5, 2025)
- Washington State Department of Labor & Industries, Non-Compete Agreements (earnings thresholds) (2026 thresholds)
- Washington State Legislature, RCW 49.62.020 Noncompetition covenants: when void and unenforceable (Current code (versions effective until and from June 30, 2027))
- Colorado General Assembly, HB22-1317 Restrictive Employment Agreements (Signed June 8, 2022; effective August 10, 2022)
- Maryland General Assembly, Maryland Code, Labor and Employment 3-716 (Current code)
- Maine Legislature, 26 M.R.S. 599-A Restrictions on noncompete agreements (Current code)
- Virginia General Assembly (Legislative Information System), Code of Virginia 40.1-28.7:8 Prohibiting noncompete agreements for low-wage employees (Current code)
- Florida Legislature, Florida Statutes 542.43 Definitions (CHOICE Act) (2025 statutes)
- Florida Legislature, Florida Statutes 542.45 Covered noncompete agreements (2025 statutes)
- The Florida Senate, CS/CS/CS/HB 1219 Employment Agreements (Chapter 2025-213) (Became law July 3, 2025)
- Minnesota Office of the Revisor of Statutes, Minnesota Statutes 181.988 Covenants not to compete void (2023 c 53 art 6 s 1)
- North Dakota Legislative Branch, North Dakota Century Code 9-08-06 In restraint of business void (Current code)
- Economic Policy Institute, The growing use of mandatory arbitration (Alexander J.S. Colvin) (April 6, 2018 (survey March to July 2017))
- U.S. Government Publishing Office (govinfo), Public Law 117-90, Ending Forced Arbitration of Sexual Assault and Sexual Harassment Act of 2021 (Approved March 3, 2022)
- Office of the Clerk, U.S. House of Representatives, Roll Call 33, H.R. 4445 (February 7, 2022)
- American Arbitration Association, Employment Arbitration (Accessed October 2026 (2025 case data))
- JAMS, Arbitration Fees (Accessed October 2026)
- Acquisition.gov (U.S. General Services Administration), DFARS 222.7402 Policy (arbitration restrictions for defense contractors) (Current regulation)
- Legal Information Institute, Cornell Law School, 26 U.S. Code 280G Golden parachute payments (Current code)
- Legal Information Institute, Cornell Law School, 26 U.S. Code 4999 Golden parachute payments (excise tax) (Current code)
- U.S. Securities and Exchange Commission, SEC Adopts Compensation Recovery Listing Standards and Disclosure Rules (Press Release 2022-192) (October 26, 2022)
- U.S. Securities and Exchange Commission, Fact Sheet: Recovery of Erroneously Awarded Compensation (October 2022)
- Harvard Law School Forum on Corporate Governance, Compensation Clawbacks: Surveying the Disclosures to Date (Compensia) (September 22, 2026)
- U.S. Securities and Exchange Commission (Federal Register), Order Granting Accelerated Approval of Nasdaq Rule 5608 (Recovery of Erroneously Awarded Executive Compensation), 88 FR 39294 (June 15, 2023)
- Harvard Law School Forum on Corporate Governance, Golden Parachutes Face Investor Scrutiny (ISS Corporate Solutions) (November 14, 2023)
- Harvard Law School Forum on Corporate Governance, U.S. Say-On-Golden Parachute Failure Rate and CEO Golden Parachute Values in 2022 (ISS) (April 10, 2023)
- ISS (Institutional Shareholder Services), United States Proxy Voting Guidelines, Benchmark Policy Recommendations (Published December 9, 2025; effective February 1, 2026)
- Council of Institutional Investors, CII Policies on Corporate Governance (Current policies (accessed October 2026))
- Equilar, Executive Factbook (Data updated October 2023)
- Federal Reserve Bank of Minneapolis, New data on non-compete contracts and what they mean for workers (June 21, 2023)
- U.S. Bureau of Labor Statistics, Monthly Labor Review, Noncompete agreements, bargaining, and wages: evidence from the National Longitudinal Survey of Youth 1997 (Rothstein and Starr) (June 2022)
- Economic Policy Institute, Noncompete agreements: Ubiquitous, harmful to wages and to competition (Colvin and Shierholz) (December 10, 2019)
- U.S. Government Accountability Office, Noncompete Agreements: Use Is Widespread to Protect Business' Interests (GAO-23-103785) (May 2023)
- UK Department for Business and Trade, Non-compete clauses: impact assessment (12 May 2023)
- UK Department for Business and Trade, Non-compete clauses: government response to consultation (12 May 2023)
- National Bureau of Economic Research, The Labor Market Effects of Legal Restrictions on Worker Mobility (NBER Working Paper 31929; Johnson, Lavetti and Lipsitz) (December 2023, revised December 2024)
- National Bureau of Economic Research, Innovation, Inventor Mobility, and the Enforceability of Noncompete Agreements (NBER Working Paper 31487; Johnson, Lipsitz and Pei) (July 2023, revised December 2024)
- Journal of Human Resources (University of Wisconsin Press), Locked In? The Enforceability of Covenants Not to Compete and the Careers of High-Tech Workers (Balasubramanian et al.) (April 2022, vol. 57(S))
- American Economic Journal: Applied Economics (American Economic Association), Physician Practice Organization and Negotiated Prices: Evidence from State Law Changes (Hausman and Lavetti) (April 2021, vol. 13, no. 2)
- National Academy of Arbitrators Research and Education Foundation (grant-funded report), Comparative Analysis of Employment Arbitration and Employment Litigation (Katz, Kochan, Maltby, St. Antoine and Sherwyn) (November 1, 2023)
- U.S. Chamber of Commerce Institute for Legal Reform, Fairer, Faster, Better III: An Empirical Assessment of Consumer and Employment Arbitration (ndp | analytics; funded by the U.S. Chamber of Commerce Institute for Legal Reform) (March 2022)
- Economic Policy Institute, The arbitration epidemic (EPI Briefing Paper #414; Stone and Colvin) (December 7, 2015)
- American Arbitration Association, What 2025 Data Reveals About a Shifting Landscape (mass arbitration) (June 3, 2026)
- National Bureau of Economic Research, Theory and Evidence on Employer Collusion in the Franchise Sector (NBER Working Paper 24831; Krueger and Ashenfelter) (July 2018)
- Washington State Office of the Attorney General, AG Report: Ferguson's initiative ends no-poach practices nationally at 237 corporate franchise chains (June 16, 2020)
- Syracuse University Whitman School of Management, Employment Restrictions on Resource Transferability and Value Appropriation from Employees (Balasubramanian, Starr and Yamaguchi; Strategic Management Journal, forthcoming) (May 21, 2024)
- LexisNexis Lex Machina, Lex Machina 2026 Trade Secret Litigation Report: Federal Trade Secret Filings Hit an All-Time High in 2025 (press release) (January 29, 2026)
- Minnesota Office of the Revisor of Statutes, Minnesota Statutes 181.78 Agreements; terms relating to inventions (Current statute (History: 1977 c 47 s 1; 1986 c 444))
- Washington State Legislature, RCW 49.44.140 Requiring assignment of employee's rights to inventions (Current statute (1979 ex.s. c 177 s 2))
- Kansas Office of Revisor of Statutes, K.S.A. 44-130 Employment agreements assigning employee rights in inventions (Current statute (L. 1986, ch. 186, § 1))
- State of Delaware (Delaware Code Online), 19 Del. C. § 805 Employee's right to certain inventions (Current statute (64 Del. Laws, c. 257, § 1; 70 Del. Laws, c. 186, § 1))
- New York State Senate, New York Labor Law § 203-F Inventions made by employees (Most recent revision 2023-09-22)
- Physicians Advocacy Institute, Corporate Ownership's Impact on Physicians' Practice Experience: 2026 PAI Employed Physician Survey (July 2026 (fielded April 14 to May 4, 2026))
- U.S. Federal Trade Commission, FTC Takes Action Against Noncompete Agreements, Securing Protections for Workers (April 15, 2026)
- U.S. Federal Trade Commission, FTC Takes Action to Protect Workers from Noncompete Agreements (September 4, 2025)
- UK Competition and Markets Authority, CMA response to working paper on options for reform of non-compete clauses in employment contracts (February 2026)
- UK Competition and Markets Authority, Competition and market power in UK labour markets (25 January 2024)
- U.S. Government Publishing Office (govinfo), Speak Out Act, Public Law 117-224 (December 7, 2022)
- Washington State Legislature, RCW 49.44.211: Nondisclosure and nondisparagement provisions (Revised Code of Washington (as amended 2022))
- U.S. Securities and Exchange Commission, SEC Charges Seven Public Companies with Violations of Whistleblower Protection Rule (September 9, 2024)
- U.S. Equal Employment Opportunity Commission, Table E2c. Title VII Sexual Harassment Charge Receipts and Resolutions by Type of Resolution FY 2010 - FY 2025 (March 2026)
- UK Financial Conduct Authority, Culture and non-financial misconduct survey: findings (25 October 2024 (modified 24 March 2026))
- UK Ministry of Justice (GOV.UK), Victims and Prisoners Act 2024: changes to non-disclosure agreements (11 December 2025)
- Office for Students (England), Condition E6: Harassment and sexual misconduct (In force 1 August 2025)
- U.S. Office of Personnel Management, Fact Sheet: Severance Pay (Accessed October 2026)
- U.S. Department of Labor, Severance Pay (Accessed October 2026)
- U.S. Equal Employment Opportunity Commission, Q&A: Understanding Waivers of Discrimination Claims in Employee Severance Agreements (Accessed October 2026)
- Internal Revenue Service, Publication 15 (2026), (Circular E), Employer's Tax Guide (2026)
- Challenger, Gray & Christmas, 2025 Year-End Challenger Report: Highest Q4 Layoffs Since 2008; Lowest YTD Hiring Since 2010 (January 8, 2026)
- Challenger, Gray & Christmas, Job Cuts Fall in September; Hiring Plans Up 3% Over 2025 On Weak Early Seasonal Hiring (October 1, 2026)
- U.S. Bureau of Labor Statistics, Worker Displacement: 2023-2025 (Displaced Workers Summary) (August 27, 2026)
- U.S. Bureau of Labor Statistics, Job Openings and Labor Turnover Summary, August 2026 (September 29, 2026)
- GOV.UK, Redundancy: your rights - Redundancy pay (Rates for redundancies on or after 6 April 2026)
- Government of Ontario, Your guide to the Employment Standards Act: Severance pay (Accessed October 2026)
- International Labour Organization and Institute for Human Development, India Employment Report 2024: Youth employment, education and skills (March 2024)
- National Statistics Office, Ministry of Statistics and Programme Implementation, Government of India, Press Note on Periodic Labour Force Survey (PLFS) Annual Report, 2025 [January 2025 - December 2025] (27 March 2026)
- Press Information Bureau, Government of India, 5 Years of e-Shram Portal: Building an Inclusive Social Security Ecosystem (August 25, 2026)
- Press Information Bureau, Government of India, Labour Reforms: Formalising and Safeguarding India's Gig & Platform Workforce (December 9, 2025)
- Office for National Statistics, EMP17: People in employment on zero hours contracts (August 2026 edition, Table 1) (18 August 2026)
- Federal Trade Commission (Federal Register, via GovInfo), Non-Compete Clause Rule, final rule (89 FR 38342) (May 7, 2024)
- Federal Trade Commission, Noncompete Rule (rule page and status) (Accessed October 2026)
- U.S. Department of the Treasury, Office of Economic Policy, Non-compete Contracts: Economic Effects and Policy Implications (March 2016)
- U.S. Equal Employment Opportunity Commission, Select Task Force on the Study of Harassment in the Workplace: Report of Co-Chairs (June 2016)
- U.S. Securities and Exchange Commission, Office of the Whistleblower Annual Report to Congress for Fiscal Year 2025 (February 11, 2026)
Cite this page
ClauseAudit, “Employment Contract Statistics 2026: 160+ Numbers on Non-Competes, NDAs, Arbitration and Severance”, updated October 17, 2026, https://clauseaudit.com/data/employment-contract-statistics. Free to reuse with a link back (CC BY 4.0).
This page summarises published data and law as checked on October 17, 2026. Figures are updated as new editions are released, and your own situation may differ. It is general information, not legal, tax or financial advice.