Non-Compete Statistics 2026: How Many Workers Are Bound and What It Costs Them
By ClauseAudit Research · 14 sources ·
What do the latest non-compete statistics show?
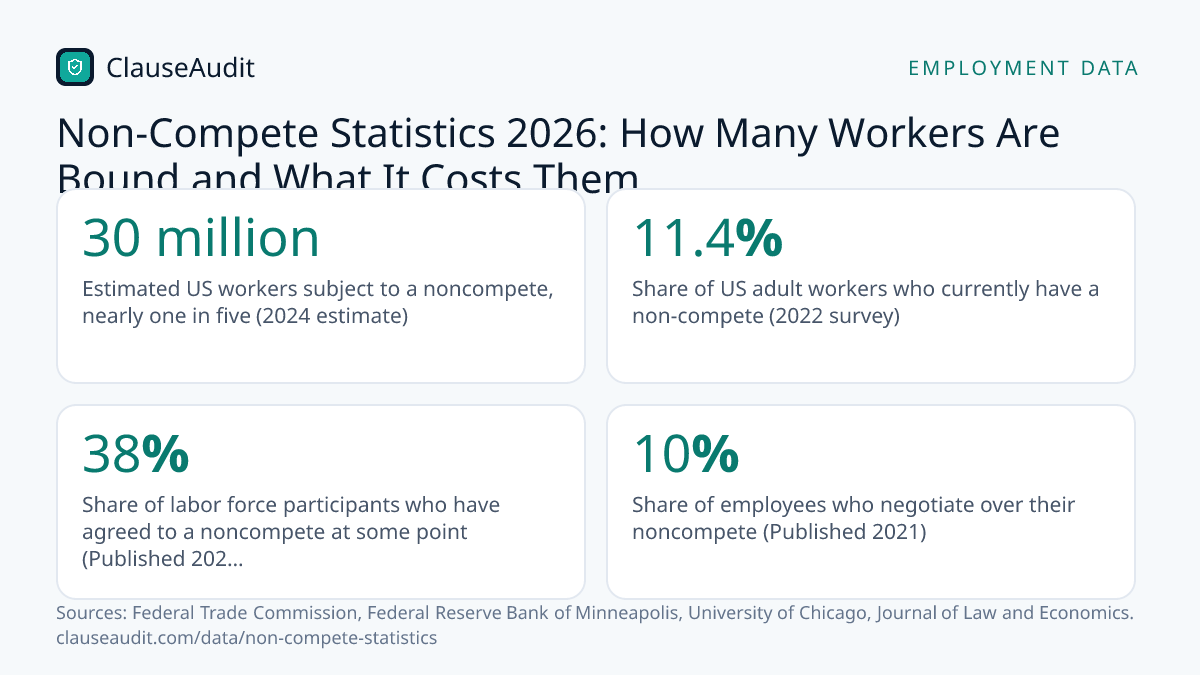
Non-competes are common and rarely negotiated. The FTC estimated in 2024 that about 30 million US workers, nearly one in five, are bound by one. A 2021 study found 38% of workers have signed one at some point, yet only 10% of employees negotiate over it, and the federal ban never took effect.

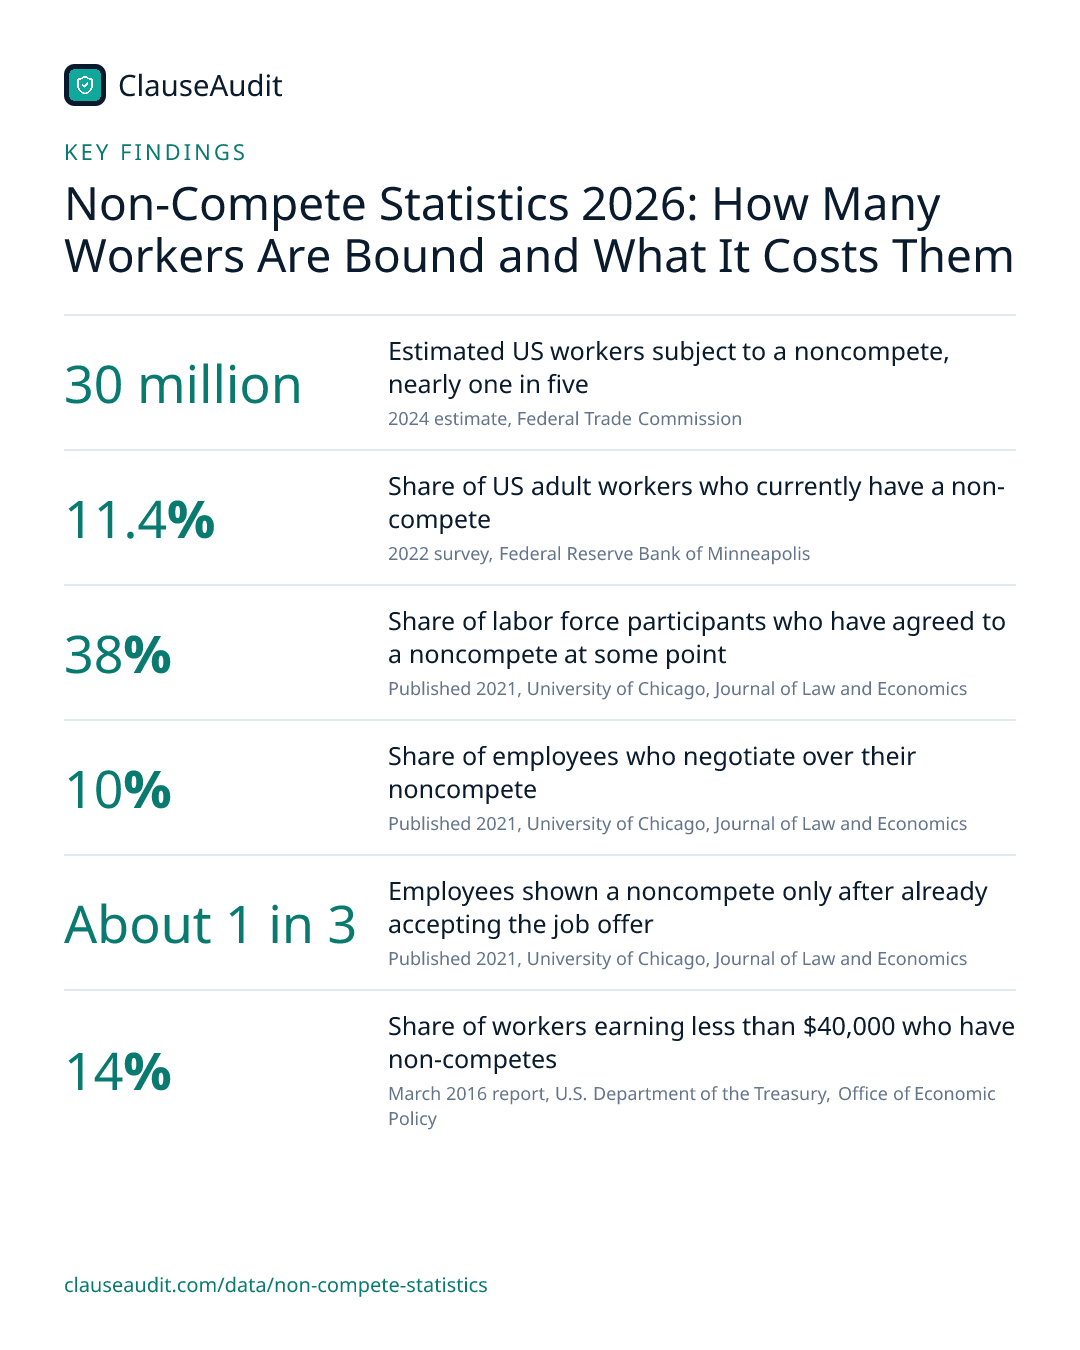
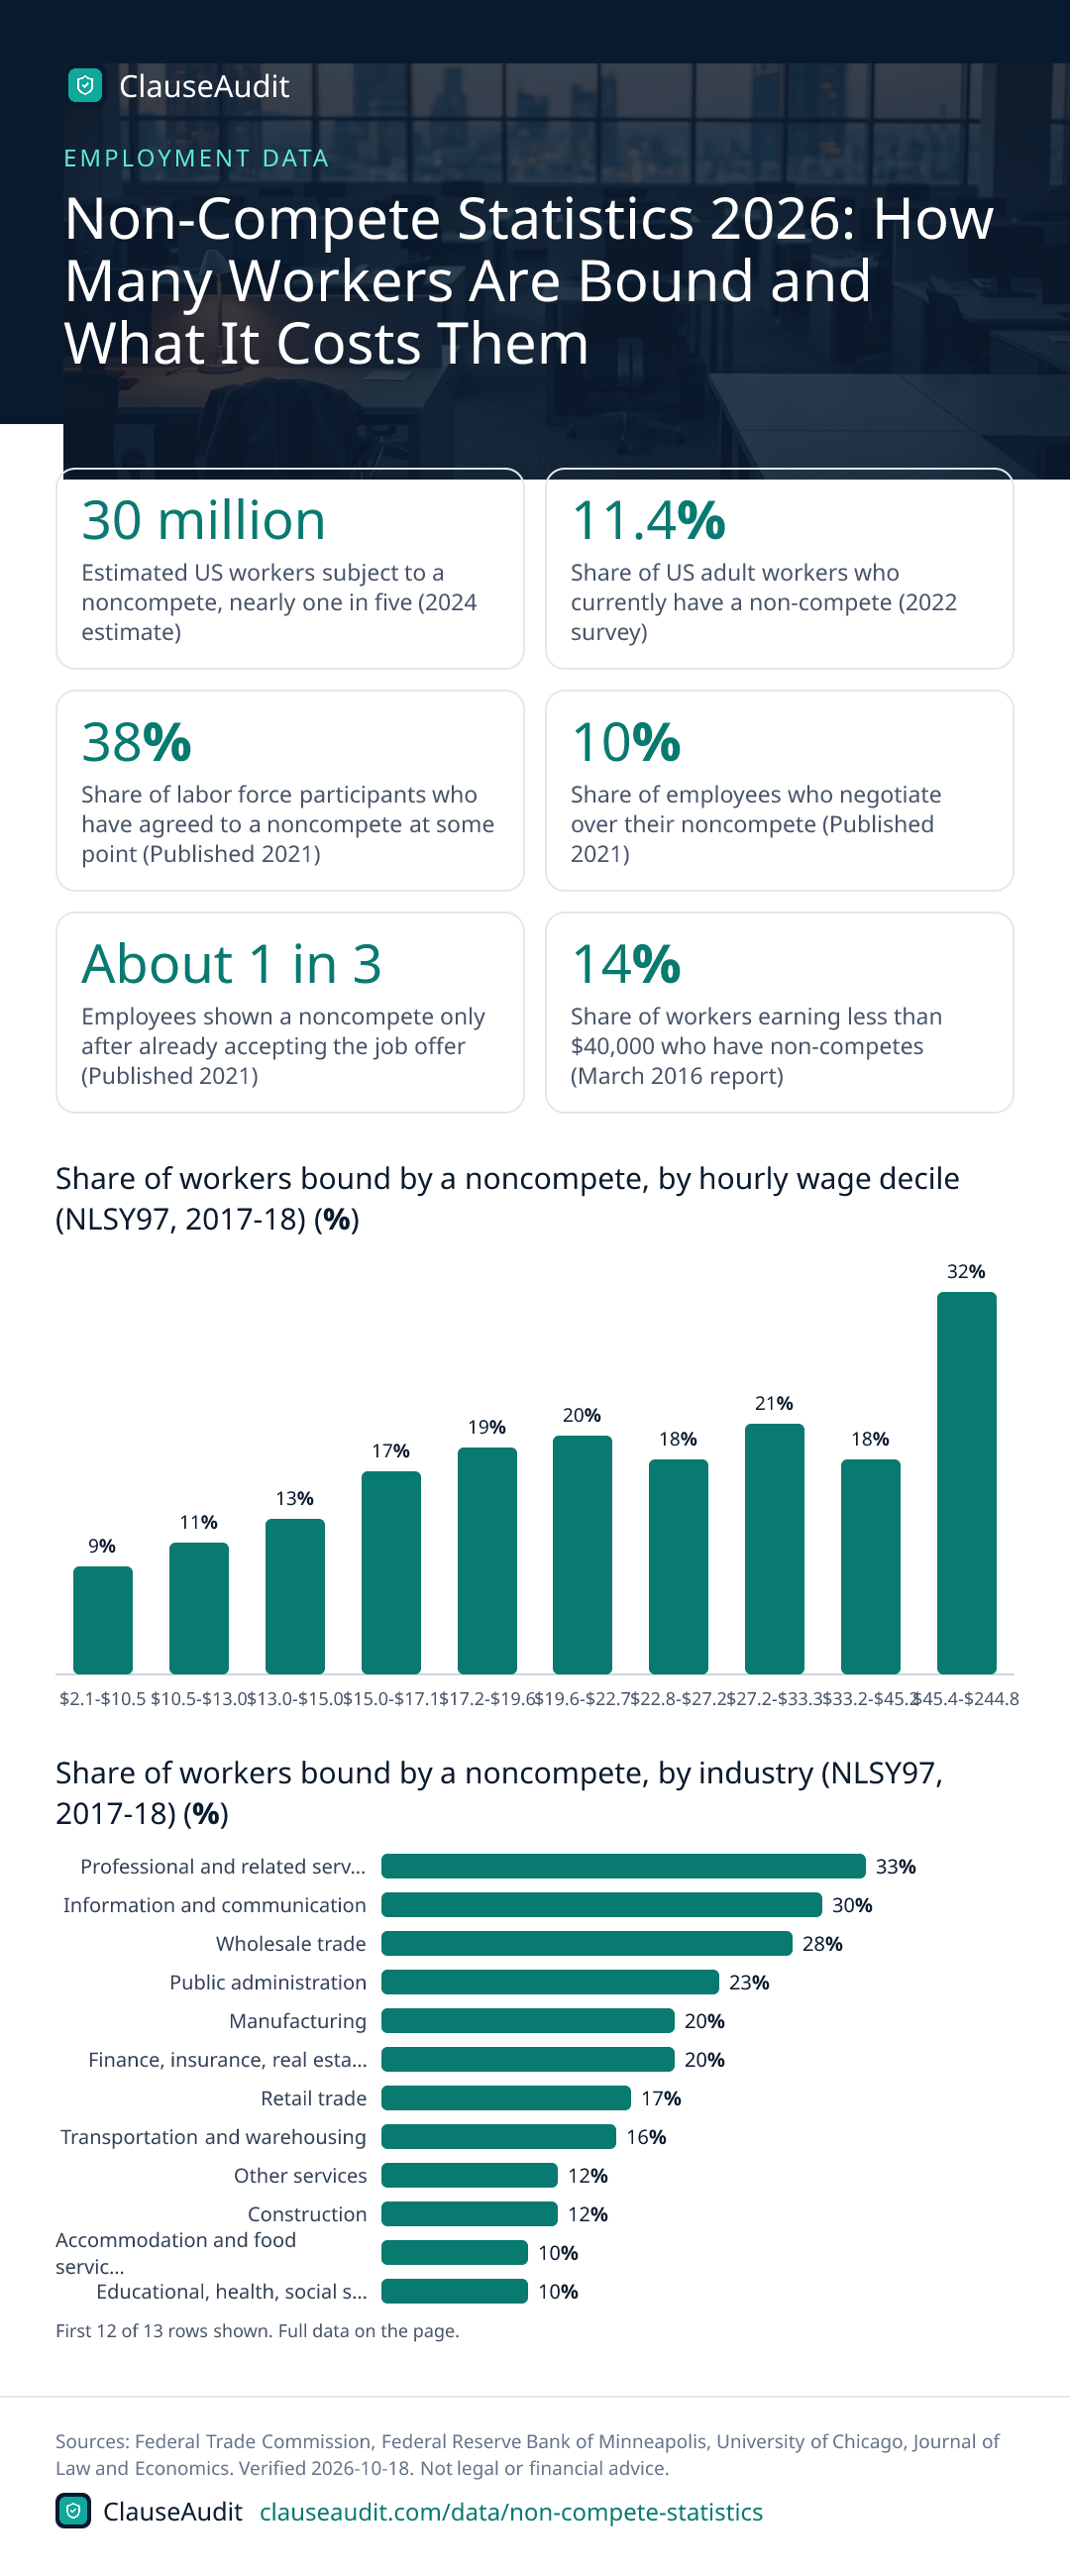
- Estimated US workers subject to a noncompete, nearly one in five (2024 estimate, Federal Trade Commission)
- 30 million
- Share of US adult workers who currently have a non-compete (2022 survey, Federal Reserve Bank of Minneapolis)
- 11.4%
- Share of labor force participants who have agreed to a noncompete at some point (Published 2021, University of Chicago, Journal of Law and Economics)
- 38%
- Share of employees who negotiate over their noncompete (Published 2021, University of Chicago, Journal of Law and Economics)
- 10%
- Employees shown a noncompete only after already accepting the job offer (Published 2021, University of Chicago, Journal of Law and Economics)
- About 1 in 3
- Share of workers earning less than $40,000 who have non-competes (March 2016 report, U.S. Department of the Treasury, Office of Economic Policy)
- 14%
- FTC-projected yearly earnings gain per average worker if noncompetes were banned (2024 projection, Federal Trade Commission)
- $524
- FTC-projected extra wages for workers over ten years under a noncompete ban (2024 projection, next decade, Federal Trade Commission)
- $400-$488 billion
If your offer letter came with a non-compete, you have plenty of company. The Federal Trade Commission put the number of bound workers at about 30 million in 2024, and a large academic survey published in 2021 found that 38% of people in the labor force have agreed to one at some point in their careers.
What most people miss is how little room they think they have. Only 10% of employees negotiate over the clause, and about 1 in 3 first see it after they have already accepted the job. This page explains what the numbers mean, why the federal ban you may have read about is gone, and what to check before you sign.
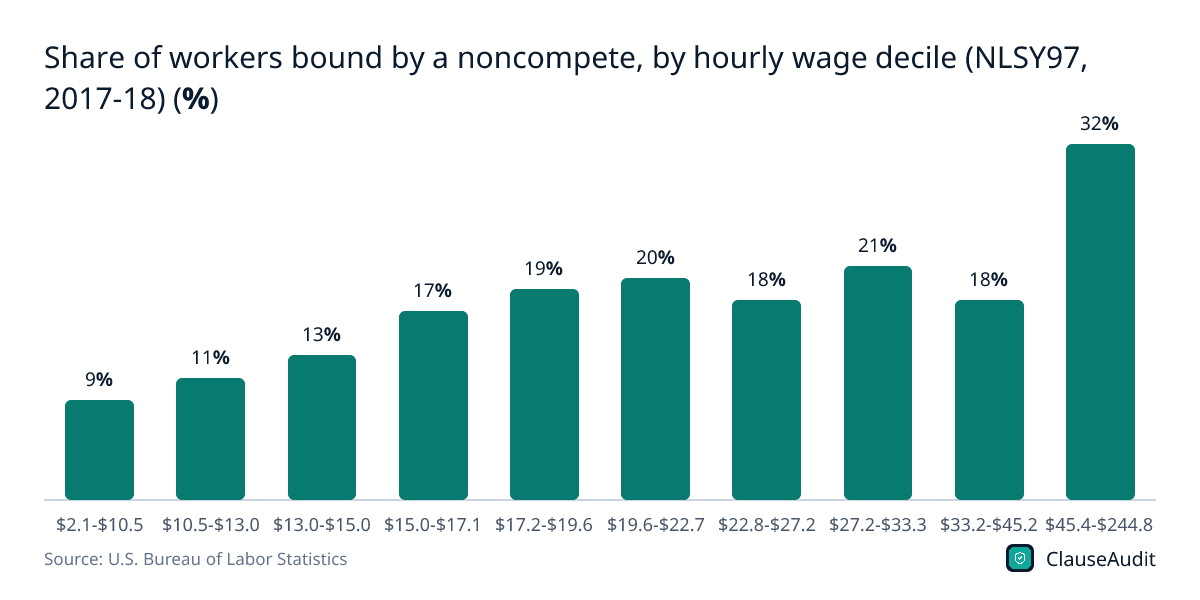
Share of workers bound by a noncompete, by hourly wage decile (NLSY97, 2017-18) (%)
Chart data
| Label | Value (%) |
|---|---|
| $2.1-$10.5 | 9% |
| $10.5-$13.0 | 11% |
| $13.0-$15.0 | 13% |
| $15.0-$17.1 | 17% |
| $17.2-$19.6 | 19% |
| $19.6-$22.7 | 20% |
| $22.8-$27.2 | 18% |
| $27.2-$33.3 | 21% |
| $33.2-$45.2 | 18% |
| $45.4-$244.8 | 32% |
Higher pay means higher odds, with 32% of the top wage decile bound. But the bottom decile still sits at 9%, which is hard to explain by trade secrets alone.
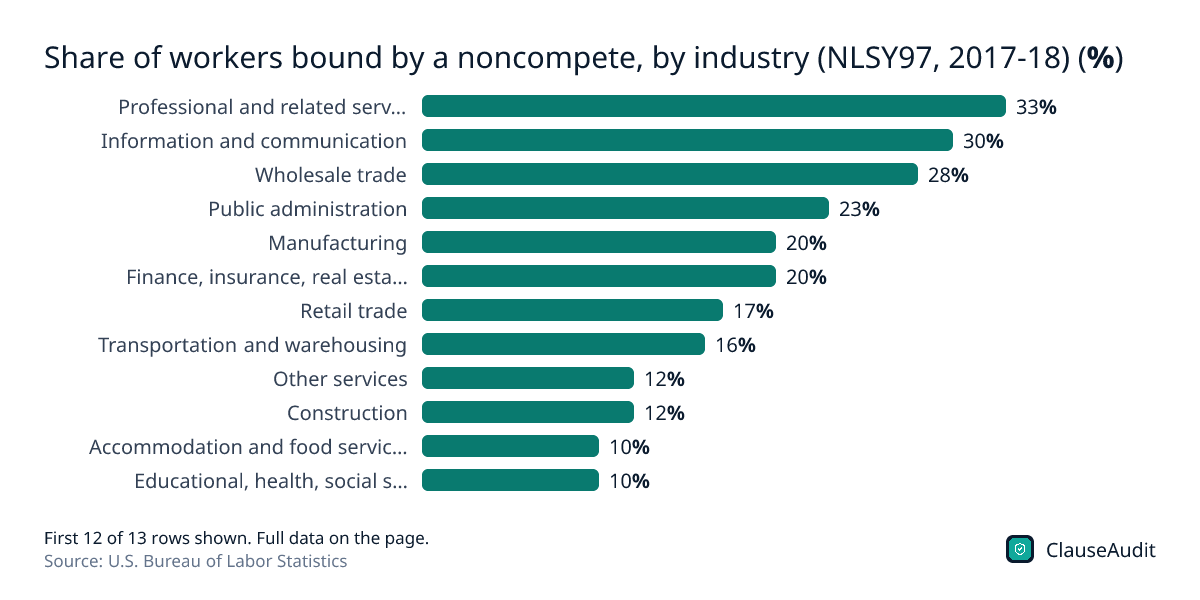
Download this chart (PNG)Share of workers bound by a noncompete, by industry (NLSY97, 2017-18) (%)
Chart data
| Label | Value |
|---|---|
| Professional and related services | 33% |
| Information and communication | 30% |
| Wholesale trade | 28% |
| Public administration | 23% |
| Manufacturing | 20% |
| Finance, insurance, real estate | 20% |
| Retail trade | 17% |
| Transportation and warehousing | 16% |
| Other services | 12% |
| Construction | 12% |
| Accommodation and food services | 10% |
| Educational, health, social services | 10% |
| Agriculture, forestry, fisheries | 6% |
Professional services (33%) and information and communication (30%) lead. Even accommodation and food services shows 10%, a sector with little confidential information to protect.
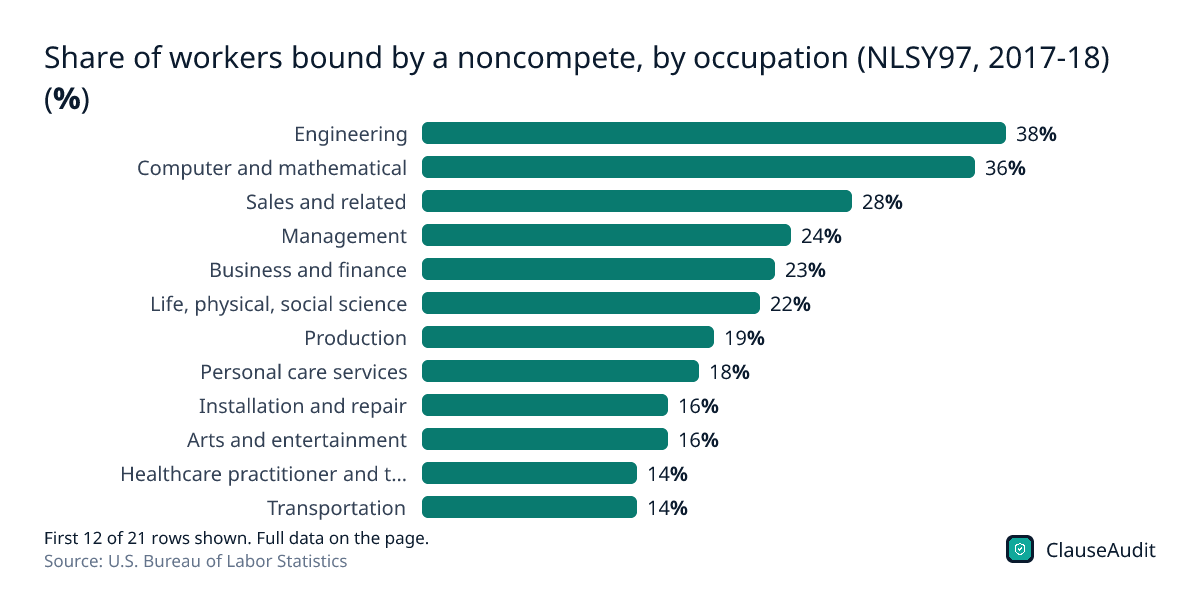
Download this chart (PNG)Share of workers bound by a noncompete, by occupation (NLSY97, 2017-18) (%)
Chart data
| Label | Value |
|---|---|
| Engineering | 38% |
| Computer and mathematical | 36% |
| Sales and related | 28% |
| Management | 24% |
| Business and finance | 23% |
| Life, physical, social science | 22% |
| Production | 19% |
| Personal care services | 18% |
| Installation and repair | 16% |
| Arts and entertainment | 16% |
| Healthcare practitioner and technical | 14% |
| Transportation | 14% |
| Construction and extraction | 14% |
| Office support | 14% |
| Protective service | 13% |
| Building and grounds maintenance | 11% |
| Healthcare support | 9% |
| Food preparation and serving | 7% |
| Education and training | 7% |
| Community and social services | 4% |
| Legal | 4% |
Engineers (38%) and computer and math workers (36%) are the most likely to be bound. Sales follows at 28%, often because employers worry about client relationships walking out the door.
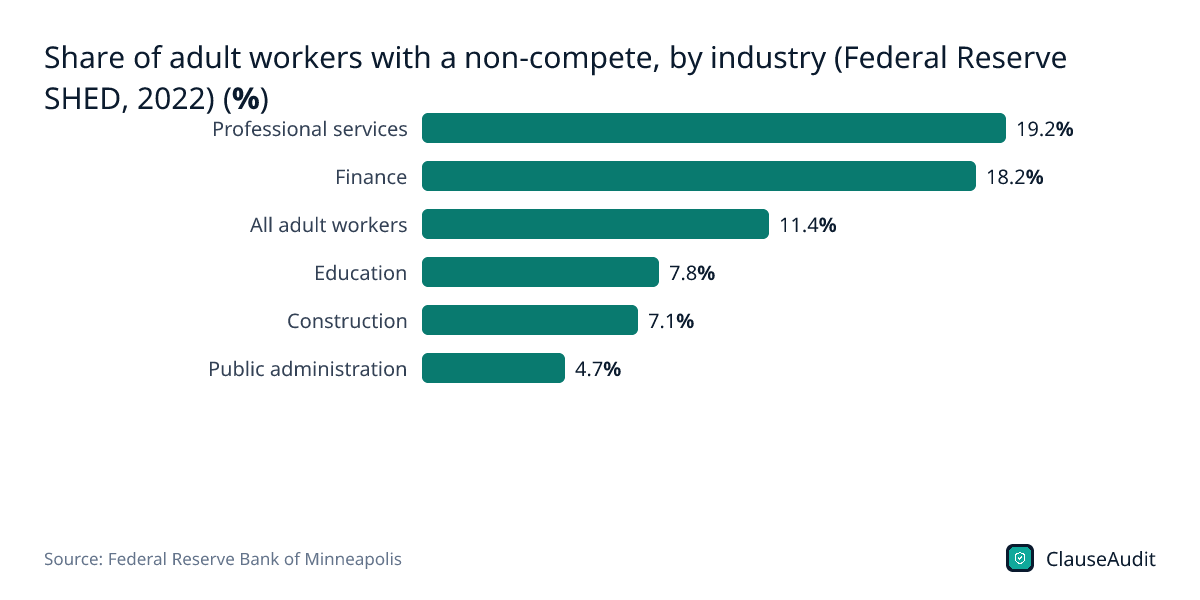
Download this chart (PNG)Share of adult workers with a non-compete, by industry (Federal Reserve SHED, 2022) (%)
Chart data
| Label | Value |
|---|---|
| Professional services | 19.2% |
| Finance | 18.2% |
| All adult workers | 11.4% |
| Education | 7.8% |
| Construction | 7.1% |
| Public administration | 4.7% |
The Federal Reserve survey shows the same pattern with lower overall rates: professional services at 19.2% and finance at 18.2%, against 11.4% for all adult workers.
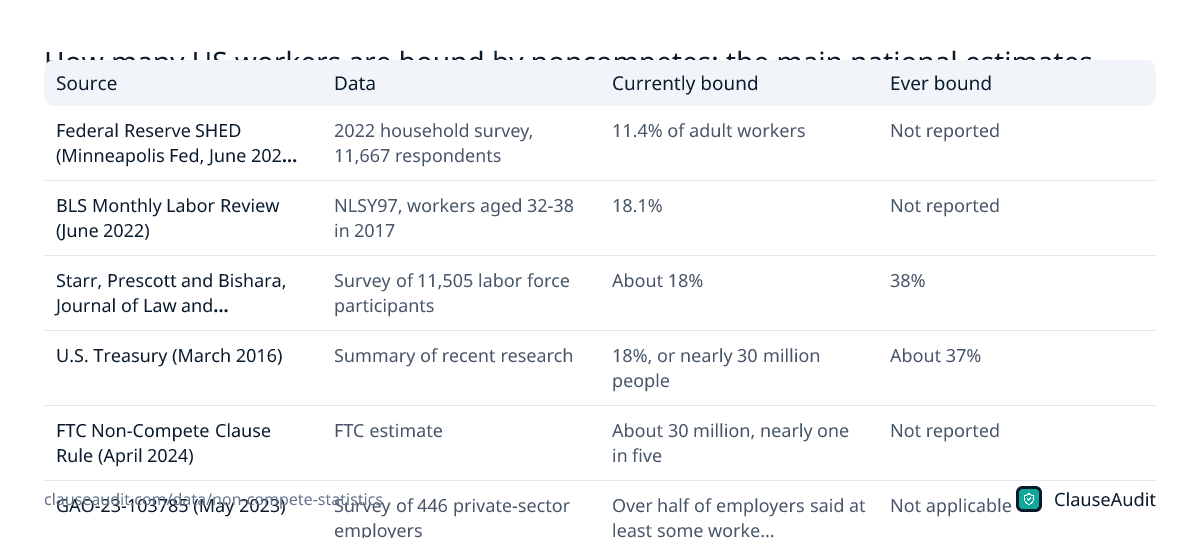
Download this chart (PNG)How many US workers are bound by noncompetes: the main national estimates
| Source | Data | Currently bound | Ever bound |
|---|---|---|---|
| Federal Reserve SHED (Minneapolis Fed, June 2023) | 2022 household survey, 11,667 respondents | 11.4% of adult workers | Not reported |
| BLS Monthly Labor Review (June 2022) | NLSY97, workers aged 32-38 in 2017 | 18.1% | Not reported |
| Starr, Prescott and Bishara, Journal of Law and Economics (2021) | Survey of 11,505 labor force participants | About 18% | 38% |
| U.S. Treasury (March 2016) | Summary of recent research | 18%, or nearly 30 million people | About 37% |
| FTC Non-Compete Clause Rule (April 2024) | FTC estimate | About 30 million, nearly one in five | Not reported |
| GAO-23-103785 (May 2023) | Survey of 446 private-sector employers | Over half of employers said at least some workers had noncompetes | Not applicable |
Source: Federal Reserve Bank of Minneapolis, New data on non-compete contracts and what they mean for workers; U.S. Bureau of Labor Statistics, Noncompete agreements, bargaining, and wages: evidence from the National Longitudinal Survey of Youth 1997 (Rothstein and Starr), Monthly Labor Review; University of Chicago, Journal of Law and Economics, Noncompete Agreements in the US Labor Force (Starr, Prescott and Bishara), Journal of Law and Economics, Vol. 64, No. 1; U.S. Department of the Treasury, Office of Economic Policy, Non-compete Contracts: Economic Effects and Policy Implications; Federal Trade Commission, FTC Announces Rule Banning Noncompetes; U.S. Government Accountability Office, Noncompete Agreements: Use is Widespread to Protect Business' Stated Interests, Restricts Job Mobility, and May Affect Wages (GAO-23-103785). Download as image
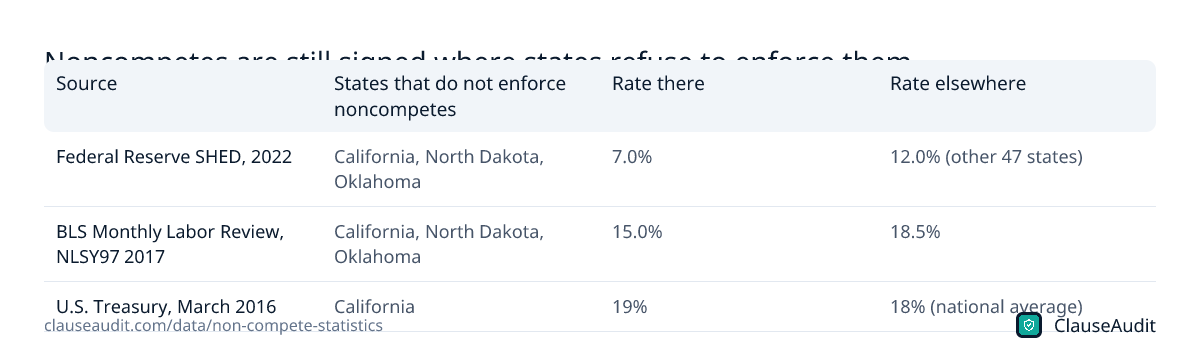
Noncompetes are still signed where states refuse to enforce them
| Source | States that do not enforce noncompetes | Rate there | Rate elsewhere |
|---|---|---|---|
| Federal Reserve SHED, 2022 | California, North Dakota, Oklahoma | 7.0% | 12.0% (other 47 states) |
| BLS Monthly Labor Review, NLSY97 2017 | California, North Dakota, Oklahoma | 15.0% | 18.5% |
| U.S. Treasury, March 2016 | California | 19% | 18% (national average) |
Source: Federal Reserve Bank of Minneapolis, New data on non-compete contracts and what they mean for workers; U.S. Bureau of Labor Statistics, Noncompete agreements, bargaining, and wages: evidence from the National Longitudinal Survey of Youth 1997 (Rothstein and Starr), Monthly Labor Review; U.S. Department of the Treasury, Office of Economic Policy, Non-compete Contracts: Economic Effects and Policy Implications. Download as image
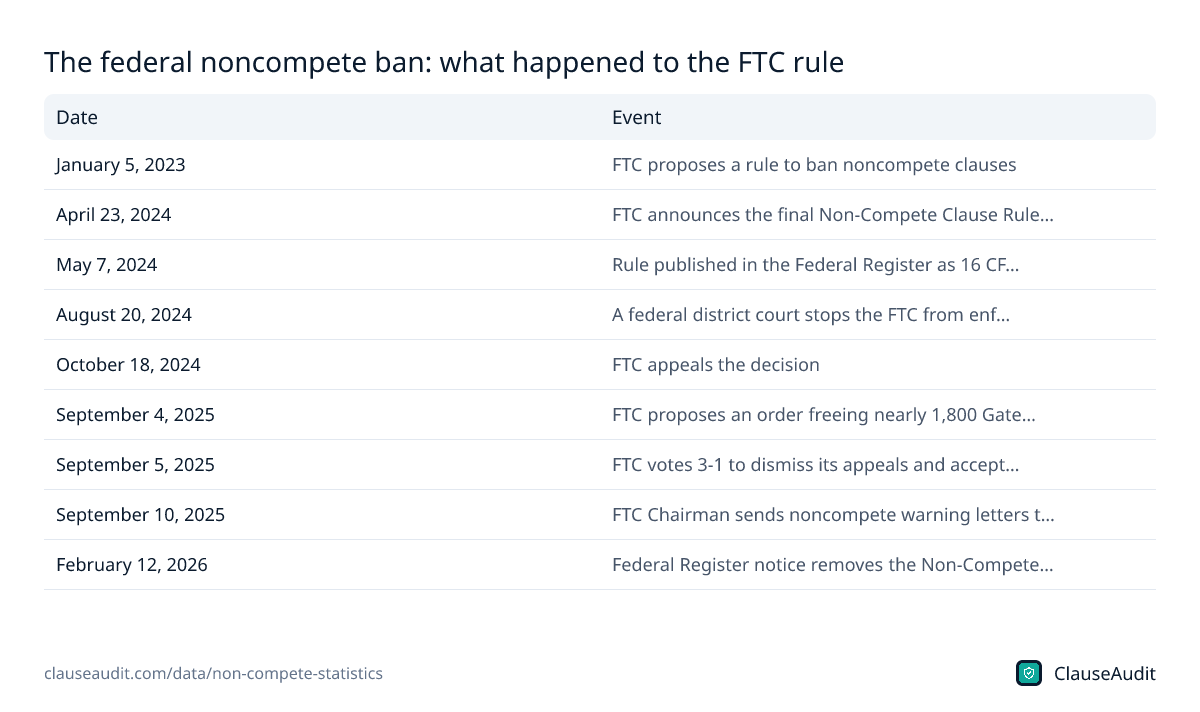
The federal noncompete ban: what happened to the FTC rule
| Date | Event |
|---|---|
| January 5, 2023 | FTC proposes a rule to ban noncompete clauses |
| April 23, 2024 | FTC announces the final Non-Compete Clause Rule; it received more than 26,000 comments |
| May 7, 2024 | Rule published in the Federal Register as 16 CFR Part 910 |
| August 20, 2024 | A federal district court stops the FTC from enforcing the rule |
| October 18, 2024 | FTC appeals the decision |
| September 4, 2025 | FTC proposes an order freeing nearly 1,800 Gateway Services employees from noncompetes |
| September 5, 2025 | FTC votes 3-1 to dismiss its appeals and accept the court's vacatur of the rule |
| September 10, 2025 | FTC Chairman sends noncompete warning letters to healthcare employers and staffing firms |
| February 12, 2026 | Federal Register notice removes the Non-Compete Rule to conform to federal court decisions |
Source: Federal Trade Commission, Noncompete Rule (rule page and related actions); Federal Trade Commission, FTC Announces Rule Banning Noncompetes; Federal Trade Commission, Federal Trade Commission Files to Accede to Vacatur of Non-Compete Clause Rule; Federal Trade Commission, FTC Takes Action to Protect Workers from Noncompete Agreements; Federal Trade Commission, FTC Chairman Ferguson Issues Noncompete Warning Letters to Healthcare Employers and Staffing Companies. Download as image
How many workers have non-compete agreements?
It depends on who is counting and how. The FTC estimate of 30 million is the figure you will see quoted most, and it lines up with the 18% current rate found by Starr, Prescott and Bishara. The Federal Reserve's 2022 household survey came in lower, at 11.4% of adult workers.
Part of the gap comes from the question itself. Many people simply don't know if they signed one. In the Federal Reserve sample, a share of respondents said they weren't sure, and those answers were dropped. The clause is often a paragraph buried in an onboarding packet or a separate agreement handed over with tax forms on day one, so survey answers may understate the real number.
The more telling figure is the lifetime one. At 38%, more than a third of the workforce has agreed to stay out of a competitor's way at some point. If you change jobs a few times over a career, the odds you will face this clause are high.
Do non-competes only cover high earners?
No. Pay matters, but the clause reaches well down the wage ladder. In the BLS data, 32% of workers in the top hourly wage decile were bound, and so were 9% in the lowest decile. The U.S. Treasury reported in March 2016 that 14% of workers earning less than $40,000 had one, and 15% of workers without a four-year degree.
Think about what that means for a cashier or a line cook. They rarely hold trade secrets or a client book. A non-compete in that job mostly limits where they can work next, which weakens their hand when asking for a raise.
By occupation, engineers (38%), computer and math workers (36%) and sales staff (28%) top the list. If you work in one of these fields, assume the paperwork will include one and read it before your start date, not after.
Industry tells a similar story. Professional services (33%) and information and communication (30%) lead the BLS figures. At the other end, legal occupations sit at just 4%, a field where professional ethics rules already bar most non-competes for lawyers.
Is the FTC non-compete ban in effect in 2026?
No. The FTC announced its Non-Compete Clause Rule in April 2024, but a federal court stopped it on August 20, 2024, before it took effect. On September 5, 2025 the FTC voted to accept that ruling, and a Federal Register notice on February 12, 2026 removed the rule.
That leaves state law in charge. The FTC has shifted to case-by-case enforcement. In September 2025 it proposed an order freeing nearly 1,800 Gateway Services employees from their non-competes, and its chairman sent warning letters to healthcare employers and staffing firms. Those actions target specific companies. They do not void the clause in your contract.
The FTC's earlier projections show what was at stake. It estimated a ban would raise the average worker's earnings by $524 a year and add $400-$488 billion in wages over ten years. Treat those as forecasts, not results, since the rule never ran.
Why do employers still use non-competes in states that won't enforce them?
California, North Dakota and Oklahoma have long refused to enforce non-competes, yet workers there still sign them. (Minnesota joined them in 2023, after these surveys were taken.) The Federal Reserve survey found a 7.0% rate in those states, against 12.0% elsewhere. BLS data showed 15.0% compared with 18.5%.
The reason is simple. Most people never test the clause in court. If you believe you are bound, you may turn down a job at a rival or never apply, and the employer gets the effect without ever enforcing anything. A void clause can still change your behavior if you don't know it is void.
So check your state's rules before assuming the worst, and check which state's law the contract picks. A choice-of-law clause pointing to another state can complicate things, especially for remote workers.
Here is a common case. A software developer living in California signs an offer from a company based in another state, and the contract says that state's law governs. If the developer later joins a competitor, the old employer may sue at home and argue its own law applies. California has laws aimed at exactly this, but a fight in another state's court still costs time and money. Knowing this before signing gives you a reason to ask for the clause to be removed or narrowed.
Can you negotiate a non-compete?
Usually more than you think. Only 10% of employees try, so most employers never hear a counter. The best time is before you accept the offer, which is why seeing the clause only afterward, as about 1 in 3 workers do, puts you at a disadvantage.
Ask to see every agreement before you say yes. Then focus on the terms that matter most to you:
- Shorter duration, so the restriction ends sooner after you leave.
- A narrower definition of competitor, listing named companies or a specific product line instead of a whole industry.
- A smaller geographic area tied to where you actually worked.
- Pay during the restricted period, sometimes called garden leave.
- A clause that drops the restriction if you are laid off or fired without cause.
- Swapping the non-compete for a narrower non-solicit that only covers clients you personally served.
What should a business take from these numbers?
In a 2023 GAO survey of 446 private-sector employers, over half said at least some of their workers had non-competes. If you run a small company, ask if you really need one for every role. A blanket clause on hourly staff draws regulatory attention and is often unenforceable anyway.
Narrower tools usually protect what you care about. A solid confidentiality agreement, a client non-solicit for sales staff and clear IP assignment terms cover most real risks, and they are easier to defend if challenged.
Also keep track of who signed what. A clause handed out after someone has already accepted the job is the kind of practice regulators and courts look at closely, and in some states it may not hold up at all.
How ClauseAudit helps
A non-compete is rarely the only restriction in an employment contract. It sits next to non-solicits, confidentiality terms and IP clauses that can do the same job under a different name.
Upload your offer letter or employment agreement and the automated review flags each restrictive clause, explains it in plain English and suggests what to ask for.
- Non-compete length, geographic reach and how broadly it defines a competitor
- Whether the restriction still applies if you are laid off or fired without cause
- Non-solicit and no-hire clauses that act like a non-compete
- Choice-of-law and venue clauses that pick a stricter state
- Confidentiality terms broad enough to block you from working in your field
- IP assignment that reaches side projects and work done on your own time
Frequently asked questions
What percentage of workers have a non-compete?
Estimates range from 11.4% of adult workers in the Federal Reserve's 2022 survey to about 18% in academic and BLS studies. The FTC put the figure at about 30 million workers, nearly one in five, in 2024. Over a whole career, 38% of labor force participants report agreeing to one at some point.
Did the FTC ban non-competes?
It tried. The FTC issued a rule in April 2024, but a federal court blocked it on August 20, 2024. The FTC voted on September 5, 2025 to accept that ruling, and the rule was formally removed on February 12, 2026. Non-competes are now governed by state law, with the FTC acting against individual companies.
Which states don't enforce non-competes?
The studies on this page group California, North Dakota and Oklahoma as states that do not enforce them, and Minnesota banned most new non-competes in 2023. Other states limit them by salary, job type or duration. Check the rules where you live and work, and check which state's law your contract chooses, because that can change the answer.
Can I be asked to sign a non-compete after I accept a job?
It happens often. About 1 in 3 employees are shown the clause only after accepting the offer. Whether it is enforceable then depends on your state, since some require extra pay or notice for a late non-compete. Ask for every agreement in writing before you resign from your current job.
Do low-wage workers sign non-competes?
Yes. The U.S. Treasury found that 14% of workers earning under $40,000 had one, and BLS data put the bottom hourly wage decile at 9%. Many states now restrict non-competes below a salary threshold, so a low-wage worker's clause may be unenforceable even if signed.
How often do people negotiate their non-compete?
Rarely. Only 10% of employees negotiate over the clause, according to research published in 2021. So most employers rarely hear a counter. Asking for a shorter term, a narrower list of competitors or pay during the restricted period is a normal request, and the best time to ask is before you accept.
What does a non-compete cost workers?
The FTC projected in 2024 that a ban would raise the average worker's earnings by $524 a year and add $400-$488 billion in wages over a decade. Those are projections, not measured results. The cost to you is mainly fewer options when you want to leave, and a weaker position when asking for a raise.
Is a non-compete enforceable if I am laid off?
It depends on your state and on the wording. Some contracts say the restriction applies however the job ends, and some courts still enforce that. Others are silent. If you are negotiating, ask for language that cancels the non-compete if you are let go without cause.
Use this data
Every chart and card below is free to reuse under CC BY 4.0. Download what you need and link back to this page.
 Stat cards
 Key findings card
 Infographic
 Share of workers bound by a noncompete, by hourly wage decile (NLSY97, 2017-18) (%)
 Share of workers bound by a noncompete, by industry (NLSY97, 2017-18) (%)
 Share of workers bound by a noncompete, by occupation (NLSY97, 2017-18) (%)
 Share of adult workers with a non-compete, by industry (Federal Reserve SHED, 2022) (%)
 How many US workers are bound by noncompetes: the main national estimates
 Noncompetes are still signed where states refuse to enforce them
 The federal noncompete ban: what happened to the FTC rule
Embed the infographic
Free to share on your site, blog or slides under CC BY 4.0. Please keep the credit link.
Sources and method
Every number on this page comes from the sources below, each opened and read on or before October 18, 2026. A second, independent review checked every figure against its source and corrected anything that did not match. Figures that could not be confirmed were left out.
- Federal Trade Commission, FTC Announces Rule Banning Noncompetes (April 23, 2024)
- Federal Trade Commission, Fact Sheet on FTC's Proposed Final Noncompete Rule (April 23, 2024 (status note updated after September 5, 2025))
- Federal Trade Commission, Noncompete Rule (rule page and related actions) (Page as read on 2026-10-18; lists actions through February 12, 2026)
- Federal Trade Commission, Federal Trade Commission Files to Accede to Vacatur of Non-Compete Clause Rule (September 5, 2025)
- Federal Trade Commission, FTC Takes Action to Protect Workers from Noncompete Agreements (September 4, 2025)
- Federal Trade Commission, FTC Chairman Ferguson Issues Noncompete Warning Letters to Healthcare Employers and Staffing Companies (September 10, 2025)
- Federal Reserve Bank of Minneapolis, New data on non-compete contracts and what they mean for workers (June 21, 2023 (2022 SHED data))
- University of Chicago, Journal of Law and Economics, Noncompete Agreements in the US Labor Force (Starr, Prescott and Bishara), Journal of Law and Economics, Vol. 64, No. 1 (2021)
- U.S. Bureau of Labor Statistics, Noncompete agreements, bargaining, and wages: evidence from the National Longitudinal Survey of Youth 1997 (Rothstein and Starr), Monthly Labor Review (June 2022)
- U.S. Bureau of Labor Statistics, Chart 2. Incidence (in percent) of NCAs in the NLSY97 by hourly wage decile (data table) (June 2022)
- U.S. Bureau of Labor Statistics, Chart 3. Incidence (in percent) of NCAs in the NLSY 97 by occupation (data table) (June 2022)
- U.S. Bureau of Labor Statistics, Chart 4. Incidence (in percent) of NCAs in the NLSY97 by industry (data table) (June 2022)
- U.S. Department of the Treasury, Office of Economic Policy, Non-compete Contracts: Economic Effects and Policy Implications (March 2016)
- U.S. Government Accountability Office, Noncompete Agreements: Use is Widespread to Protect Business' Stated Interests, Restricts Job Mobility, and May Affect Wages (GAO-23-103785) (May 11, 2023 (publicly released May 16, 2023))
Cite this page
ClauseAudit, “Non-Compete Statistics 2026: How Many Workers Are Bound and What It Costs Them”, updated October 18, 2026, https://clauseaudit.com/data/non-compete-statistics. Free to reuse with a link back (CC BY 4.0).
This page summarises published data and law as checked on October 18, 2026. Figures are updated as new editions are released, and your own situation may differ. It is general information, not legal, tax or financial advice.