Average Commercial Rent per Square Foot 2026: Office, Retail and Industrial by Market
By ClauseAudit Research · 6 sources ·
What is the average commercial rent per square foot?
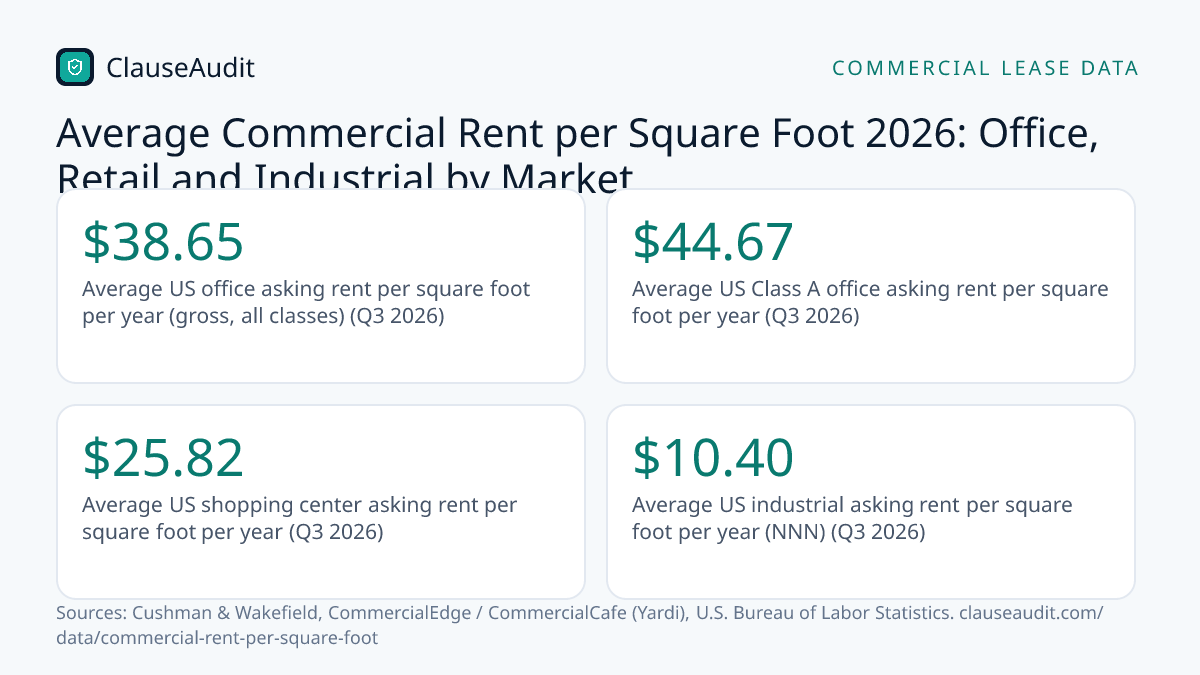
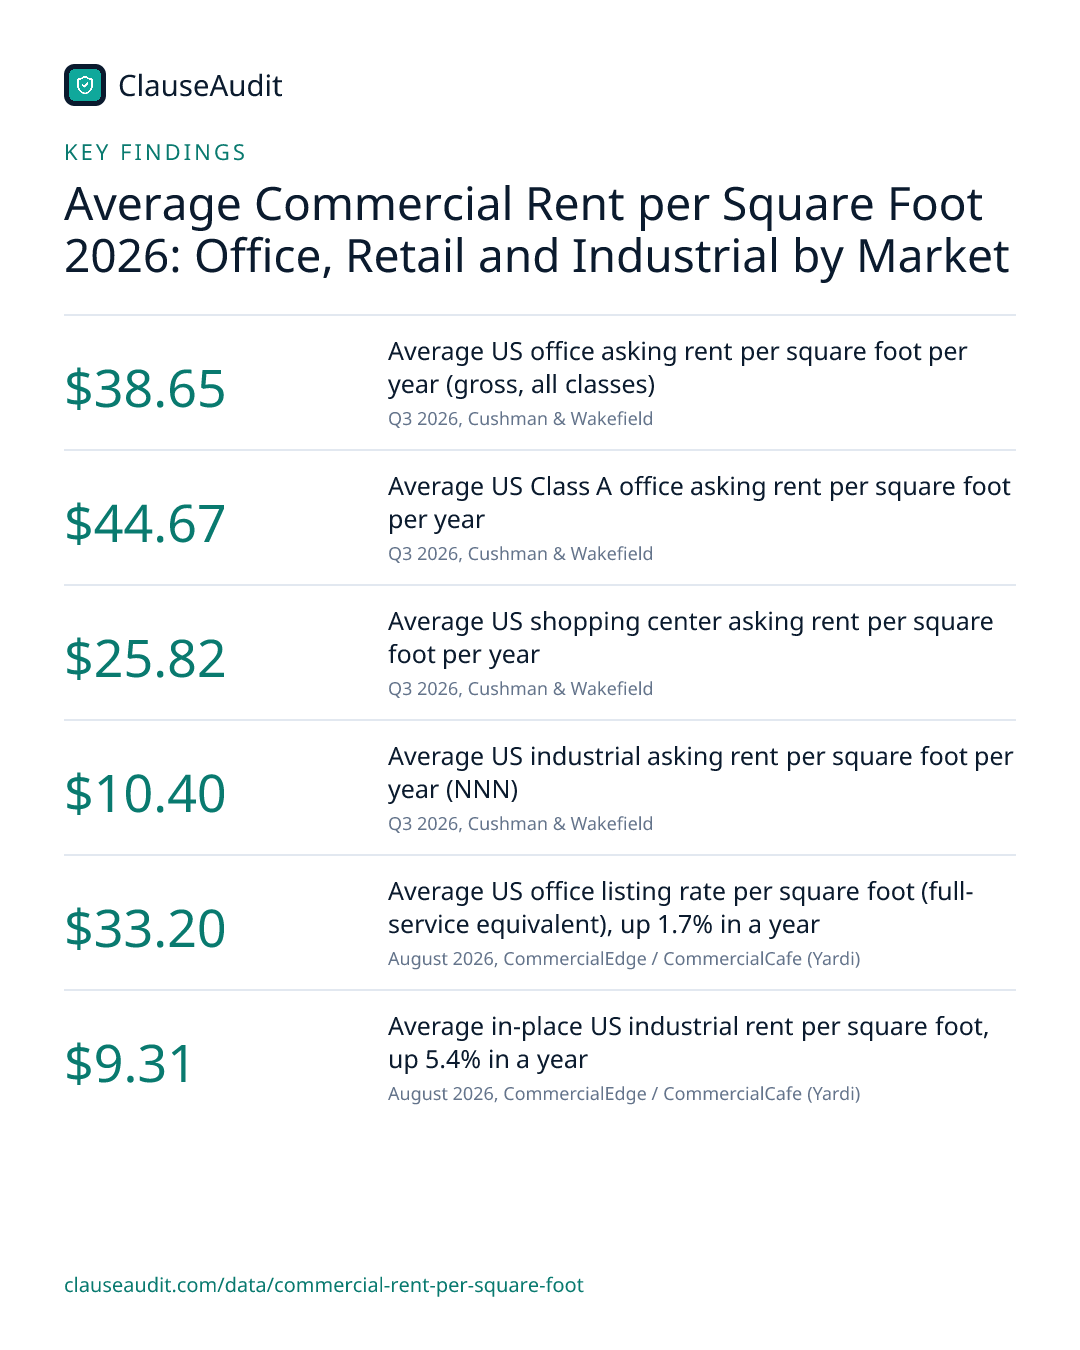
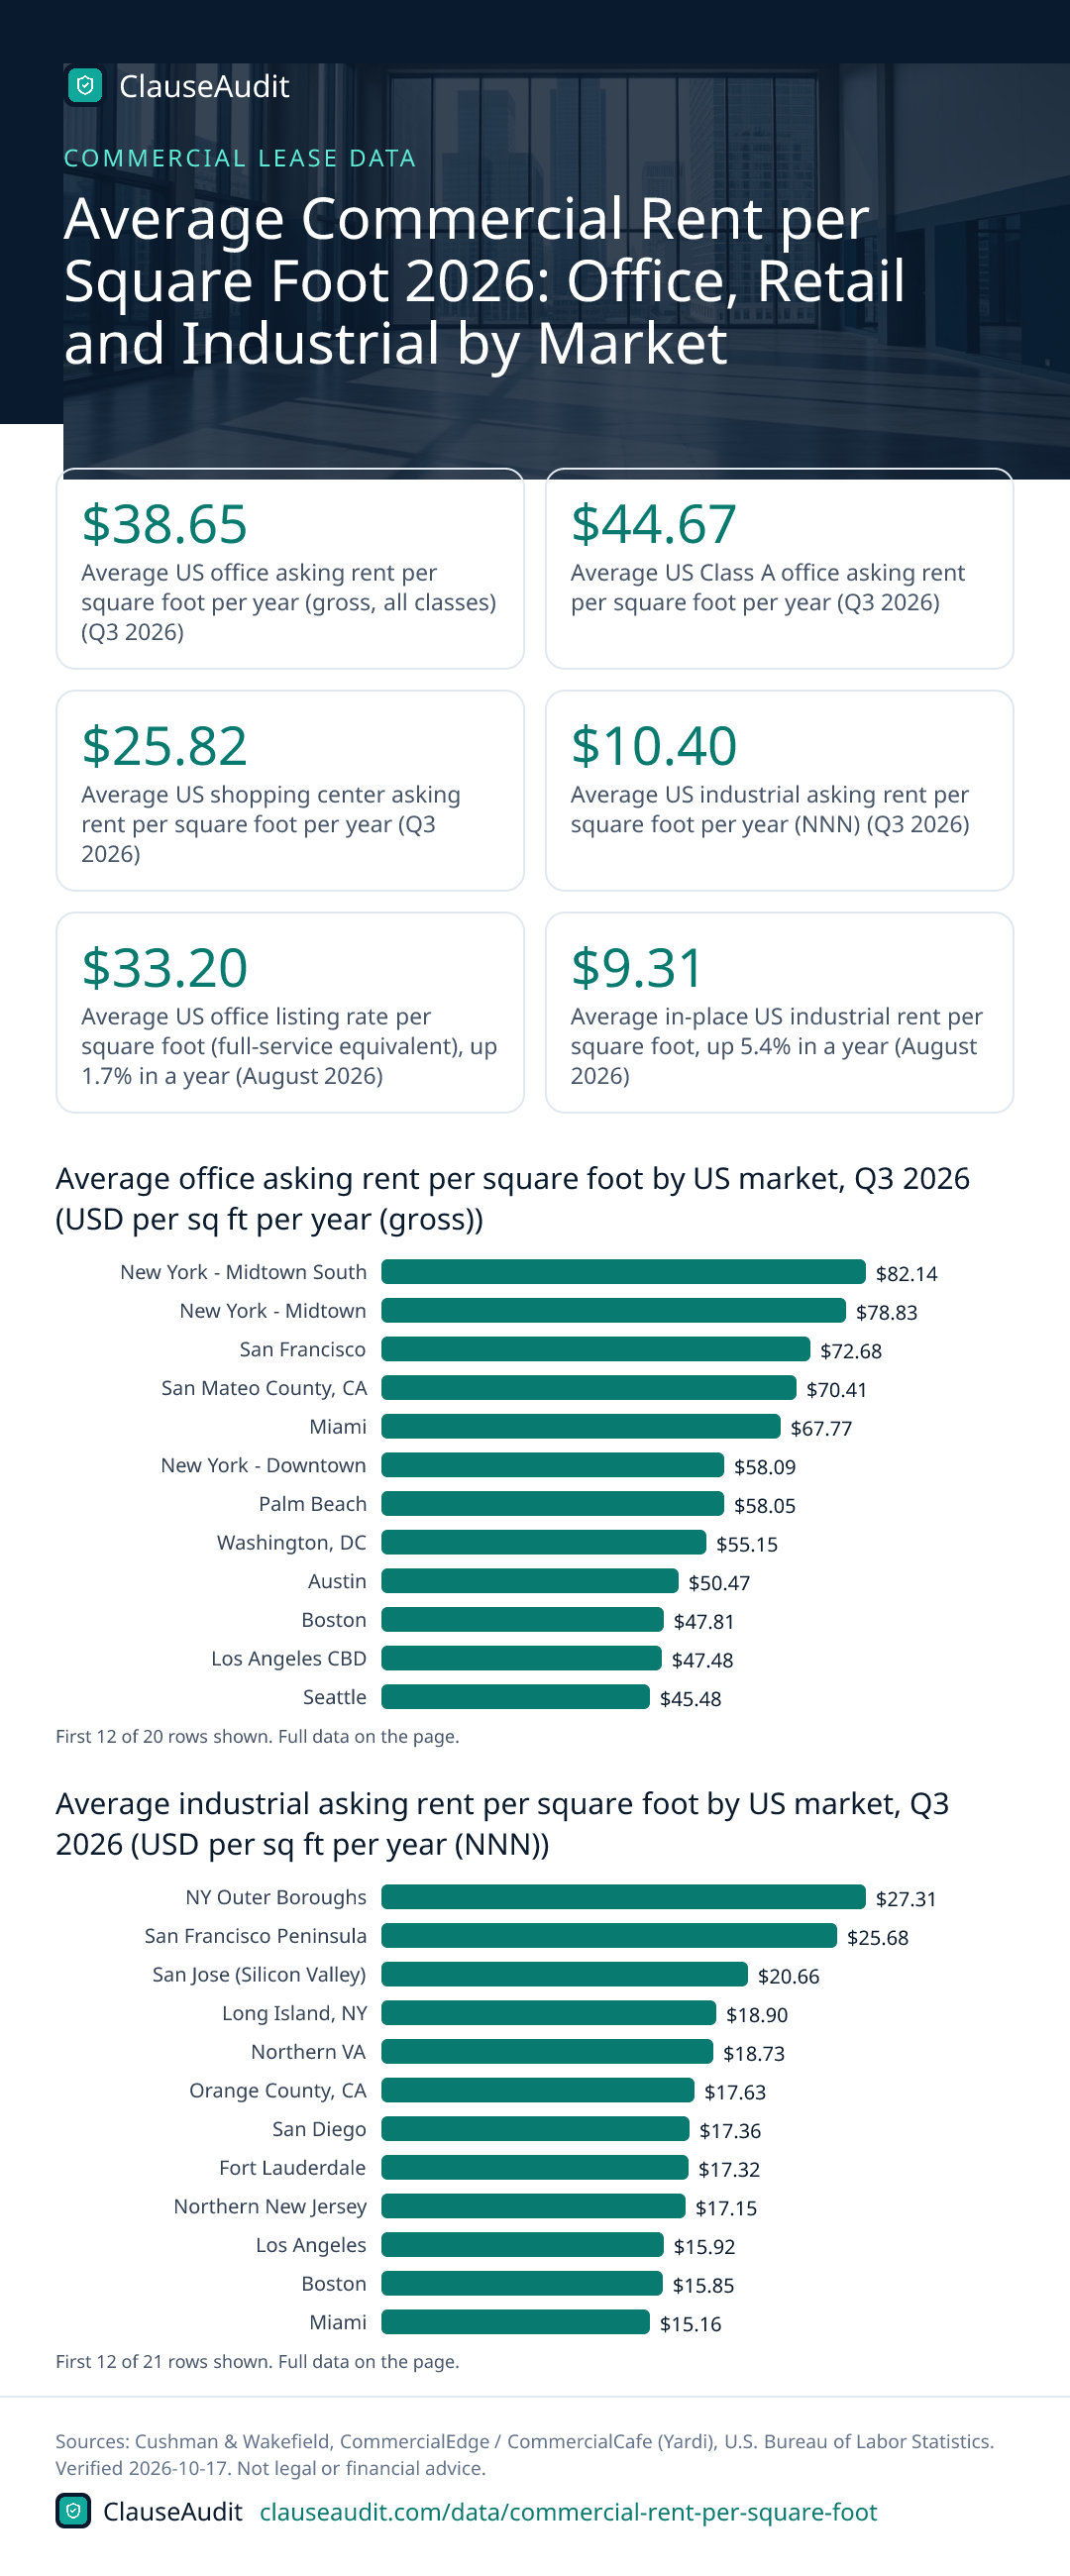
It depends on the property type. In Q3 2026, US office space asked an average $38.65 per square foot per year (gross), shopping center retail $25.82, and industrial $10.40 on a triple-net basis. Class A office averaged $44.67. Market matters even more: Midtown South in New York topped office at $82.14.
- Average US office asking rent per square foot per year (gross, all classes) (Q3 2026, Cushman & Wakefield)
- $38.65
- Average US Class A office asking rent per square foot per year (Q3 2026, Cushman & Wakefield)
- $44.67
- Average US shopping center asking rent per square foot per year (Q3 2026, Cushman & Wakefield)
- $25.82
- Average US industrial asking rent per square foot per year (NNN) (Q3 2026, Cushman & Wakefield)
- $10.40
- Average US office listing rate per square foot (full-service equivalent), up 1.7% in a year (August 2026, CommercialEdge / CommercialCafe (Yardi))
- $33.20
- Average in-place US industrial rent per square foot, up 5.4% in a year (August 2026, CommercialEdge / CommercialCafe (Yardi))
- $9.31
- Highest office asking rent of any US market tracked: New York Midtown South (Q3 2026, Cushman & Wakefield)
- $82.14
- Yearly rise in producer prices charged by US nonresidential building lessors (September 2025 to September 2026, U.S. Bureau of Labor Statistics)
- 5.8%
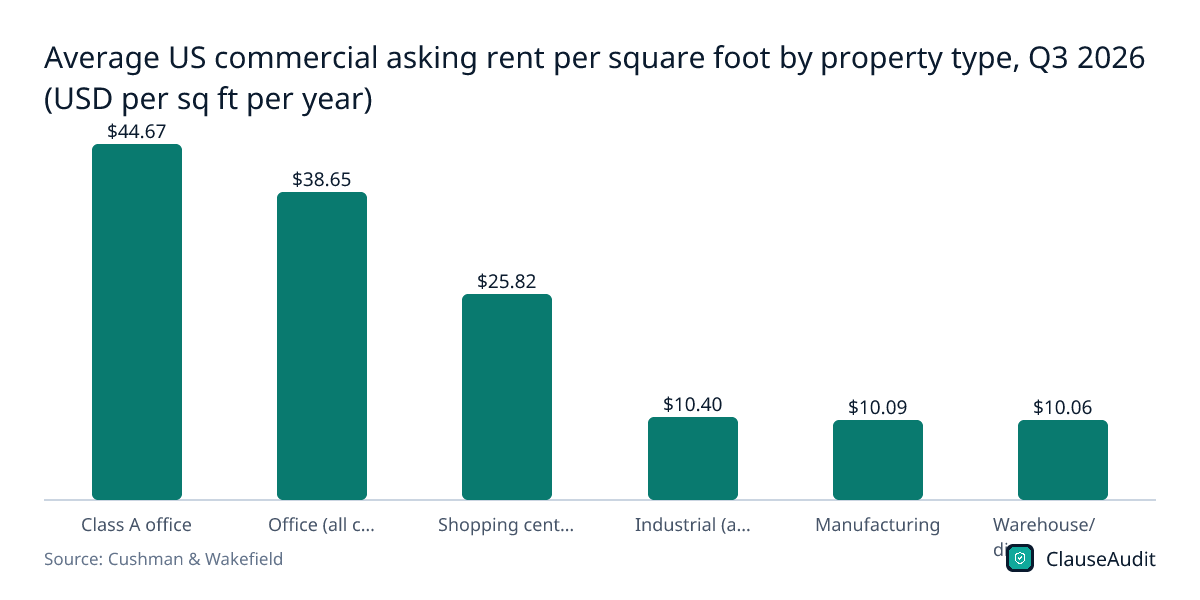
Commercial rent is quoted per square foot per year, and the national averages split sharply by property type. Office space asked $38.65 in Q3 2026, shopping center retail $25.82 and industrial $10.40. Those three numbers are not measured the same way, so a lower number does not always mean a cheaper lease.
Use this page to check whether a quote you have been given is in the normal range for your type of space and your market. Then read the lease itself, because the rent per square foot is only the start. How the rent grows, what costs get passed through to you, and how the space is measured can move your real cost far more than a dollar or two on the asking rate.
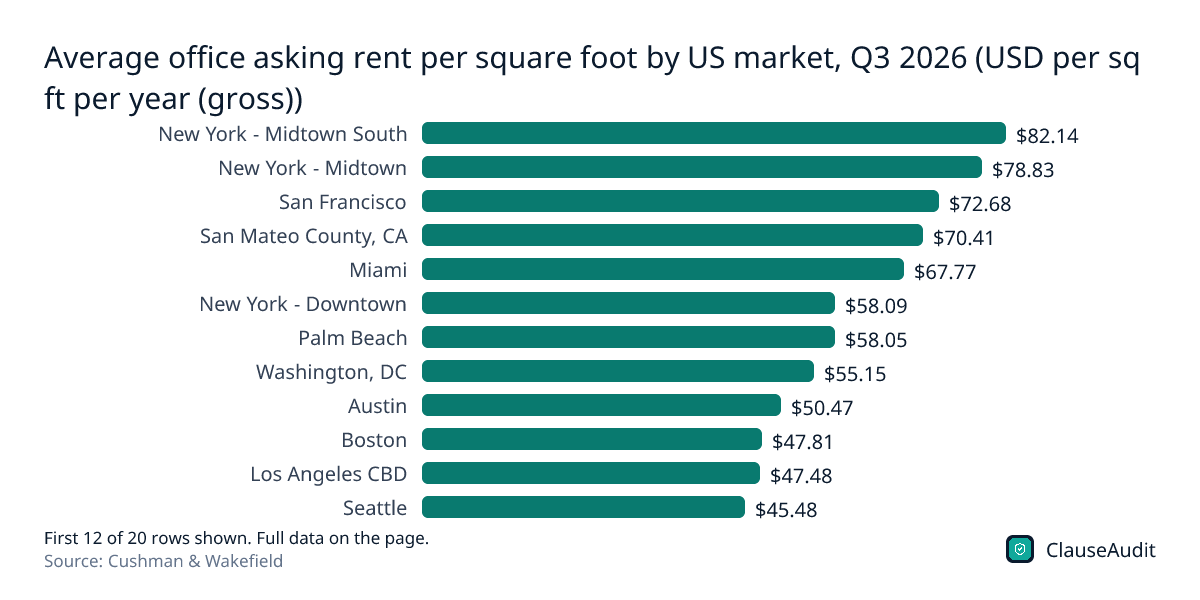
Average office asking rent per square foot by US market, Q3 2026 (USD per sq ft per year (gross))
Chart data
| Label | Value |
|---|---|
| New York - Midtown South | $82.14 |
| New York - Midtown | $78.83 |
| San Francisco | $72.68 |
| San Mateo County, CA | $70.41 |
| Miami | $67.77 |
| New York - Downtown | $58.09 |
| Palm Beach | $58.05 |
| Washington, DC | $55.15 |
| Austin | $50.47 |
| Boston | $47.81 |
| Los Angeles CBD | $47.48 |
| Seattle | $45.48 |
| Chicago | $37.13 |
| Dallas | $34.43 |
| Atlanta | $34.01 |
| Denver | $33.80 |
| Houston | $32.08 |
| Phoenix | $30.68 |
| Philadelphia | $29.06 |
| Detroit | $20.45 |
Office rent swings widely by city. Midtown South in New York asked $82.14, while Detroit asked $20.45, so a national average tells you little about your own market.
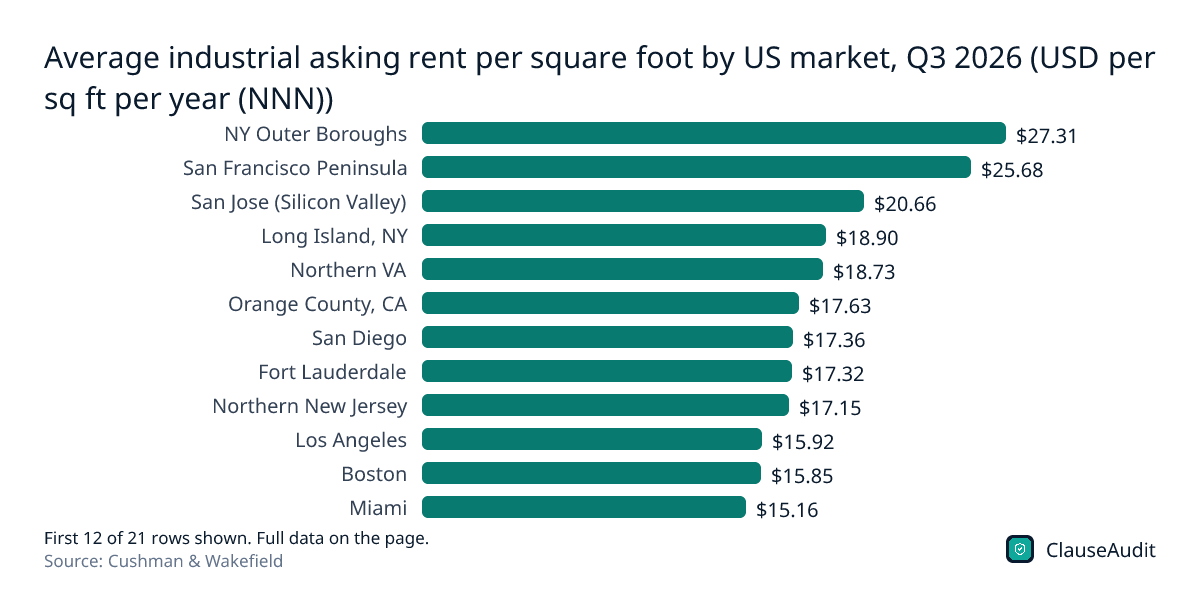
Download this chart (PNG)Average industrial asking rent per square foot by US market, Q3 2026 (USD per sq ft per year (NNN))
Chart data
| Label | Value |
|---|---|
| NY Outer Boroughs | $27.31 |
| San Francisco Peninsula | $25.68 |
| San Jose (Silicon Valley) | $20.66 |
| Long Island, NY | $18.90 |
| Northern VA | $18.73 |
| Orange County, CA | $17.63 |
| San Diego | $17.36 |
| Fort Lauderdale | $17.32 |
| Northern New Jersey | $17.15 |
| Los Angeles | $15.92 |
| Boston | $15.85 |
| Miami | $15.16 |
| Phoenix | $13.51 |
| Seattle | $12.52 |
| Inland Empire, CA | $12.17 |
| Dallas/Fort Worth | $9.76 |
| Houston | $8.16 |
| Atlanta | $7.71 |
| Chicago | $7.53 |
| Indianapolis | $6.60 |
| Memphis | $4.30 |
Industrial rents run from $27.31 in the NY Outer Boroughs down to $4.30 in Memphis. These are triple-net figures, so taxes, insurance and maintenance come on top.
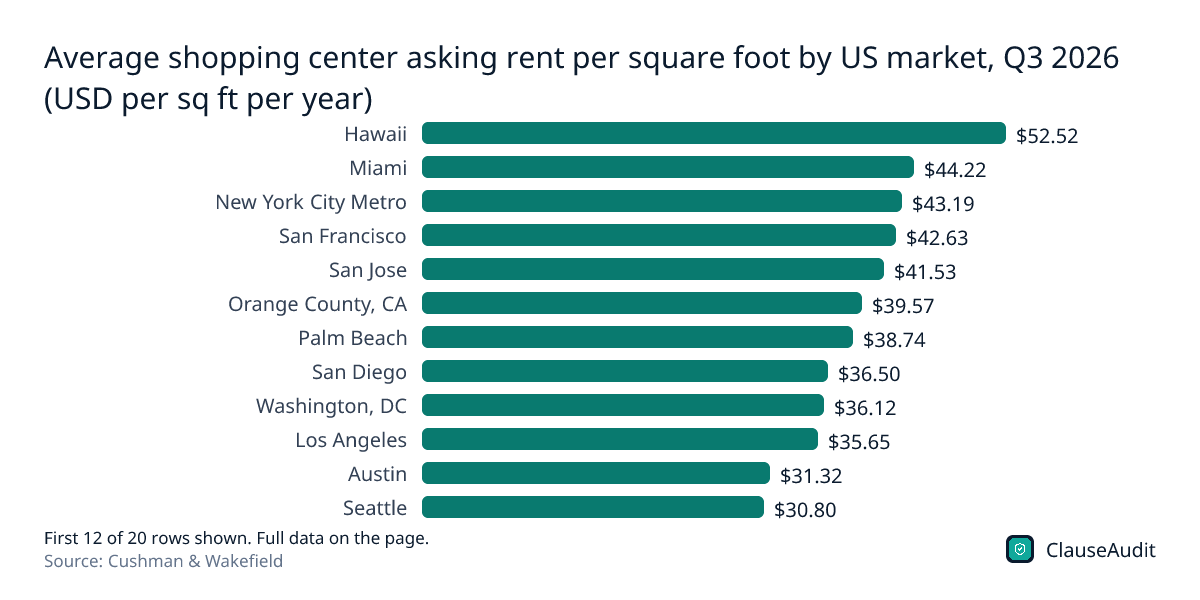
Download this chart (PNG)Average shopping center asking rent per square foot by US market, Q3 2026 (USD per sq ft per year)
Chart data
| Label | Value |
|---|---|
| Hawaii | $52.52 |
| Miami | $44.22 |
| New York City Metro | $43.19 |
| San Francisco | $42.63 |
| San Jose | $41.53 |
| Orange County, CA | $39.57 |
| Palm Beach | $38.74 |
| San Diego | $36.50 |
| Washington, DC | $36.12 |
| Los Angeles | $35.65 |
| Austin | $31.32 |
| Seattle | $30.80 |
| Nashville | $30.36 |
| Phoenix | $26.63 |
| Boston | $25.68 |
| Dallas/Fort Worth | $24.95 |
| Houston | $24.61 |
| Atlanta | $24.55 |
| Chicago | $22.57 |
| Syracuse, NY | $14.11 |
Shopping center rents top out in Hawaii at $52.52 and Miami at $44.22. Malls, outlets and freestanding stores are not in these numbers, so a mall space or a corner storefront can price quite differently.
Download this chart (PNG)Average US commercial asking rent per square foot by property type, Q3 2026 (USD per sq ft per year)
Chart data
| Label | Value (USD per sq ft per year) |
|---|---|
| Class A office | $44.67 |
| Office (all classes) | $38.65 |
| Shopping center retail | $25.82 |
| Industrial (all) | $10.40 |
| Manufacturing | $10.09 |
| Warehouse/distribution | $10.06 |
Office looks expensive next to industrial, but office is quoted gross and industrial is triple-net. Add your share of operating costs to the industrial figure before you compare.
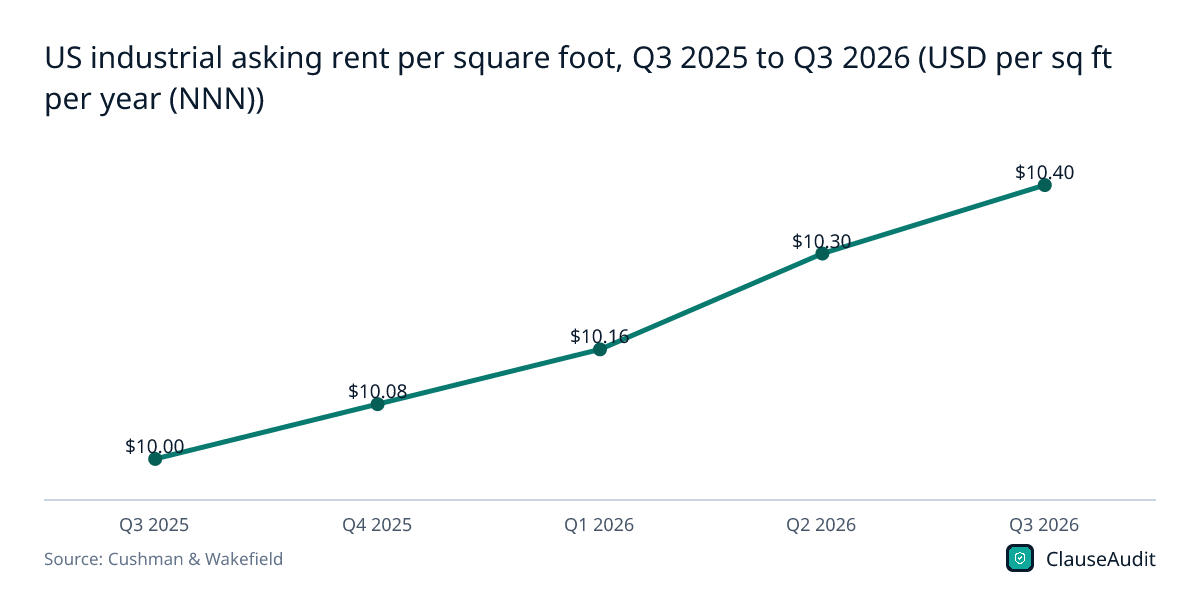
Download this chart (PNG)US industrial asking rent per square foot, Q3 2025 to Q3 2026 (USD per sq ft per year (NNN))
Chart data
| Label | Value (USD per sq ft per year (NNN)) |
|---|---|
| Q3 2025 | $10.00 |
| Q4 2025 | $10.08 |
| Q1 2026 | $10.16 |
| Q2 2026 | $10.30 |
| Q3 2026 | $10.40 |
Industrial asking rent climbed every quarter, from $10.00 in Q3 2025 to $10.40 in Q3 2026. If you sign a multi-year warehouse lease, expect the landlord to ask for a yearly escalation.
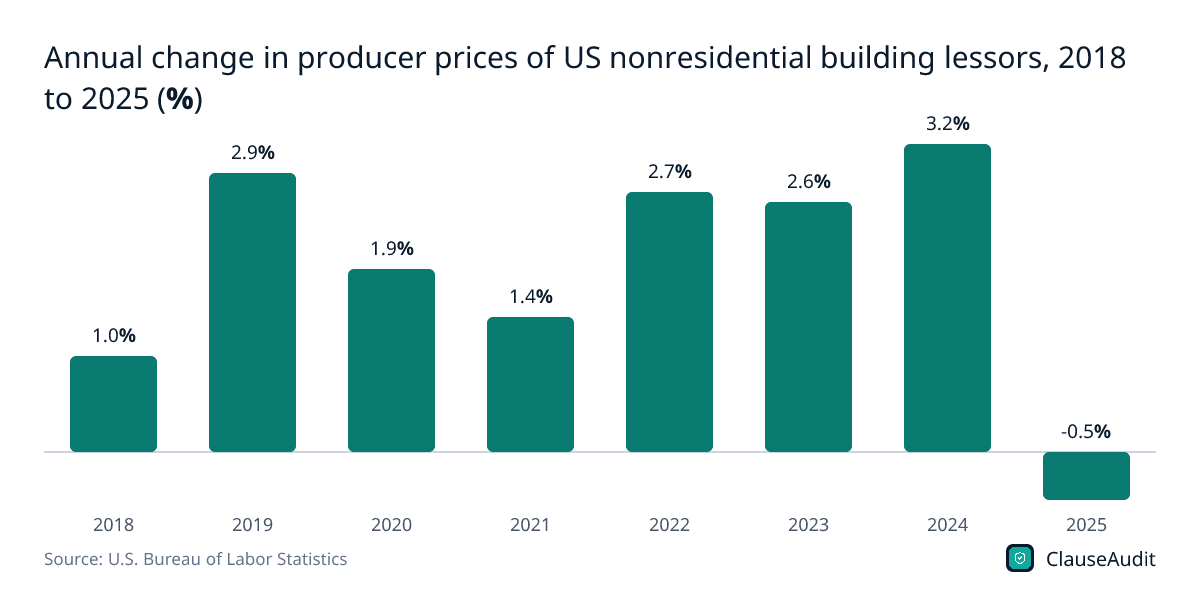
Download this chart (PNG)Annual change in producer prices of US nonresidential building lessors, 2018 to 2025 (%)
Chart data
| Label | Value (%) |
|---|---|
| 2018 | 1.0% |
| 2019 | 2.9% |
| 2020 | 1.9% |
| 2021 | 1.4% |
| 2022 | 2.7% |
| 2023 | 2.6% |
| 2024 | 3.2% |
| 2025 | -0.5% |
Prices charged by nonresidential landlords rose every year from 2018 to 2024, peaking at 3.2% in 2024, then fell 0.5% in 2025. In most years, those prices moved up.
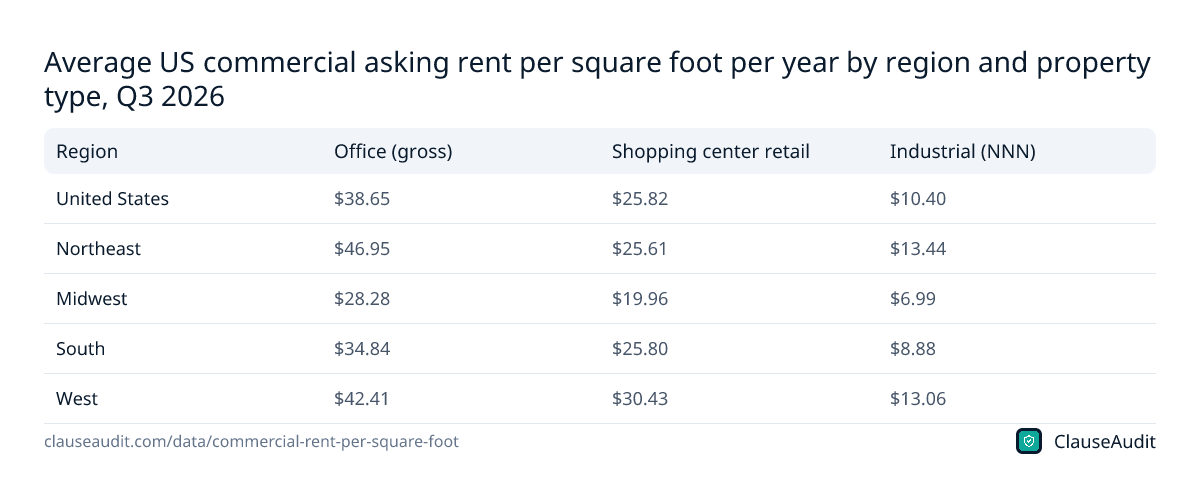
Download this chart (PNG)Average US commercial asking rent per square foot per year by region and property type, Q3 2026
| Region | Office (gross) | Shopping center retail | Industrial (NNN) |
|---|---|---|---|
| United States | $38.65 | $25.82 | $10.40 |
| Northeast | $46.95 | $25.61 | $13.44 |
| Midwest | $28.28 | $19.96 | $6.99 |
| South | $34.84 | $25.80 | $8.88 |
| West | $42.41 | $30.43 | $13.06 |
Source: Cushman & Wakefield, MarketBeat United States Office Q3 2026; Cushman & Wakefield, MarketBeat United States Retail (Shopping Center) Q3 2026; Cushman & Wakefield, MarketBeat United States Industrial Q3 2026. Download as image
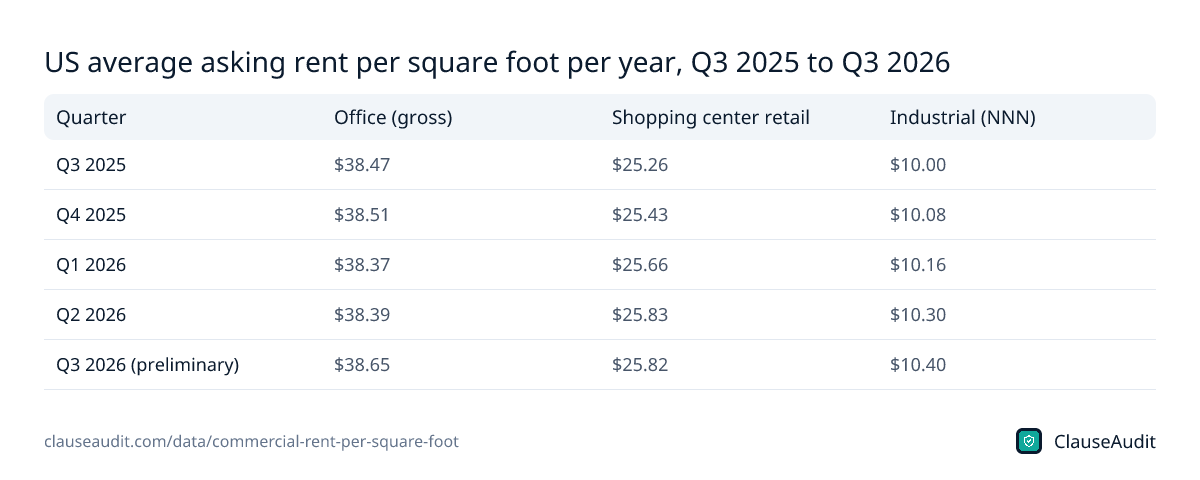
US average asking rent per square foot per year, Q3 2025 to Q3 2026
| Quarter | Office (gross) | Shopping center retail | Industrial (NNN) |
|---|---|---|---|
| Q3 2025 | $38.47 | $25.26 | $10.00 |
| Q4 2025 | $38.51 | $25.43 | $10.08 |
| Q1 2026 | $38.37 | $25.66 | $10.16 |
| Q2 2026 | $38.39 | $25.83 | $10.30 |
| Q3 2026 (preliminary) | $38.65 | $25.82 | $10.40 |
Source: Cushman & Wakefield, MarketBeat United States Office Q3 2026; Cushman & Wakefield, MarketBeat United States Retail (Shopping Center) Q3 2026; Cushman & Wakefield, MarketBeat United States Industrial Q3 2026. Download as image
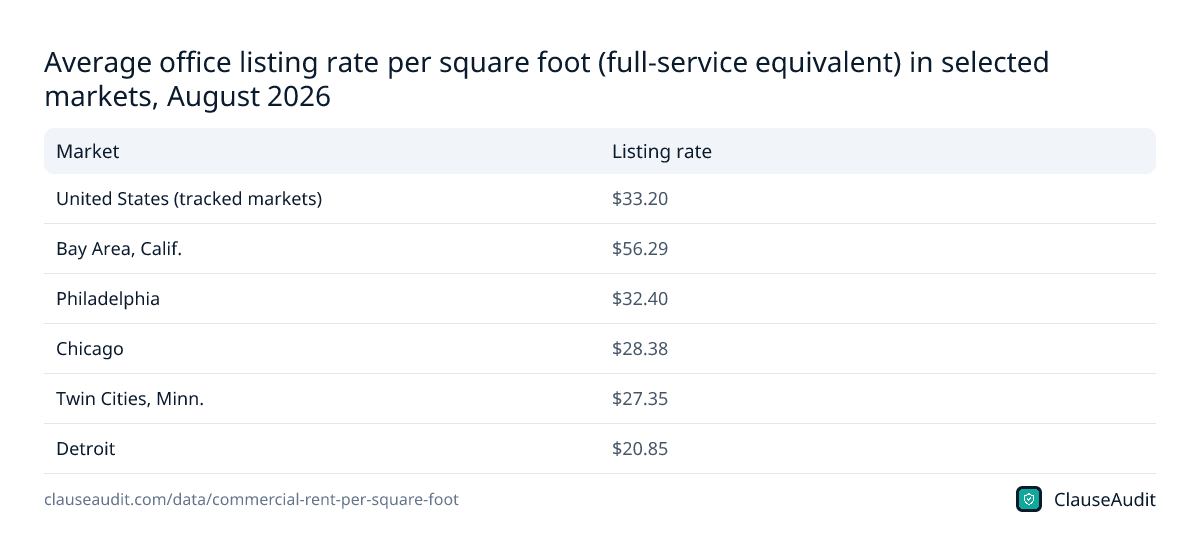
Average office listing rate per square foot (full-service equivalent) in selected markets, August 2026
| Market | Listing rate |
|---|---|
| United States (tracked markets) | $33.20 |
| Bay Area, Calif. | $56.29 |
| Philadelphia | $32.40 |
| Chicago | $28.38 |
| Twin Cities, Minn. | $27.35 |
| Detroit | $20.85 |
Source: CommercialEdge / CommercialCafe (Yardi), U.S. Office Market Report, September 2026. Download as image
What is the average commercial rent per square foot in 2026?
The answer changes with the kind of space you need. In Q3 2026, the average US office asking rent was $38.65 per square foot per year across all classes, and Class A office averaged $44.67. Shopping center retail asked $25.82. Industrial space asked $10.40, with warehouse and distribution space at $10.06 and manufacturing at $10.09.
Region matters too. Northeast office averaged $46.95 while Midwest office averaged $28.28. Western shopping centers asked $30.43 against $19.96 in the Midwest. If you are opening a shop in Chicago, the Hawaii number is irrelevant to you. Look up your own market in the charts above and start there.
One more thing. All the Q3 2026 figures are preliminary and are asking rents, which is what landlords list vacant space for. The deal you sign can land below the asking rate, especially for office space in a soft building, or above it in a tight industrial market. Ask the listing broker what similar spaces in the building actually leased for in the past year.
Which US markets have the highest and lowest commercial rent?
Coastal metros sit at the top of almost every list. For office, Midtown South and Midtown in New York, San Francisco, San Mateo County and Miami all asked $67.77 per square foot or more in Q3 2026, with San Francisco at $72.68. At the other end, Philadelphia asked $29.06 and Detroit $20.45.
Industrial follows a similar pattern with a twist. Land near dense cities is scarce, so the NY Outer Boroughs asked $27.31 and the San Francisco Peninsula $25.68. Big logistics hubs with room to build are far cheaper: Dallas/Fort Worth at $9.76, Chicago at $7.53, Indianapolis at $6.60 and Memphis at $4.30.
For retail, Hawaii led at $52.52, with Miami, the New York City Metro and San Francisco all at $42.63 or more. Syracuse, NY asked $14.11.
If you run a business that could work in more than one place, such as a small warehouse operation, a back office or a studio, these gaps are big enough to change where you set up. A move from one metro to a cheaper one nearby can matter more than any discount you squeeze out of a single landlord.
Why do office, retail and industrial rents look so different?
Part of the gap is real. A downtown office tower costs far more to build, staff and run than a warehouse on the edge of town. But part of it is how the rent is quoted.
Office rents here are gross, which means the landlord's operating costs are built into the number. Industrial rents are triple-net, or NNN, which means you pay the base rent plus your share of property taxes, insurance and maintenance on top. A warehouse quoted at $10.40 NNN can cost noticeably more once those pass-throughs are added.
Sources also measure differently. Cushman & Wakefield put average office asking rent at $38.65 for Q3 2026. CommercialEdge put the average office listing rate at $33.20 for August 2026, using its own method and set of markets. Neither is wrong. Just compare a quote to a benchmark built the same way, gross to gross and NNN to NNN.
How do you calculate commercial rent per square foot?
Commercial rent in the US is usually quoted as an annual figure. To get your yearly base rent, multiply the rate by the square footage in the lease. To get your monthly payment, divide that yearly figure by twelve. People get burned when they read an annual rate as a monthly one, or the other way around, so confirm which one your broker means.
Then add what the base rent leaves out. On a triple-net lease, ask the landlord for last year's actual taxes, insurance and common area maintenance per square foot, and add that to the base rate. On a gross or modified gross lease, ask what costs, if any, can still be passed to you.
Also check which square footage the rent applies to. Many leases charge on rentable square feet, which includes a share of lobbies, hallways and restrooms, not just the usable space you occupy. Two spaces with the same rate can carry very different bills.
How much does commercial rent go up each year?
Over the past year, the pace depended on property type. Industrial asking rent rose 4.0%, and in-place industrial rent, what existing tenants actually pay, rose 5.4% to $9.31 by August 2026. Shopping center rent rose 2.2%. Office asking rent barely moved, up 0.5% from $38.47 to $38.65.
Producer prices charged by nonresidential landlords rose 5.8% from September 2025 to September 2026, a figure from a volatile monthly series that may be revised. Across 2018 to 2025 the yearly change ranged from -0.5% to 3.2%.
Your lease decides your increase, not the market. Most commercial leases include a fixed annual bump or a tie to an inflation index. A fixed step you agree to on day one applies every year, even if rents in your area go flat. If the market is soft, as office has been, you have room to ask for a smaller step or a cap.
What a small business tenant should do with these numbers
- Match the benchmark to your space: compare office quotes to office averages and industrial quotes to industrial averages, and check whether each is gross or NNN.
- Use your market, not the national figure. A restaurant in Miami and a print shop in Indianapolis face very different rents.
- Ask for the total occupancy cost per square foot, base rent plus all pass-throughs, in writing before you sign.
- Push back where rents are flat. With US office asking rent up only 0.5% in a year, a tenant has a real case for free rent, a tenant improvement allowance or a lower escalation.
- Expect less room in industrial. With asking rent up 4.0% in a year, landlords have less reason to bend on the rate, so focus your effort on caps for operating cost increases and on renewal options.
- Read the personal guarantee. Many landlords ask small business owners to back the lease personally, which can put your own savings at risk if the business closes.
How ClauseAudit helps
A fair rent per square foot can still sit inside a costly lease. The real money is often in the escalation clause, the operating expense pass-throughs and the guarantee, and those are easy to skim past.
Upload your commercial lease and our automated review flags the clauses that drive your total cost and your risk, explains each one in plain English, and suggests what to ask the landlord to change.
- Rent and escalation: whether the yearly increase is a fixed step or tied to an index, and whether it has a cap
- Lease type and pass-throughs: what gross, modified gross or NNN means in your lease, and which taxes, insurance and CAM costs you pay
- Square footage: whether rent is charged on rentable or usable area, and how the landlord measures it
- Personal guarantee: how much you owe personally if the business fails, and whether the guarantee shrinks or ends over time
- Late fees and default: grace periods, late charges and how fast the landlord can lock you out or accelerate rent
- Renewal and termination: renewal options, how renewal rent is set, and any early exit rights
Frequently asked questions
What is a good price per square foot for commercial rent?
A good price is one that sits at or below the average for your property type and market. In Q3 2026 the US office average was $38.65 gross, shopping center retail was $25.82 and industrial was $10.40 NNN. Compare your quote to your own city in the charts above, then add pass-through costs before deciding whether it is a fair deal.
Is commercial rent per square foot monthly or yearly?
In the US it is usually yearly. A quote of $25.82 means that much per square foot per year, not per month. To find the monthly payment, multiply the rate by your square footage and divide by twelve. Some brokers in a few markets quote monthly, so ask if you are not sure.
What does NNN mean in commercial rent?
NNN, or triple-net, means you pay base rent plus your share of property taxes, building insurance and maintenance. Industrial rents are usually quoted this way, which is why the US industrial average of $10.40 looks low next to office. Ask the landlord for actual pass-through costs per square foot so you can see the full number.
What is the most expensive market for office space?
Among the markets tracked in Q3 2026, Midtown South in New York had the highest office asking rent at $82.14 per square foot per year. Class A space there asked $106.62. Midtown Manhattan at $78.83 and San Francisco at $72.68 were next among the markets shown on this page.
How much is warehouse rent per square foot in 2026?
US warehouse and distribution space asked $10.06 per square foot per year on a triple-net basis in Q3 2026. Rents vary widely: the NY Outer Boroughs asked $27.31 for industrial space overall, while Memphis asked $4.30. Remember that taxes, insurance and maintenance are added on top of these rates.
Why are two office rent averages different?
Different firms measure different things. Cushman & Wakefield reported an average gross office asking rent of $38.65 for Q3 2026 across its markets. CommercialEdge reported a full-service equivalent listing rate of $33.20 for August 2026 using its own method and market list. Pick one source and compare like with like.
What is the difference between asking rent and in-place rent?
Asking rent is what landlords list vacant space for today. In-place rent is what existing tenants pay under leases they already signed. For industrial space, CommercialEdge put in-place rent at $9.31 in August 2026. That sits below the $10.40 Cushman & Wakefield asking average for Q3 2026, though the two come from different sources. Older leases signed at lower rents help explain the gap.
Can I negotiate commercial rent per square foot?
Usually, yes. Office asking rent rose just 0.5% in the year to Q3 2026, so many office landlords have room to give on rent, free months or build-out money. Industrial rose 4.0%, which leaves less room on the rate, but you can still negotiate the escalation, operating cost caps and renewal terms.
Use this data
Every chart and card below is free to reuse under CC BY 4.0. Download what you need and link back to this page.
 Stat cards
 Key findings card
 Infographic
 Average office asking rent per square foot by US market, Q3 2026 (USD per sq ft per year (gross))
 Average industrial asking rent per square foot by US market, Q3 2026 (USD per sq ft per year (NNN))
 Average shopping center asking rent per square foot by US market, Q3 2026 (USD per sq ft per year)
 Average US commercial asking rent per square foot by property type, Q3 2026 (USD per sq ft per year)
 US industrial asking rent per square foot, Q3 2025 to Q3 2026 (USD per sq ft per year (NNN))
 Annual change in producer prices of US nonresidential building lessors, 2018 to 2025 (%)
 Average US commercial asking rent per square foot per year by region and property type, Q3 2026
 US average asking rent per square foot per year, Q3 2025 to Q3 2026
 Average office listing rate per square foot (full-service equivalent) in selected markets, August 2026
Embed the infographic
Free to share on your site, blog or slides under CC BY 4.0. Please keep the credit link.
Sources and method
Every number on this page comes from the sources below, each opened and read on or before October 17, 2026. A second, independent review checked every figure against its source and corrected anything that did not match. Figures that could not be confirmed were left out.
- Cushman & Wakefield, MarketBeat United States Office Q3 2026 (Q3 2026 (posted October 14, 2026))
- Cushman & Wakefield, MarketBeat United States Industrial Q3 2026 (Q3 2026 (posted October 14, 2026))
- Cushman & Wakefield, MarketBeat United States Retail (Shopping Center) Q3 2026 (Q3 2026 (posted October 14, 2026))
- CommercialEdge / CommercialCafe (Yardi), U.S. Office Market Report, September 2026 (September 17, 2026 (data as of August 2026))
- CommercialEdge / CommercialCafe (Yardi), U.S. Industrial Market Report, September 2026 (September 29, 2026 (data as of August 2026))
- U.S. Bureau of Labor Statistics, Producer Price Index by Industry: Lessors of Nonresidential Buildings (series PCU531120531120) (Data through September 2026 (September 2026 preliminary), retrieved 2026-10-16)
Cite this page
ClauseAudit, “Average Commercial Rent per Square Foot 2026: Office, Retail and Industrial by Market”, updated October 17, 2026, https://clauseaudit.com/data/commercial-rent-per-square-foot. Free to reuse with a link back (CC BY 4.0).
This page summarises published data and law as checked on October 17, 2026. Figures are updated as new editions are released, and your own situation may differ. It is general information, not legal, tax or financial advice.