Office Vacancy Rates by City 2026 (and What They Mean for Your Lease Negotiation)
By ClauseAudit Research · 1 sources ·
What is the office vacancy rate by city?
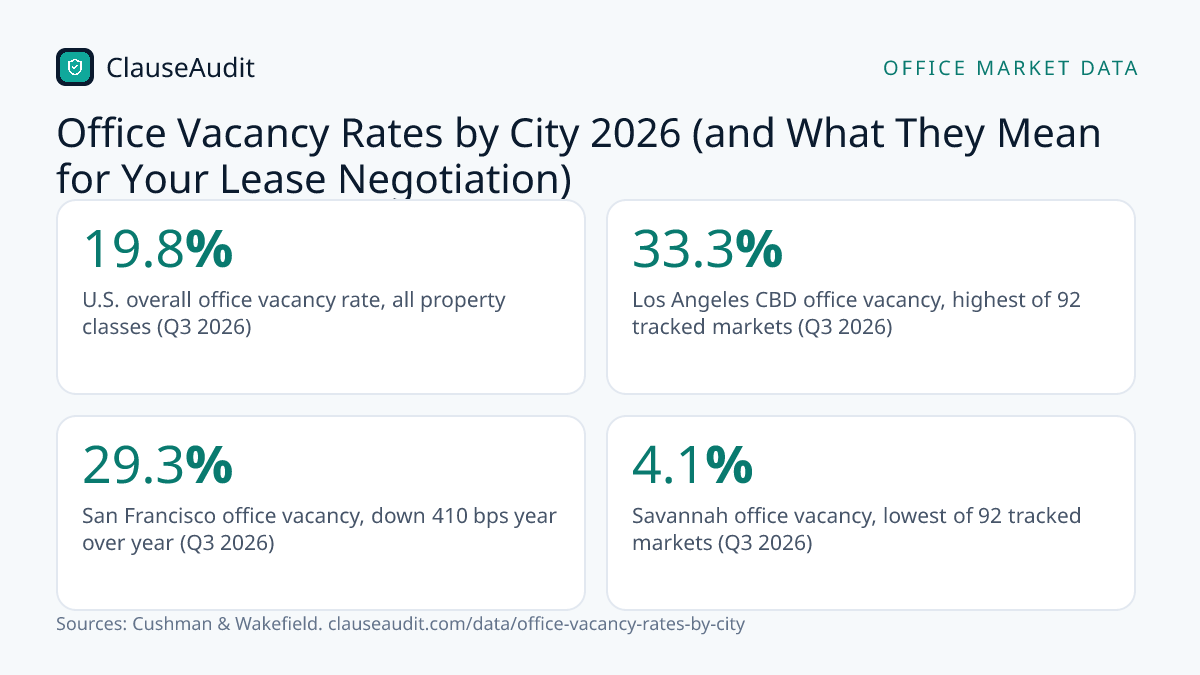
The U.S. office vacancy rate was 19.8% in Q3 2026, but cities vary widely. Los Angeles CBD had the highest rate of 92 tracked markets at 33.3%, while Savannah had the lowest at 4.1%. If your city sits well above the national rate, you have real room to push for lower rent, free months and easier exits.
- U.S. overall office vacancy rate, all property classes (Q3 2026, Cushman & Wakefield)
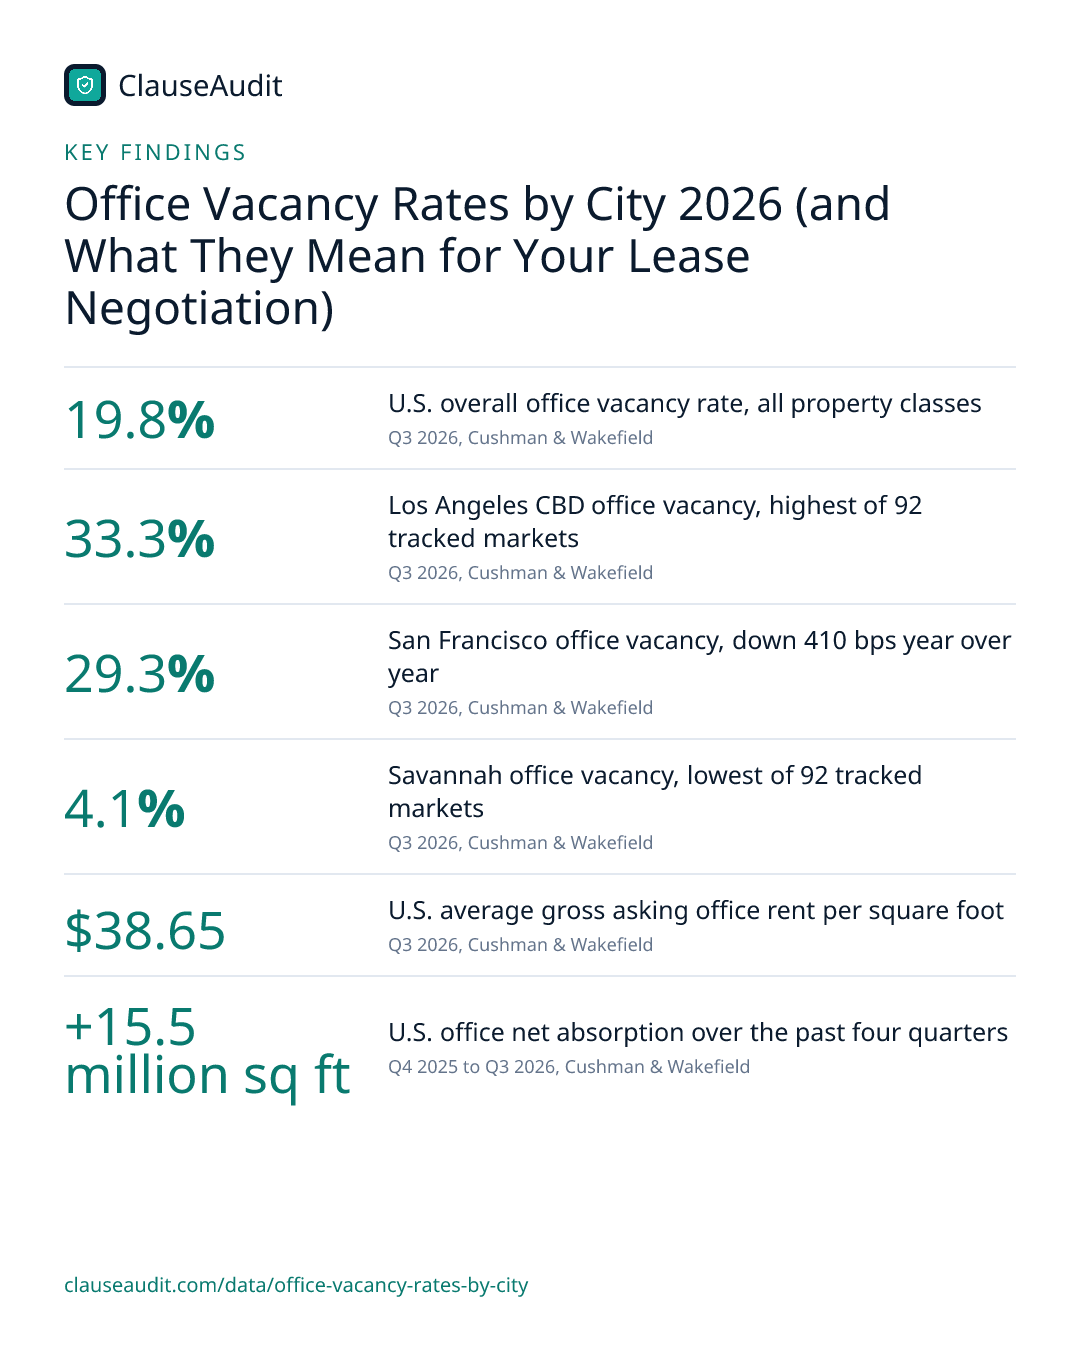
- 19.8%
- Los Angeles CBD office vacancy, highest of 92 tracked markets (Q3 2026, Cushman & Wakefield)
- 33.3%
- San Francisco office vacancy, down 410 bps year over year (Q3 2026, Cushman & Wakefield)
- 29.3%
- Savannah office vacancy, lowest of 92 tracked markets (Q3 2026, Cushman & Wakefield)
- 4.1%
- U.S. average gross asking office rent per square foot (Q3 2026, Cushman & Wakefield)
- $38.65
- U.S. office net absorption over the past four quarters (Q4 2025 to Q3 2026, Cushman & Wakefield)
- +15.5 million sq ft
- Year-over-year change in U.S. Class A office vacancy (Q3 2026, Cushman & Wakefield)
- -60 bps
- New office space delivered in first three quarters of 2026 (Q1 to Q3 2026, Cushman & Wakefield)
- 7.1 million sq ft
In some American downtowns, whole floors of office space sit dark. In others, you would struggle to find a decent suite at all. The national office vacancy rate was 19.8% in Q3 2026, and that single number hides a spread from 33.3% in the Los Angeles CBD to 4.1% in Savannah.
That spread matters if you are about to sign, renew or sublease office space. Vacancy is the clearest public signal of who has the upper hand in a lease talk. Below you will find what the rates mean, which cities are tightening, and the exact clauses worth pushing on in each kind of market.
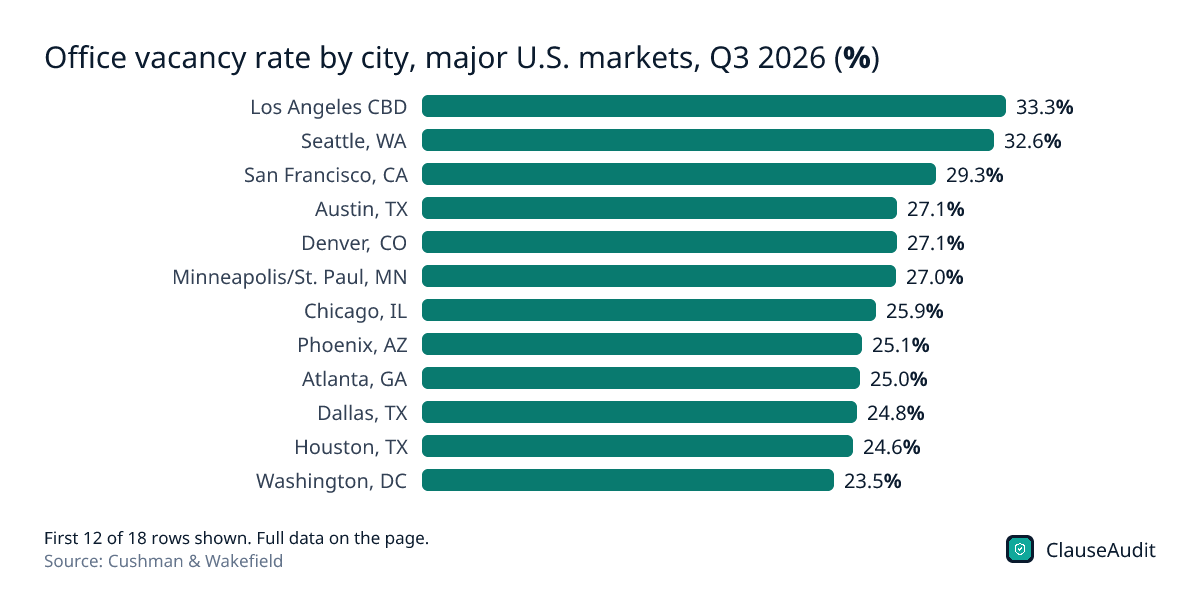
Office vacancy rate by city, major U.S. markets, Q3 2026 (%)
Chart data
| Label | Value |
|---|---|
| Los Angeles CBD | 33.3% |
| Seattle, WA | 32.6% |
| San Francisco, CA | 29.3% |
| Austin, TX | 27.1% |
| Denver, CO | 27.1% |
| Minneapolis/St. Paul, MN | 27.0% |
| Chicago, IL | 25.9% |
| Phoenix, AZ | 25.1% |
| Atlanta, GA | 25.0% |
| Dallas, TX | 24.8% |
| Houston, TX | 24.6% |
| Washington, DC | 23.5% |
| Philadelphia, PA | 19.7% |
| Boston, MA | 19.0% |
| New York - Midtown | 17.0% |
| Nashville, TN | 16.7% |
| Miami, FL | 13.9% |
| U.S. average | 19.8% |
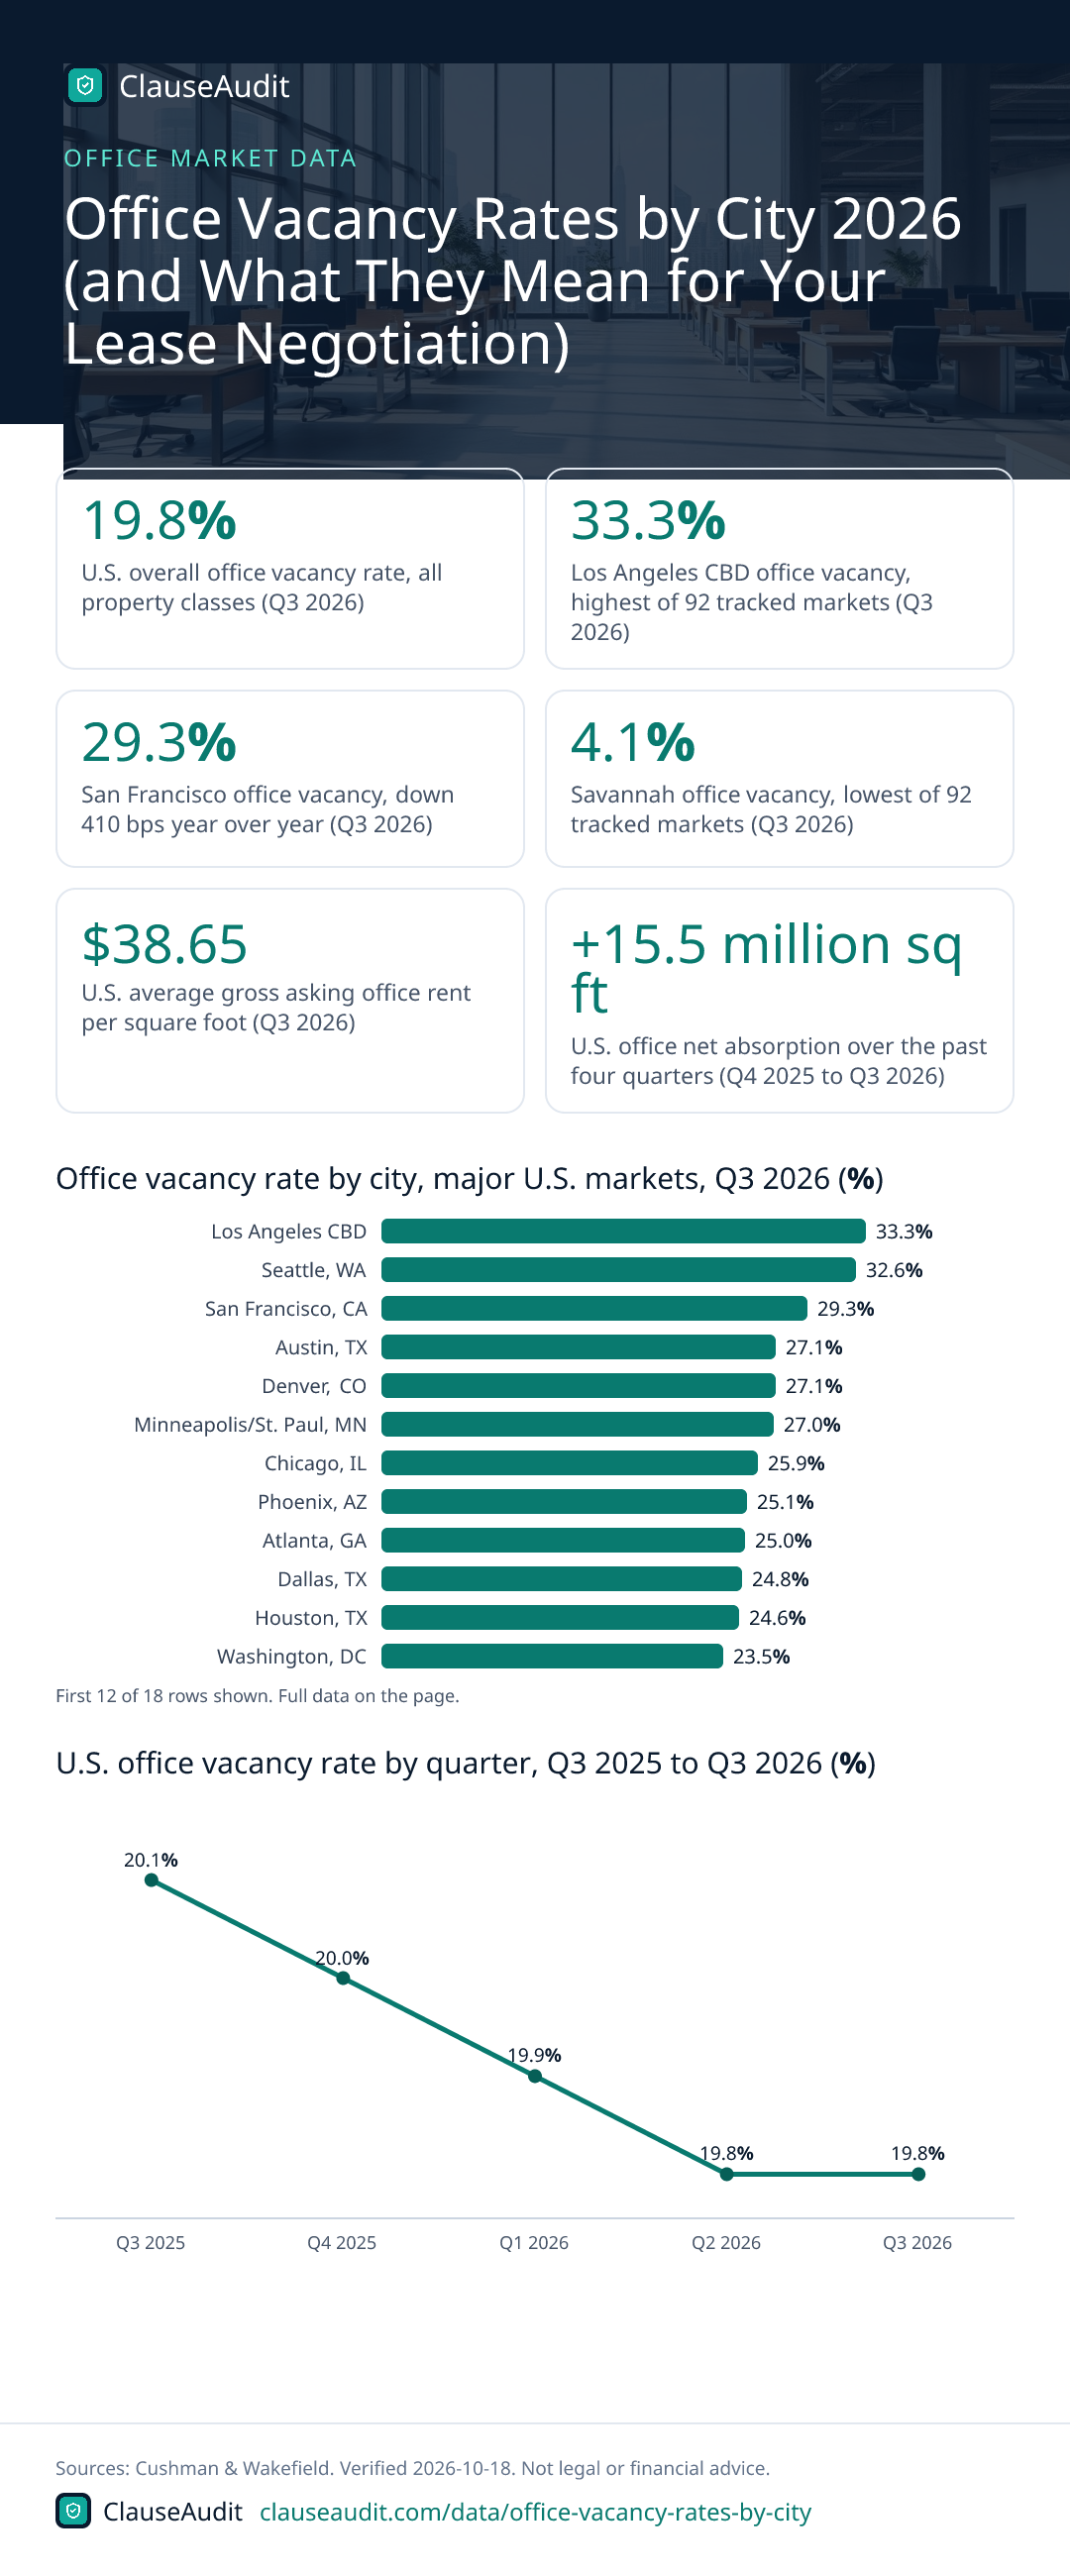
Every market with a rate above the 19.8% U.S. average is a place where landlords are competing for tenants. Seattle at 32.6% and San Francisco at 29.3% sit far above that line, while Miami at 13.9% is a landlord's market.
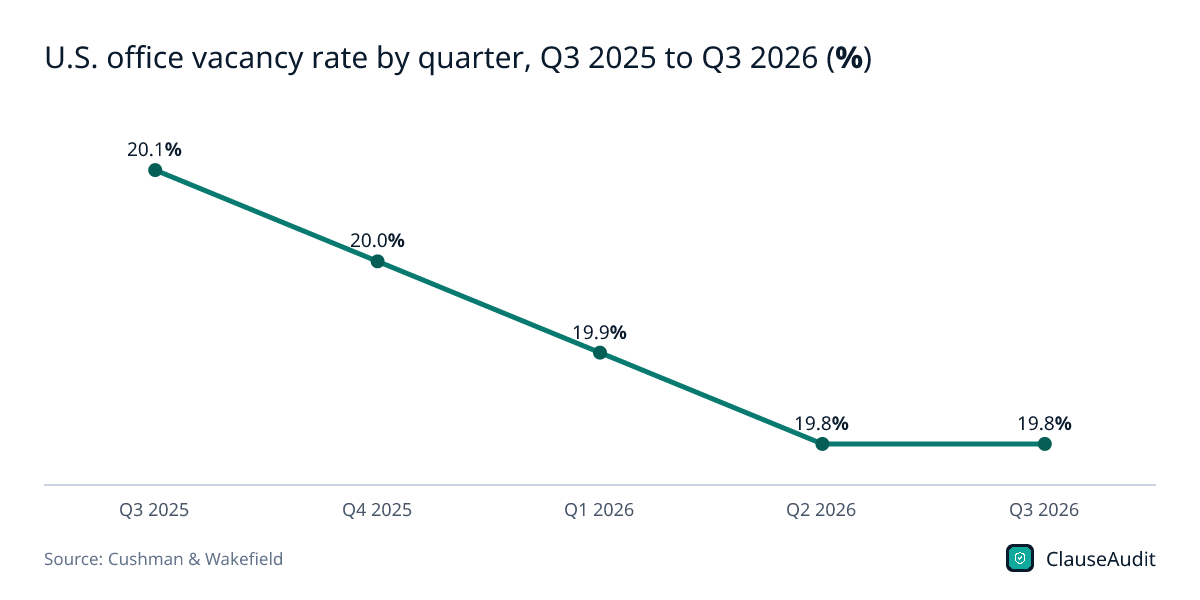
Download this chart (PNG)U.S. office vacancy rate by quarter, Q3 2025 to Q3 2026 (%)
Chart data
| Label | Value (%) |
|---|---|
| Q3 2025 | 20.1% |
| Q4 2025 | 20.0% |
| Q1 2026 | 19.9% |
| Q2 2026 | 19.8% |
| Q3 2026 | 19.8% |
The national rate has barely moved, slipping from 20.1% in Q3 2025 to 19.8% in Q3 2026. That is a slow thaw, not a rebound, so tenant bargaining power is still intact in most cities.
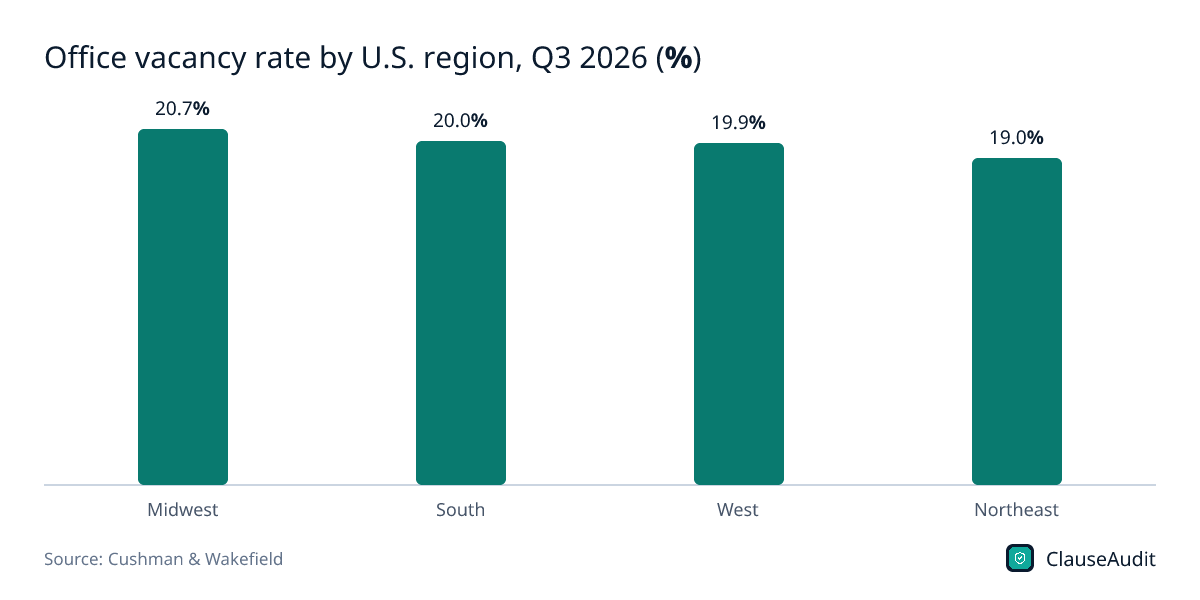
Download this chart (PNG)Office vacancy rate by U.S. region, Q3 2026 (%)
Chart data
| Label | Value (%) |
|---|---|
| Midwest | 20.7% |
| South | 20.0% |
| West | 19.9% |
| Northeast | 19.0% |
The regions sit within a narrow band, from 19.0% in the Northeast to 20.7% in the Midwest. City and submarket matter far more than region when you size up your position.
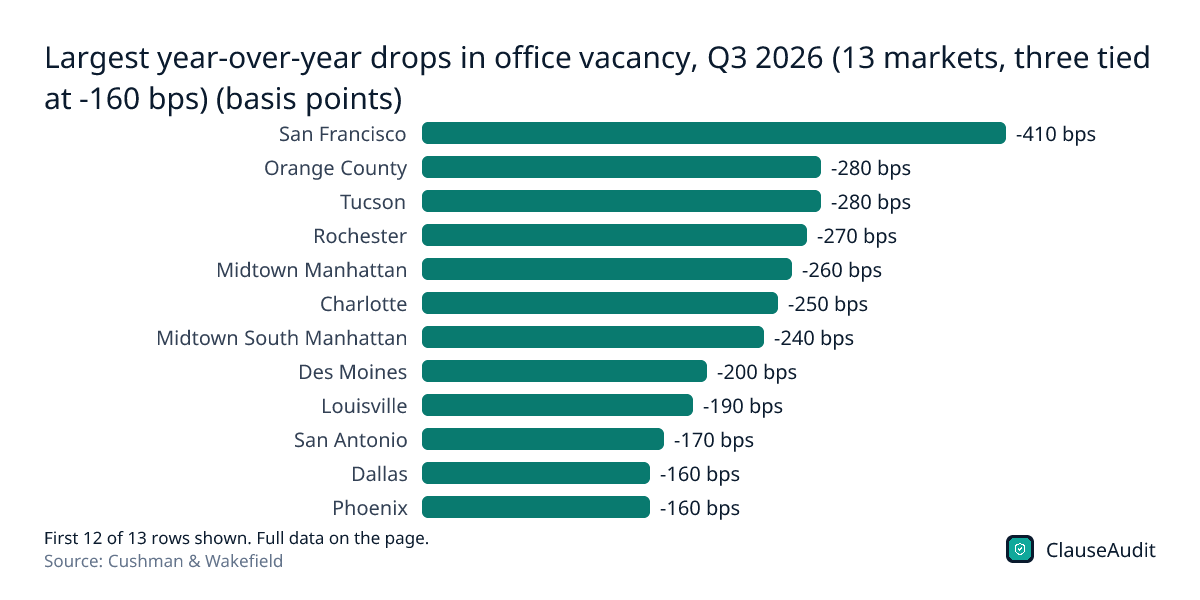
Download this chart (PNG)Largest year-over-year drops in office vacancy, Q3 2026 (13 markets, three tied at -160 bps) (basis points)
Chart data
| Label | Value |
|---|---|
| San Francisco | -410 bps |
| Orange County | -280 bps |
| Tucson | -280 bps |
| Rochester | -270 bps |
| Midtown Manhattan | -260 bps |
| Charlotte | -250 bps |
| Midtown South Manhattan | -240 bps |
| Des Moines | -200 bps |
| Louisville | -190 bps |
| San Antonio | -170 bps |
| Dallas | -160 bps |
| Phoenix | -160 bps |
| Syracuse | -160 bps |
These are the markets where empty space is being filled fastest. San Francisco fell 410 bps, yet at 29.3% it still has more vacancy than almost any other city, so a falling rate does not always mean a tight market.
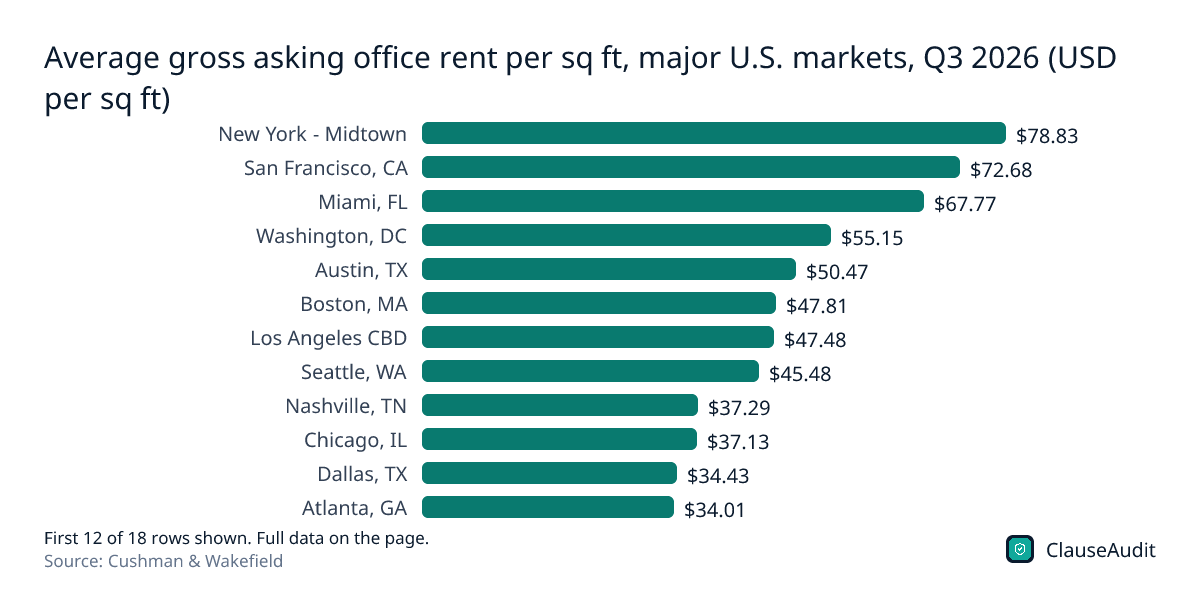
Download this chart (PNG)Average gross asking office rent per sq ft, major U.S. markets, Q3 2026 (USD per sq ft)
Chart data
| Label | Value |
|---|---|
| New York - Midtown | $78.83 |
| San Francisco, CA | $72.68 |
| Miami, FL | $67.77 |
| Washington, DC | $55.15 |
| Austin, TX | $50.47 |
| Boston, MA | $47.81 |
| Los Angeles CBD | $47.48 |
| Seattle, WA | $45.48 |
| Nashville, TN | $37.29 |
| Chicago, IL | $37.13 |
| Dallas, TX | $34.43 |
| Atlanta, GA | $34.01 |
| Denver, CO | $33.80 |
| Houston, TX | $32.08 |
| Phoenix, AZ | $30.68 |
| Minneapolis/St. Paul, MN | $30.33 |
| Philadelphia, PA | $29.06 |
| U.S. average | $38.65 |
Asking rent and vacancy do not always move together. Miami asks $67.77 per square foot with only 13.9% vacancy, while Los Angeles CBD asks $47.48 with the highest vacancy of the 92 tracked markets, so expect deeper discounts off the asking number there.
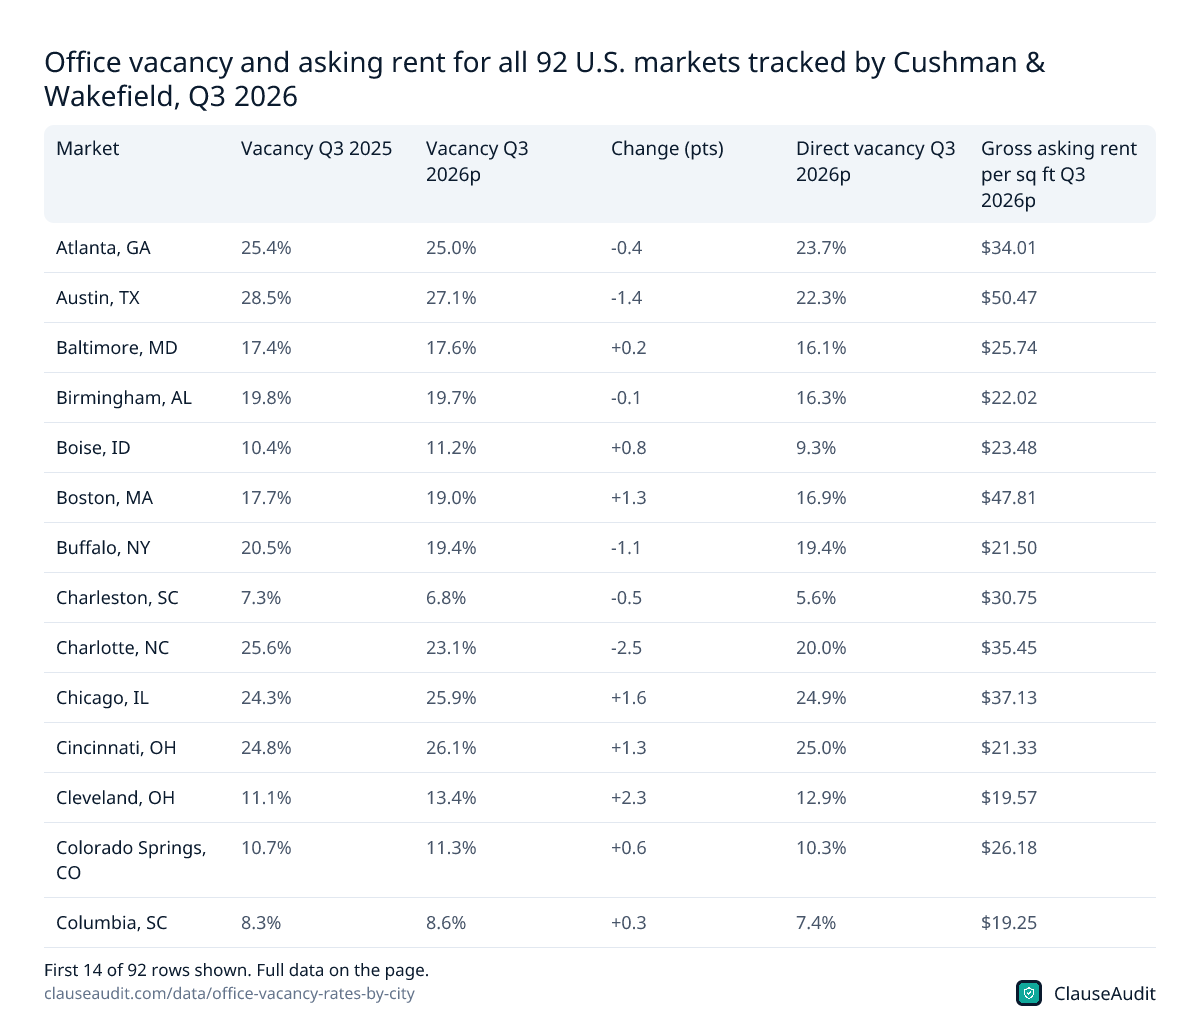
Download this chart (PNG)Office vacancy and asking rent for all 92 U.S. markets tracked by Cushman & Wakefield, Q3 2026
| Market | Vacancy Q3 2025 | Vacancy Q3 2026p | Change (pts) | Direct vacancy Q3 2026p | Gross asking rent per sq ft Q3 2026p |
|---|---|---|---|---|---|
| Atlanta, GA | 25.4% | 25.0% | -0.4 | 23.7% | $34.01 |
| Austin, TX | 28.5% | 27.1% | -1.4 | 22.3% | $50.47 |
| Baltimore, MD | 17.4% | 17.6% | +0.2 | 16.1% | $25.74 |
| Birmingham, AL | 19.8% | 19.7% | -0.1 | 16.3% | $22.02 |
| Boise, ID | 10.4% | 11.2% | +0.8 | 9.3% | $23.48 |
| Boston, MA | 17.7% | 19.0% | +1.3 | 16.9% | $47.81 |
| Buffalo, NY | 20.5% | 19.4% | -1.1 | 19.4% | $21.50 |
| Charleston, SC | 7.3% | 6.8% | -0.5 | 5.6% | $30.75 |
| Charlotte, NC | 25.6% | 23.1% | -2.5 | 20.0% | $35.45 |
| Chicago, IL | 24.3% | 25.9% | +1.6 | 24.9% | $37.13 |
| Cincinnati, OH | 24.8% | 26.1% | +1.3 | 25.0% | $21.33 |
| Cleveland, OH | 11.1% | 13.4% | +2.3 | 12.9% | $19.57 |
| Colorado Springs, CO | 10.7% | 11.3% | +0.6 | 10.3% | $26.18 |
| Columbia, SC | 8.3% | 8.6% | +0.3 | 7.4% | $19.25 |
| Columbus, OH | 22.2% | 22.5% | +0.3 | 19.4% | $22.46 |
| Dallas, TX | 26.4% | 24.8% | -1.6 | 23.7% | $34.43 |
| Denver, CO | 26.5% | 27.1% | +0.6 | 25.4% | $33.80 |
| Des Moines, IA | 16.8% | 14.8% | -2.0 | 14.0% | $21.36 |
| Detroit, MI | 18.4% | 18.5% | +0.1 | 17.6% | $20.45 |
| El Paso, TX | 5.8% | 7.0% | +1.2 | 7.0% | $24.00 |
| Fairfield County, CT | 26.7% | 25.8% | -0.9 | 23.6% | $35.39 |
| Fort Lauderdale, FL | 16.2% | 16.5% | +0.3 | 15.7% | $45.58 |
| Fort Worth, TX | 11.5% | 10.8% | -0.7 | 10.6% | $25.86 |
| Fredericksburg, VA | 6.9% | 7.7% | +0.8 | 7.5% | $25.66 |
| Grand Rapids, MI | 7.7% | 7.4% | -0.3 | 6.7% | $23.05 |
| Greensboro/Winston-Salem, NC | 12.2% | 12.7% | +0.5 | 12.0% | $20.01 |
| Greenville, SC | 9.7% | 8.7% | -1.0 | 8.0% | $26.08 |
| Hampton Roads, VA | 11.1% | 11.1% | 0.0 | 10.7% | $23.43 |
| Hartford, CT | 18.6% | 18.1% | -0.5 | 17.7% | $21.79 |
| Houston, TX | 23.9% | 24.6% | +0.7 | 23.4% | $32.08 |
| Indianapolis, IN | 20.5% | 19.3% | -1.2 | 18.4% | $21.92 |
| Inland Empire CA | 7.8% | 8.6% | +0.8 | 8.3% | $27.91 |
| Jacksonville, FL | 21.5% | 20.6% | -0.9 | 18.9% | $22.73 |
| Kansas City, MO | 20.0% | 19.0% | -1.0 | 18.0% | $23.43 |
| Las Vegas, NV | 13.0% | 12.1% | -0.9 | 11.6% | $28.66 |
| Long Island, NY | 13.0% | 11.6% | -1.4 | 9.7% | $33.62 |
| Los Angeles CBD | 30.1% | 33.3% | +3.2 | 32.0% | $47.48 |
| Los Angeles Non-CBD | 21.3% | 21.8% | +0.5 | 19.7% | $43.50 |
| Louisville, KY | 19.0% | 17.1% | -1.9 | 17.0% | $19.13 |
| Madison, WI | 7.9% | 9.1% | +1.2 | 9.1% | $22.87 |
| Memphis, TN | 18.4% | 20.1% | +1.7 | 18.5% | $20.49 |
| Miami, FL | 14.9% | 13.9% | -1.0 | 13.7% | $67.77 |
| Milwaukee, WI | 24.2% | 23.2% | -1.0 | 23.2% | $23.20 |
| Minneapolis/St. Paul, MN | 27.8% | 27.0% | -0.8 | 25.7% | $30.33 |
| Nashville, TN | 16.9% | 16.7% | -0.2 | 15.2% | $37.29 |
| New Haven, CT | 17.2% | 16.1% | -1.1 | 15.9% | $23.63 |
| New Jersey - Central | 21.9% | 22.0% | +0.1 | 20.0% | $28.55 |
| New Jersey - Northern | 21.8% | 21.4% | -0.4 | 18.1% | $34.38 |
| New Orleans, LA | 9.4% | 9.7% | +0.3 | 9.0% | $20.61 |
| New York - Brooklyn | 21.4% | 21.2% | -0.2 | 19.4% | $51.29 |
| New York - Downtown | 21.0% | 21.0% | 0.0 | 17.6% | $58.09 |
| New York - Midtown | 19.6% | 17.0% | -2.6 | 14.4% | $78.83 |
| New York - Midtown South | 23.9% | 21.5% | -2.4 | 19.6% | $82.14 |
| Northern VA | 23.0% | 23.6% | +0.6 | 22.9% | $36.45 |
| Oakland/East Bay, CA* | 21.8% | 22.0% | +0.2 | 18.4% | $38.77 |
| Oklahoma City, OK | 26.9% | 28.1% | +1.2 | 27.6% | $22.06 |
| Omaha, NE | 11.6% | 12.3% | +0.7 | 11.7% | $26.68 |
| Orange County, CA | 17.0% | 14.2% | -2.8 | 13.1% | $35.20 |
| Orlando, FL | 16.9% | 16.7% | -0.2 | 14.9% | $26.74 |
| Palm Beach, FL | 12.5% | 11.6% | -0.9 | 10.9% | $58.05 |
| Philadelphia, PA | 18.8% | 19.7% | +0.9 | 17.6% | $29.06 |
| Phoenix, AZ | 26.7% | 25.1% | -1.6 | 21.9% | $30.68 |
| Pittsburgh, PA | 16.9% | 17.1% | +0.2 | 16.1% | $25.90 |
| Portland, OR | 22.8% | 23.9% | +1.1 | 22.2% | $32.53 |
| Providence, RI | 12.8% | 13.3% | +0.5 | 12.5% | $22.85 |
| Puget Sound - Eastside | 21.7% | 22.4% | +0.7 | 19.3% | $49.26 |
| Raleigh/Durham, NC | 21.6% | 21.5% | -0.1 | 17.4% | $31.60 |
| Reno, NV | 8.5% | 7.6% | -0.9 | 7.4% | $25.64 |
| Richmond, VA | 12.1% | 12.5% | +0.4 | 11.5% | $23.45 |
| Roanoke, VA | 4.9% | 6.7% | +1.8 | 6.6% | $19.68 |
| Rochester, NY | 21.4% | 18.7% | -2.7 | 43.2% | $17.50 |
| Sacramento, CA | 14.3% | 13.6% | -0.7 | 13.2% | $25.82 |
| Salt Lake City, UT | 23.4% | 21.9% | -1.5 | 18.4% | $26.64 |
| San Antonio, TX | 16.9% | 15.2% | -1.7 | 14.4% | $28.67 |
| San Diego, CA | 14.5% | 14.7% | +0.2 | 13.6% | $42.06 |
| San Francisco North Bay, CA | 11.6% | 12.7% | +1.1 | 12.0% | $35.43 |
| San Francisco, CA | 33.4% | 29.3% | -4.1 | 25.9% | $72.68 |
| San Jose, CA* | 15.1% | 14.1% | -1.0 | 12.2% | $51.03 |
| San Juan, PR | 13.2% | 12.4% | -0.8 | 12.4% | $21.04 |
| San Mateo County, CA* | 22.1% | 20.6% | -1.5 | 16.5% | $70.41 |
| Savannah, GA | 3.7% | 4.1% | +0.4 | 4.1% | $35.54 |
| Seattle, WA | 31.3% | 32.6% | +1.3 | 29.8% | $45.48 |
| Southern NH | 9.8% | 10.8% | +1.0 | 10.3% | $24.56 |
| St. Louis, MO | 18.3% | 18.8% | +0.5 | 18.3% | $21.54 |
| St. Petersburg/Clearwater, FL | 16.9% | 16.6% | -0.3 | 14.1% | $28.96 |
| Suburban MD | 22.5% | 22.3% | -0.2 | 21.9% | $31.86 |
| Syracuse, NY | 13.2% | 11.6% | -1.6 | 11.5% | $19.08 |
| Tampa, FL | 19.7% | 18.5% | -1.2 | 16.1% | $33.77 |
| Tucson, AZ | 10.2% | 7.4% | -2.8 | 6.9% | $21.84 |
| Tulsa, OK | 10.1% | 10.5% | +0.4 | 10.3% | $19.51 |
| Washington, DC | 22.1% | 23.5% | +1.4 | 22.5% | $55.15 |
| Westchester County, NY | 24.6% | 24.0% | -0.6 | 22.8% | $30.63 |
Source: Cushman & Wakefield, U.S. Office MarketBeat Q3 2026. Download as image
What is the office vacancy rate by city in 2026?
The overall U.S. rate was 19.8% in Q3 2026, but the city numbers tell the real story. The highest rates are in big metros: Los Angeles CBD at 33.3%, Seattle at 32.6%, San Francisco at 29.3%, Oklahoma City at 28.1%, and Austin and Denver both at 27.1%. Chicago sat at 25.9% and Dallas at 24.8%.
At the other end are smaller markets where offices are hard to come by. Savannah was the tightest of the 92 markets at 4.1%. Roanoke was at 6.7%, Charleston at 6.8%, and Tucson and Grand Rapids at 7.4%.
Then there is the middle of the pack, where most negotiating happens. Philadelphia at 19.7% and Boston at 19.0% sit right around the national figure, though Boston climbed from 17.7% a year earlier. Midtown Manhattan was at 17.0% and Nashville at 16.7%. In these cities, your result depends heavily on the building, its age and how long the space has been listed.
Two quick notes on reading the table. Overall vacancy counts both direct space from landlords and sublease space from tenants trying to unload it. And the Q3 2026 figures are preliminary, so expect small revisions.
Is office vacancy going down?
Yes, but slowly. The national rate eased from 20.1% in Q3 2025 to 19.8% in Q3 2026. Tenants took up a net 15.5 million sq ft over the past four quarters, while only 7.1 million sq ft of new space was delivered in the first three quarters of 2026. Less new supply plus steady demand is what pulls vacancy down.
The recovery is uneven. Class A vacancy fell 60 bps over the year, which suggests the best buildings are filling first while lower-quality space is slower to lease. Some cities moved the wrong way, too. Chicago rose from 24.3% to 25.9%, and Seattle climbed from 31.3% to 32.6%.
For you, the takeaway is simple. If you want a trophy building in a city where Class A is tightening, your discount window is narrowing. If an older building will do, landlords are still motivated.
What does a high vacancy rate mean for your lease negotiation?
High vacancy means the landlord needs you more than you need that particular suite. Every month a floor sits empty, they pay taxes, insurance and upkeep with no rent coming in. That gives you room to ask for things a landlord in a tight market would refuse.
Asking rent is only the opening number. U.S. gross asking rent averaged $38.65 per square foot, with growth of only 0.5% over the year. In a high vacancy city, what you actually pay can land well below the listed figure once free months and build-out money are counted.
Say you run a small design firm looking at space in Denver, where vacancy is 27.1%. You can reasonably ask for several months of free rent, a generous improvement allowance, a smaller annual escalation and a right to end the lease early. A tenant in Charleston, at 6.8%, would be lucky to get one of those.
How do you use vacancy data when you negotiate an office lease?
- Start with your city's rate from the table, then ask the broker for the vacancy in your specific building and submarket. A half-empty tower in a tight city still gives you room.
- Check sublease listings nearby. Sublease space is often cheaper and comes furnished, and it gives you a real alternative to point to.
- Put concessions in the lease itself, not in an email or a broker's flyer. Free rent, improvement money and caps should all be written terms.
- Ask for flexibility instead of only a lower rate: an early termination right, a contraction option, or the right to sublet without unreasonable refusal.
- Start renewal talks well before your notice deadline. Miss that date and your renewal option can lapse, which leaves you with little room to bargain.
- Compare your offer against national benchmarks for free rent and improvement allowances so you know when a deal is merely average.
What if your city has low office vacancy?
In a tight market like Savannah, Tucson or Charleston, the landlord holds most of the cards. You will see fewer giveaways, and asking rent is closer to what you will actually pay.
Your focus shifts from discounts to protection. Lock in a renewal option with a capped rent increase so you are not priced out at the end of your term. Ask for a right of first refusal on neighboring space if you expect to grow. Read the operating expense clause closely, because in a hot market landlords often pass through more costs rather than lowering rent.
Watch the trend, too. Tucson dropped 280 bps in a year to 7.4%. Markets that tighten quickly tend to see the strongest rent pressure at renewal.
What should freelancers and small teams take from these numbers?
If you only need a few desks, high vacancy cities are good news. Companies with too much space are trying to sublease it, sometimes at steep discounts and with furniture included. In places like Los Angeles, Seattle or San Francisco, it pays to look past coworking memberships.
Subleases carry their own risks, though. Your rights depend on the original lease between the landlord and the tenant you are renting from. If that tenant defaults, you can lose the space. Ask to see the master lease, confirm the landlord has consented in writing, and avoid signing a personal guarantee for longer than your sublease runs.
How ClauseAudit helps
A good vacancy market only helps you if the concessions make it into the lease. Our automated review reads your office lease clause by clause and flags the terms that quietly take back what you negotiated.
Upload the PDF or paste the text and you get a plain-English report with a risk score and suggested wording to ask for before you sign.
- Rent escalation clauses, including fixed bumps and increases tied to market rent
- Free rent and improvement allowance terms, and any conditions that let the landlord claw them back
- Renewal options and the notice deadlines you must hit to use them
- Operating expense and CAM pass-throughs, including caps and audit rights
- Assignment and sublease clauses, including recapture rights and consent standards
- Personal guarantees, early termination rights and holdover penalties
Frequently asked questions
What is the current U.S. office vacancy rate?
The overall U.S. office vacancy rate was 19.8% in Q3 2026, across all property classes. That is down from 20.1% in Q3 2025. The figure includes both direct vacancy and sublease space, and the Q3 2026 numbers are preliminary, so they may shift slightly when the publisher revises them.
Which city has the highest office vacancy rate?
Los Angeles CBD had the highest office vacancy of the 92 markets tracked, at 33.3% in Q3 2026. Seattle was close behind at 32.6%, followed by San Francisco at 29.3% and Oklahoma City at 28.1%. Each of these is well above the national rate of 19.8%.
Which city has the lowest office vacancy rate?
Savannah had the lowest office vacancy of the 92 tracked markets, at 4.1% in Q3 2026. Other tight markets included Roanoke at 6.7%, Charleston at 6.8%, and Tucson and Grand Rapids, both at 7.4%. In cities like these, expect fewer concessions and less room to negotiate rent down.
What is San Francisco's office vacancy rate in 2026?
San Francisco's office vacancy rate was 29.3% in Q3 2026, down from 33.4% a year earlier. That 410 bps drop was the largest of the 92 tracked markets. Even so, San Francisco still has one of the highest rates in the country, so tenants there keep strong bargaining power.
What is a good office vacancy rate for tenants?
There is no official cutoff, but the higher the rate, the better your position. When your city sits well above the national rate of 19.8%, landlords usually offer free rent, larger build-out budgets and more flexible terms. Well below it, plan to pay closer to asking rent and focus on renewal protection.
Does high vacancy mean office rents are falling?
Not always. U.S. gross asking rent averaged $38.65 per square foot in Q3 2026, with growth of 0.5% over the year. Landlords often hold the asking rate steady and give discounts through free months and improvement allowances instead. Your real savings show up in the effective rent, not the listing.
How can I use vacancy rates to negotiate my office lease?
Bring your city and building vacancy to the table and ask for specific concessions: free rent, a larger improvement allowance, a lower annual escalation and an early exit right. Get every concession written into the lease. A promise in an email or a marketing flyer is hard to enforce later.
Is subleasing office space a good idea in a high vacancy city?
It can be. Tenants with extra space often sublease at a discount and include furniture. The catch is that your rights depend on the master lease. Ask for a copy, confirm the landlord has approved the sublease in writing, and make sure your term ends before or with the original tenant's lease.
Use this data
Every chart and card below is free to reuse under CC BY 4.0. Download what you need and link back to this page.
 Stat cards
 Key findings card
 Infographic
 Office vacancy rate by city, major U.S. markets, Q3 2026 (%)
 U.S. office vacancy rate by quarter, Q3 2025 to Q3 2026 (%)
 Office vacancy rate by U.S. region, Q3 2026 (%)
 Largest year-over-year drops in office vacancy, Q3 2026 (13 markets, three tied at -160 bps) (basis points)
 Average gross asking office rent per sq ft, major U.S. markets, Q3 2026 (USD per sq ft)
 Office vacancy and asking rent for all 92 U.S. markets tracked by Cushman & Wakefield, Q3 2026
Embed the infographic
Free to share on your site, blog or slides under CC BY 4.0. Please keep the credit link.
Sources and method
Every number on this page comes from the sources below, each opened and read on or before October 18, 2026. A second, independent review checked every figure against its source and corrected anything that did not match. Figures that could not be confirmed were left out.
- Cushman & Wakefield, U.S. Office MarketBeat Q3 2026 (Q3 2026 edition (October 14, 2026))
Cite this page
ClauseAudit, “Office Vacancy Rates by City 2026 (and What They Mean for Your Lease Negotiation)”, updated October 18, 2026, https://clauseaudit.com/data/office-vacancy-rates-by-city. Free to reuse with a link back (CC BY 4.0).
This page summarises published data and law as checked on October 18, 2026. Figures are updated as new editions are released, and your own situation may differ. It is general information, not legal, tax or financial advice.