Average CAM Charges per Square Foot: Commercial Operating Expense Benchmarks
By ClauseAudit Research · 3 sources ·
What are average CAM charges per square foot?
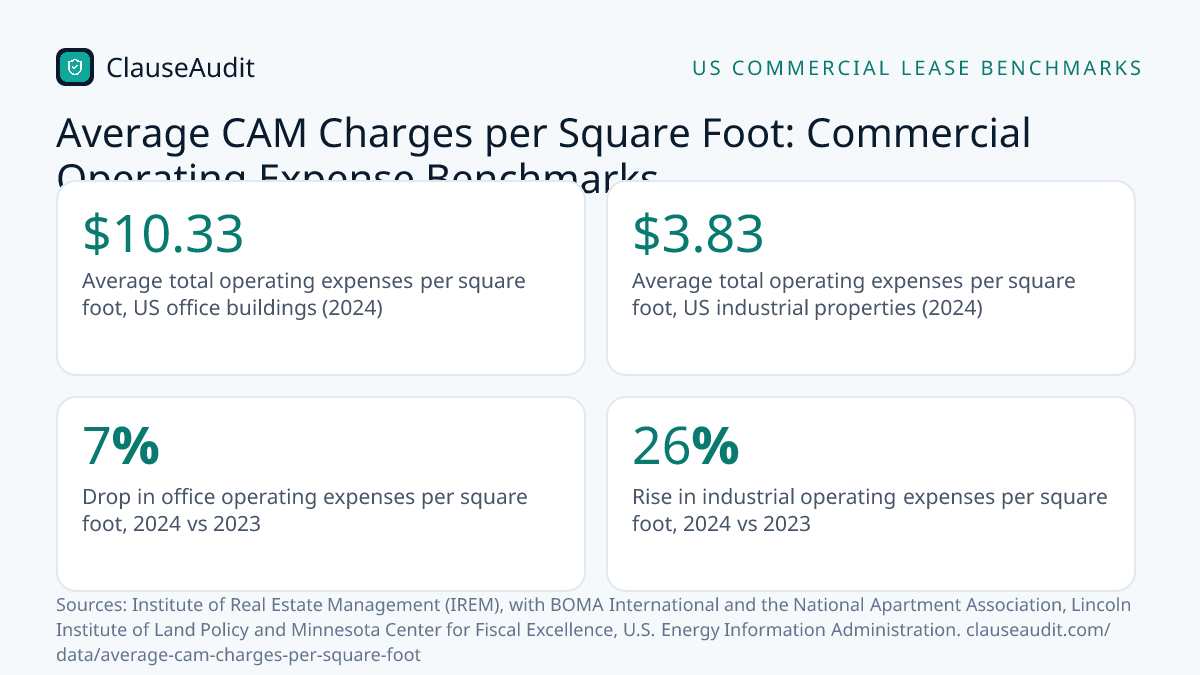
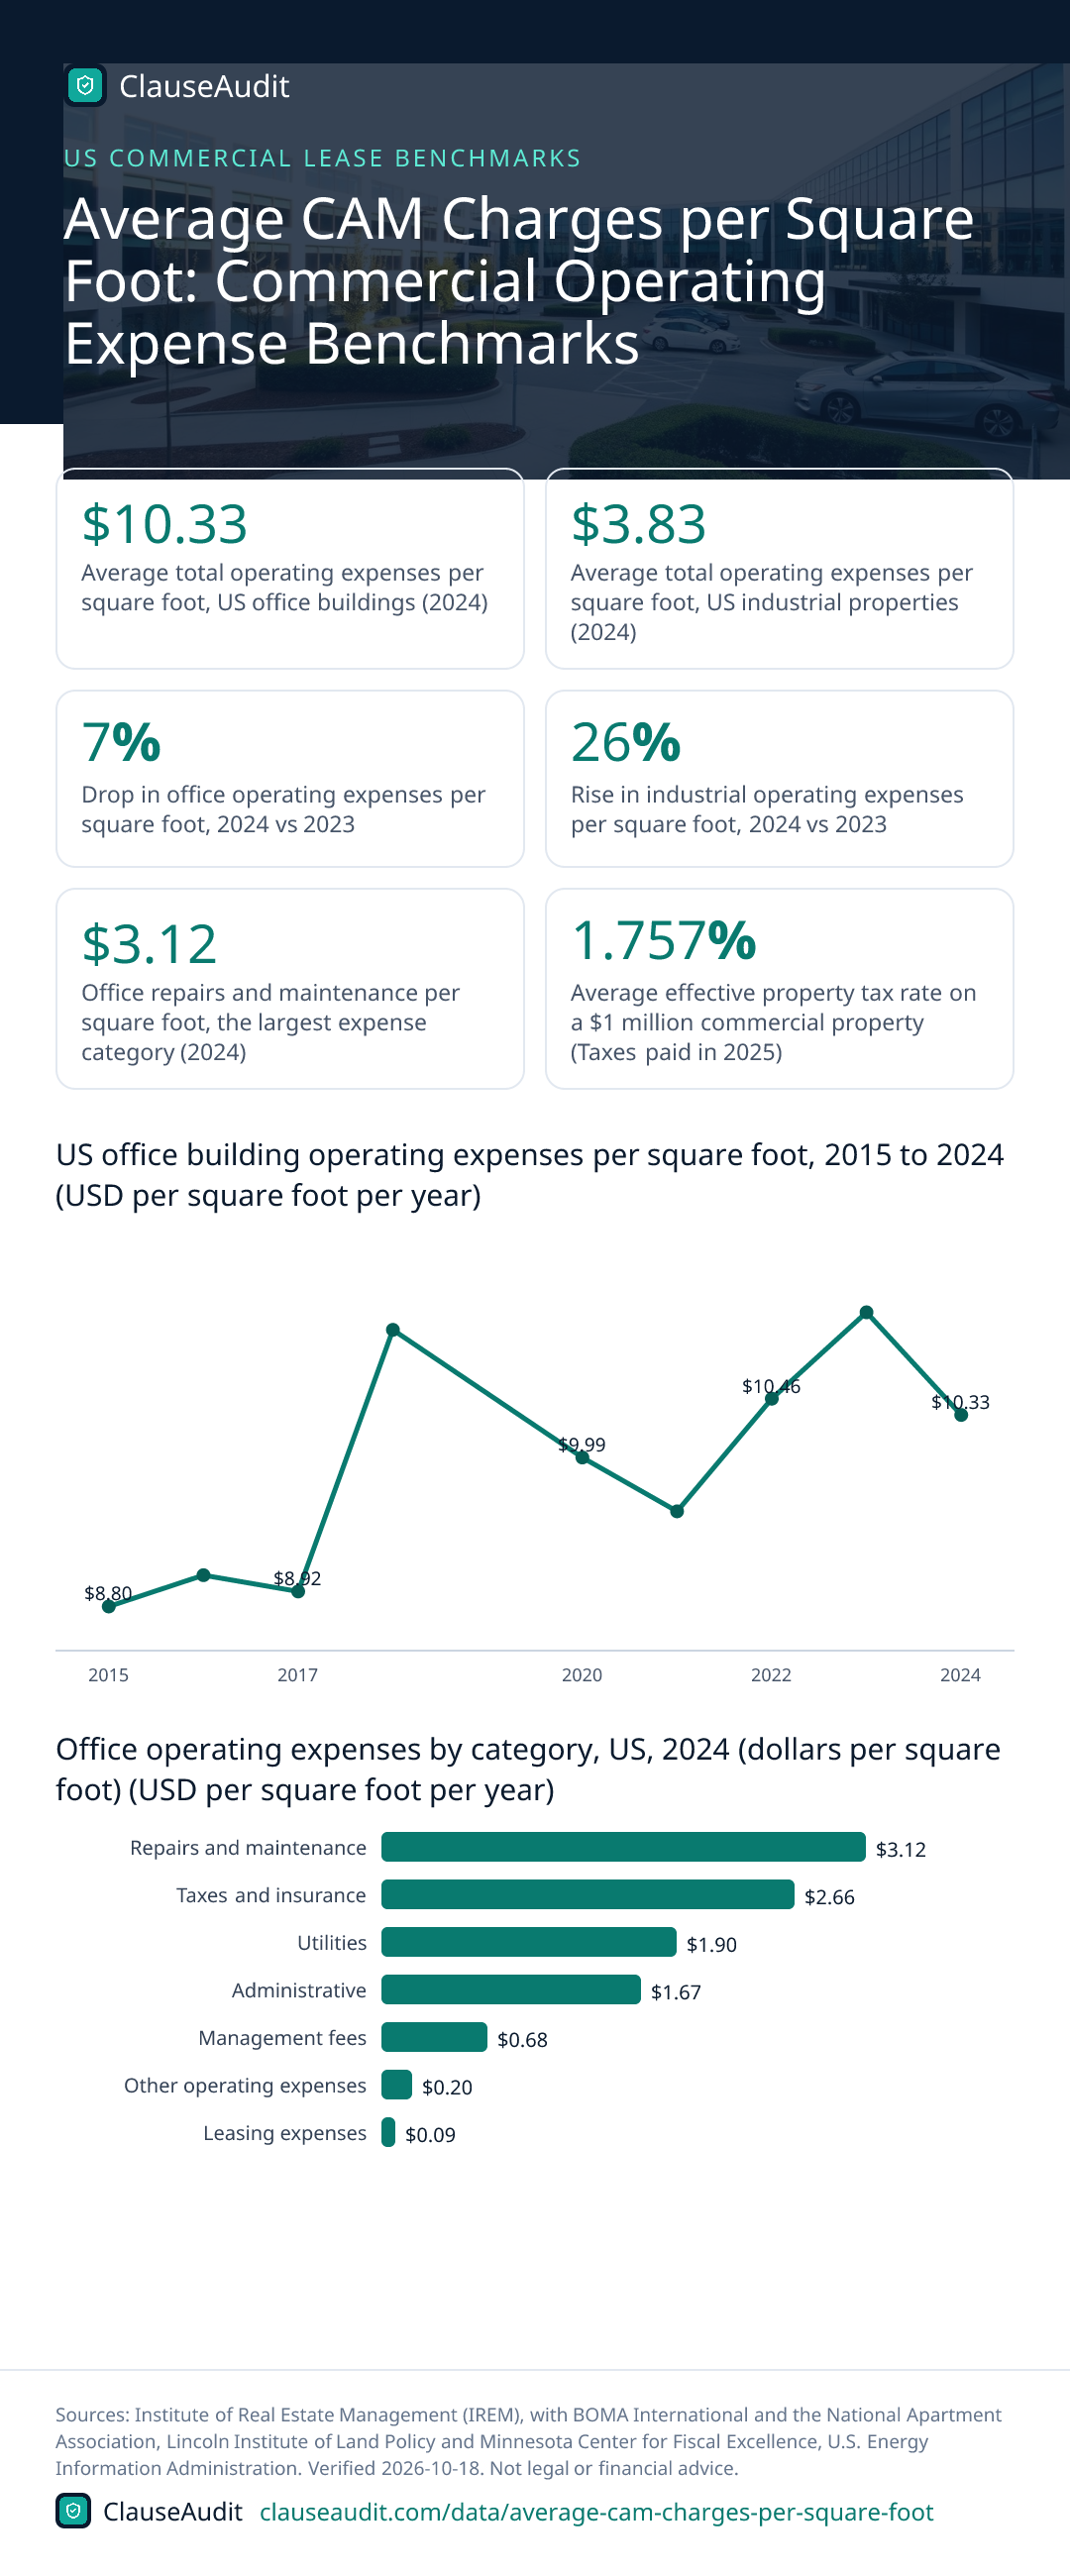
There is no single national CAM rate, but the best benchmark is the expense pool CAM comes from: $10.33 per square foot a year for US office buildings and $3.83 for industrial properties in 2024. What you actually pay depends on your share of the building and which costs your lease lets the landlord pass through.
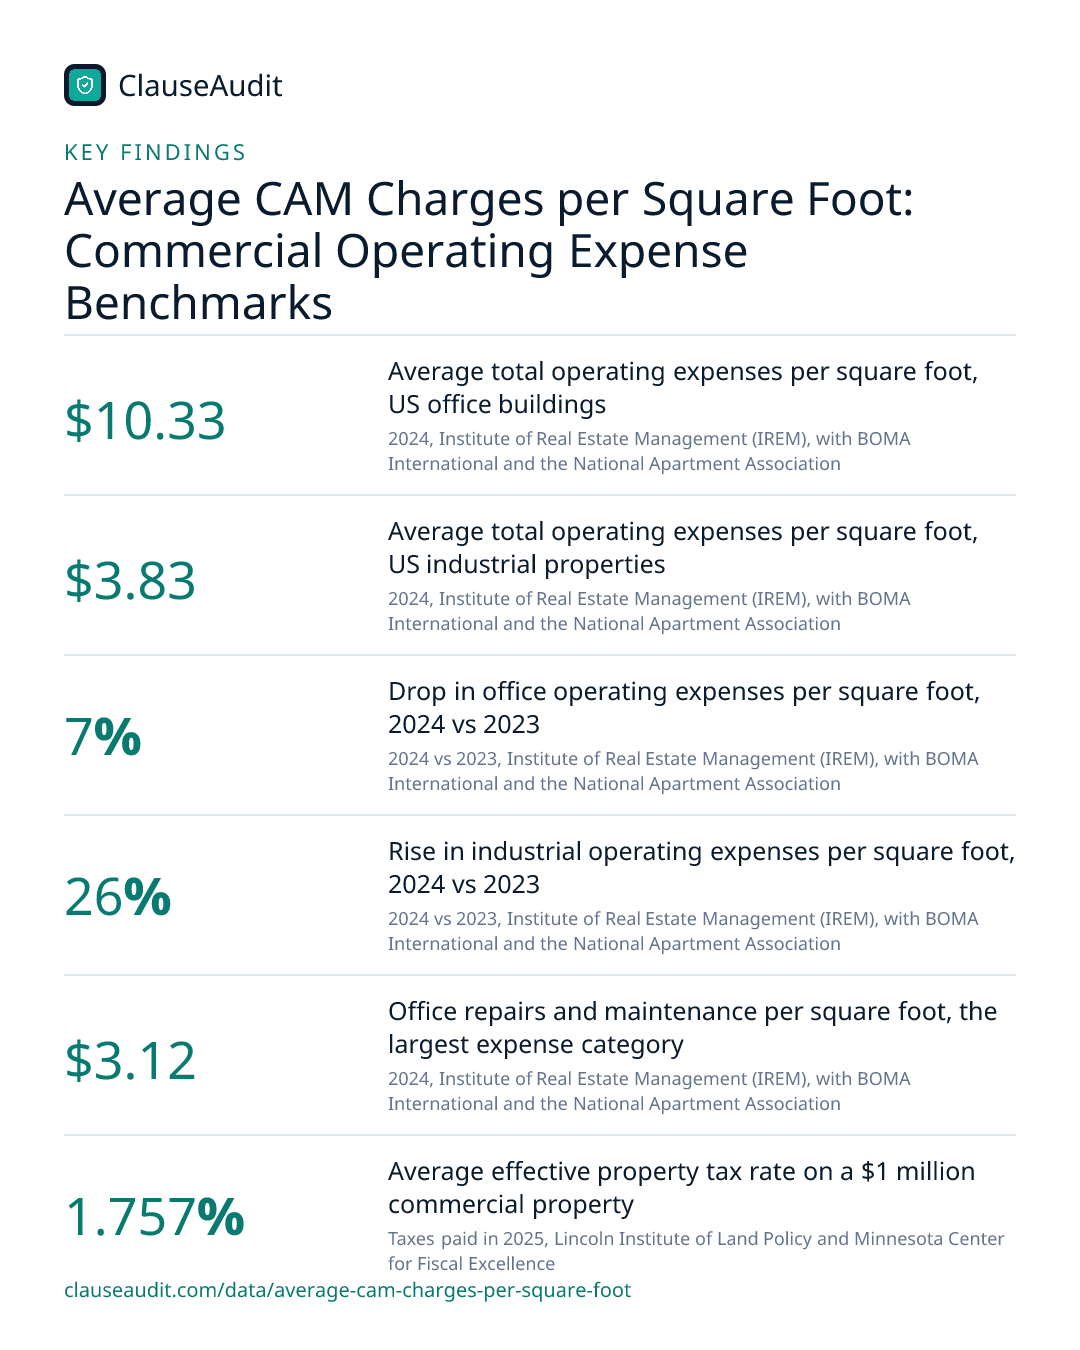
- Average total operating expenses per square foot, US office buildings (2024, Institute of Real Estate Management (IREM), with BOMA International and the National Apartment Association)
- $10.33
- Average total operating expenses per square foot, US industrial properties (2024, Institute of Real Estate Management (IREM), with BOMA International and the National Apartment Association)
- $3.83
- Drop in office operating expenses per square foot, 2024 vs 2023 (2024 vs 2023, Institute of Real Estate Management (IREM), with BOMA International and the National Apartment Association)
- 7%
- Rise in industrial operating expenses per square foot, 2024 vs 2023 (2024 vs 2023, Institute of Real Estate Management (IREM), with BOMA International and the National Apartment Association)
- 26%
- Office repairs and maintenance per square foot, the largest expense category (2024, Institute of Real Estate Management (IREM), with BOMA International and the National Apartment Association)
- $3.12
- Average effective property tax rate on a $1 million commercial property (Taxes paid in 2025, Lincoln Institute of Land Policy and Minnesota Center for Fiscal Excellence)
- 1.757%
- Annual property tax at the average rate on $1M commercial property plus fixtures (Taxes paid in 2025, Lincoln Institute of Land Policy and Minnesota Center for Fiscal Excellence)
- $21,084
- Average energy expenditure per square foot, US office buildings (2018, U.S. Energy Information Administration)
- $1.63
CAM charges are the slice of a building's running costs a landlord bills back to tenants on top of base rent. Nobody publishes a clean national average of CAM bills, because every lease defines CAM differently. What does exist is solid data on the total cost of operating commercial buildings, and that is the pool your CAM, tax and insurance recoveries are drawn from.
Use the figures on this page as a yardstick, not a quote. If the estimate in your lease sits far above the benchmark for your property type, that is a reason to ask what is inside it before you sign.
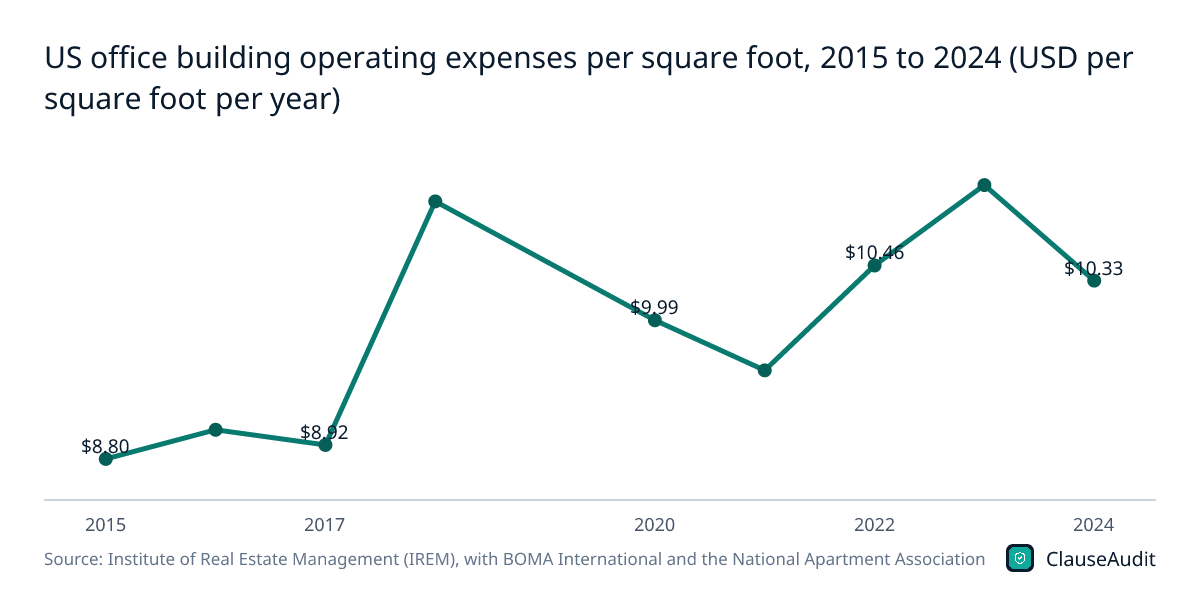
US office building operating expenses per square foot, 2015 to 2024 (USD per square foot per year)
Chart data
| Label | Value (USD per square foot per year) |
|---|---|
| 2015 | $8.80 |
| 2016 | $9.05 |
| 2017 | $8.92 |
| 2018 | $11.01 |
| 2020 | $9.99 |
| 2021 | $9.56 |
| 2022 | $10.46 |
| 2023 | $11.15 |
| 2024 | $10.33 |
Office operating costs climbed to $11.15 per square foot in 2023, then eased to $10.33 in 2024. A tenant on a pass-through lease feels both moves, so an expense cap protects you in the years that go up.
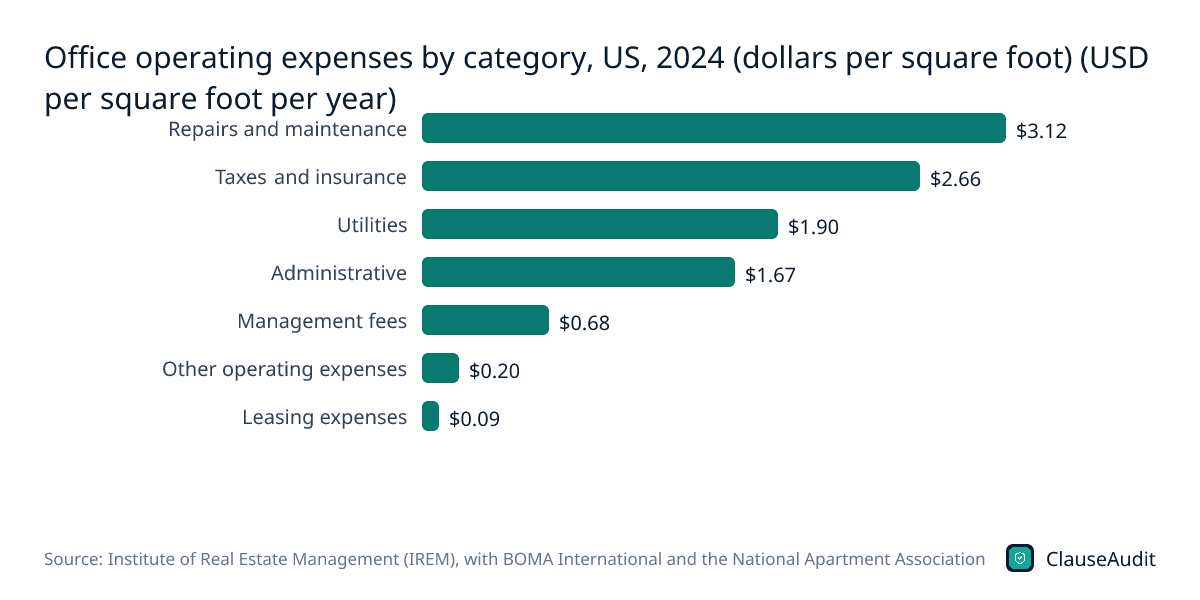
Download this chart (PNG)Office operating expenses by category, US, 2024 (dollars per square foot) (USD per square foot per year)
Chart data
| Label | Value |
|---|---|
| Repairs and maintenance | $3.12 |
| Taxes and insurance | $2.66 |
| Utilities | $1.90 |
| Administrative | $1.67 |
| Management fees | $0.68 |
| Other operating expenses | $0.20 |
| Leasing expenses | $0.09 |
Repairs and maintenance at $3.12 is the biggest office line, ahead of taxes and insurance at $2.66. Those two are where CAM disputes usually start, so ask how each is defined in your lease.
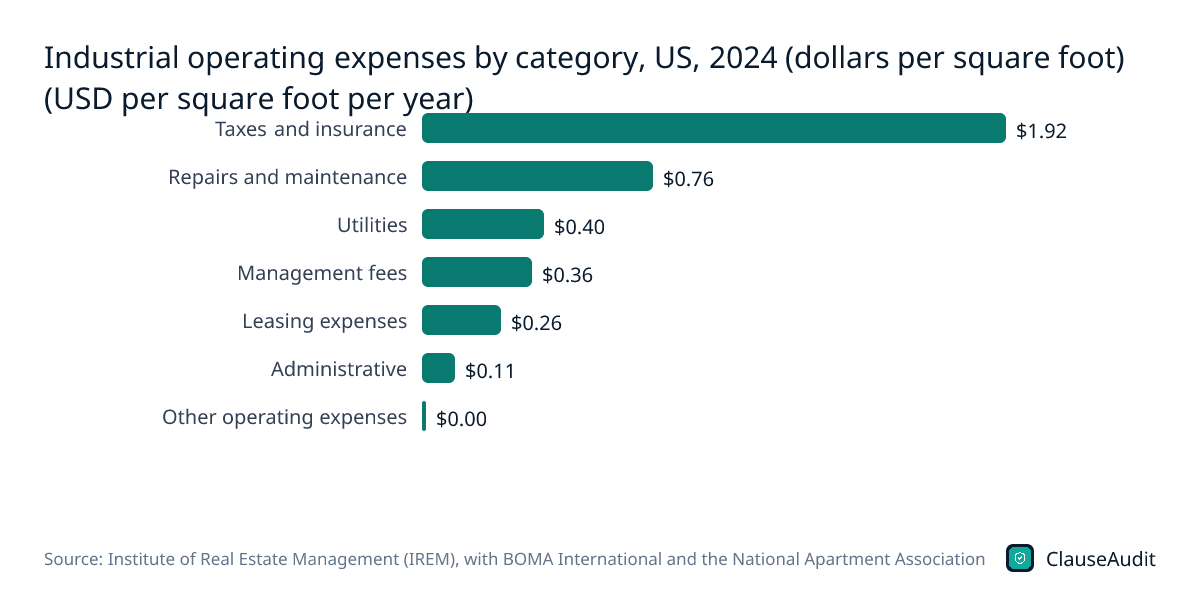
Download this chart (PNG)Industrial operating expenses by category, US, 2024 (dollars per square foot) (USD per square foot per year)
Chart data
| Label | Value |
|---|---|
| Taxes and insurance | $1.92 |
| Repairs and maintenance | $0.76 |
| Utilities | $0.40 |
| Management fees | $0.36 |
| Leasing expenses | $0.26 |
| Administrative | $0.11 |
| Other operating expenses | $0.00 |
Taxes and insurance make up the largest industrial cost at $1.92 per square foot. For a warehouse tenant on a triple net lease, the local property tax bill matters more than the maintenance budget.
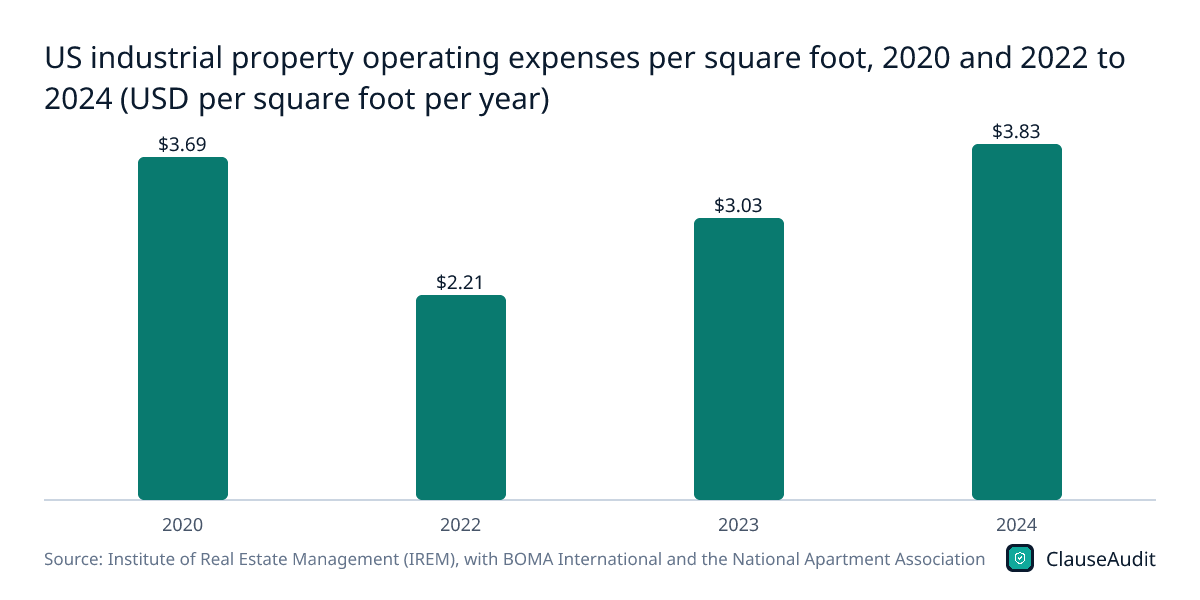
Download this chart (PNG)US industrial property operating expenses per square foot, 2020 and 2022 to 2024 (USD per square foot per year)
Chart data
| Label | Value (USD per square foot per year) |
|---|---|
| 2020 | $3.69 |
| 2022 | $2.21 |
| 2023 | $3.03 |
| 2024 | $3.83 |
Industrial costs jumped 26% in 2024, from $3.03 to $3.83 per square foot. Year-to-year swings this large are why you want your pass-through costs capped or at least explained.
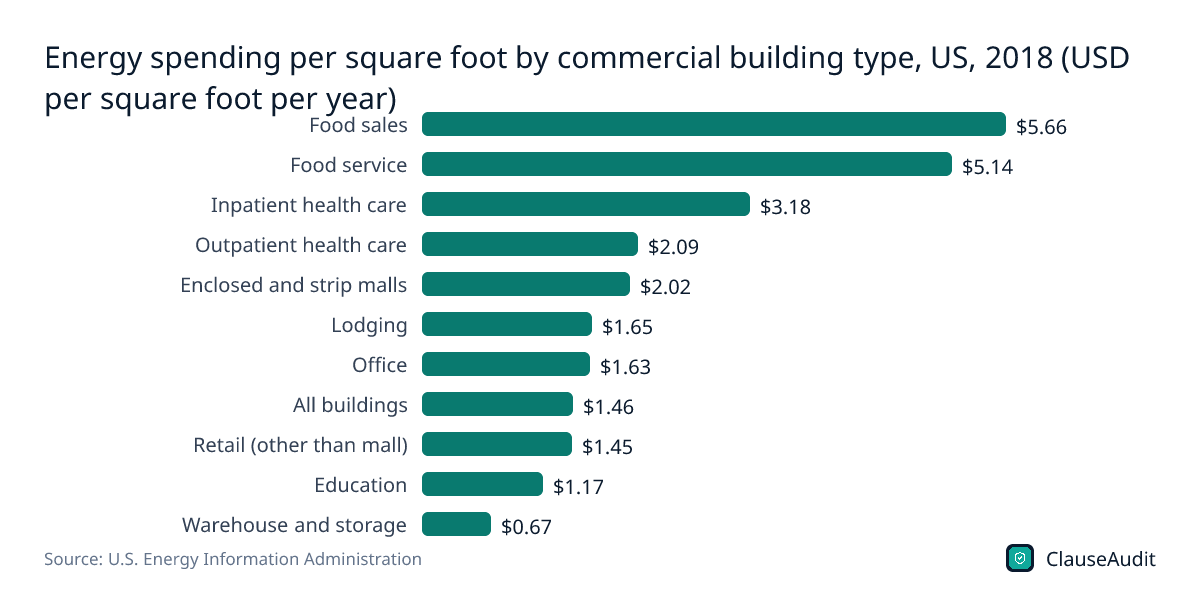
Download this chart (PNG)Energy spending per square foot by commercial building type, US, 2018 (USD per square foot per year)
Chart data
| Label | Value |
|---|---|
| Food sales | $5.66 |
| Food service | $5.14 |
| Inpatient health care | $3.18 |
| Outpatient health care | $2.09 |
| Enclosed and strip malls | $2.02 |
| Lodging | $1.65 |
| Office | $1.63 |
| All buildings | $1.46 |
| Retail (other than mall) | $1.45 |
| Education | $1.17 |
| Warehouse and storage | $0.67 |
In 2018, energy spending ran from $0.67 per square foot in warehouses to $5.66 in food sales buildings. If utilities are billed as part of CAM rather than metered separately, a restaurant next door can push up your share.
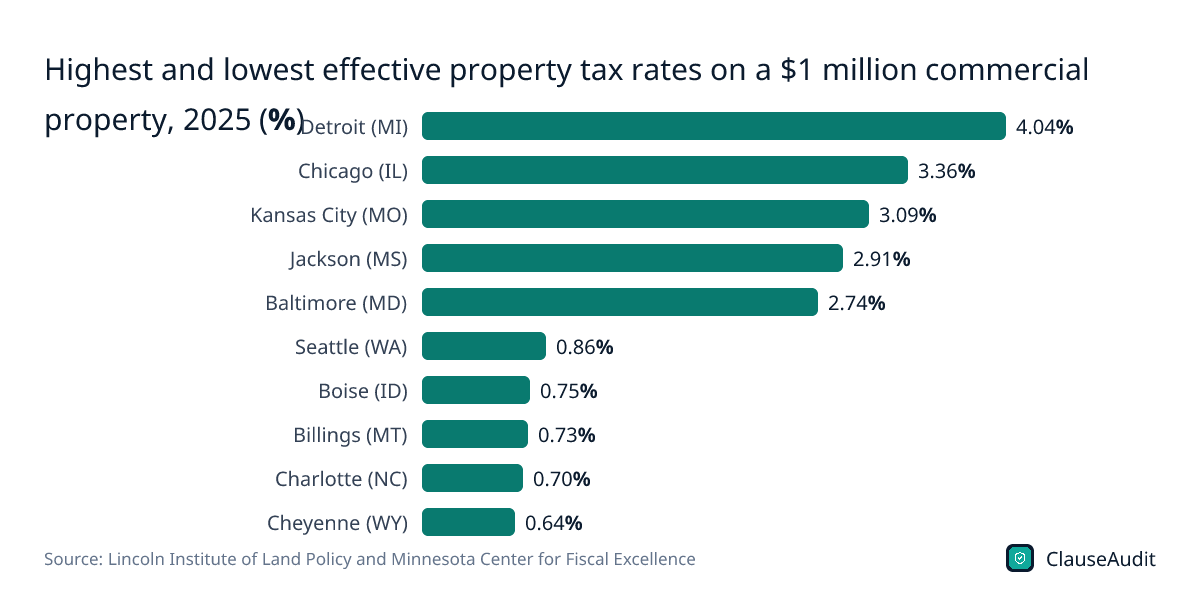
Download this chart (PNG)Highest and lowest effective property tax rates on a $1 million commercial property, 2025 (%)
Chart data
| Label | Value |
|---|---|
| Detroit (MI) | 4.04% |
| Chicago (IL) | 3.36% |
| Kansas City (MO) | 3.09% |
| Jackson (MS) | 2.91% |
| Baltimore (MD) | 2.74% |
| Seattle (WA) | 0.86% |
| Boise (ID) | 0.75% |
| Billings (MT) | 0.73% |
| Charlotte (NC) | 0.70% |
| Cheyenne (WY) | 0.64% |
The effective rate on the same $1 million commercial property ranged from 0.64% in Cheyenne to 4.04% in Detroit for taxes paid in 2025. Location alone can change the tax line on your NNN bill several times over.
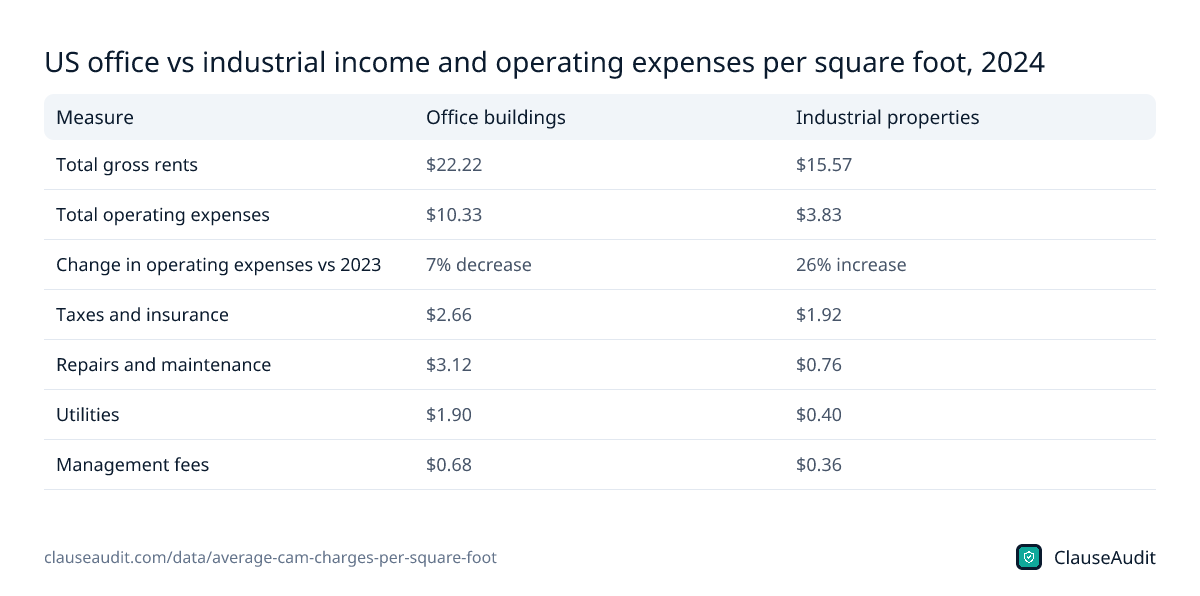
Download this chart (PNG)US office vs industrial income and operating expenses per square foot, 2024
| Measure | Office buildings | Industrial properties |
|---|---|---|
| Total gross rents | $22.22 | $15.57 |
| Total operating expenses | $10.33 | $3.83 |
| Change in operating expenses vs 2023 | 7% decrease | 26% increase |
| Taxes and insurance | $2.66 | $1.92 |
| Repairs and maintenance | $3.12 | $0.76 |
| Utilities | $1.90 | $0.40 |
| Management fees | $0.68 | $0.36 |
Source: Institute of Real Estate Management (IREM), with BOMA International and the National Apartment Association, Income/Expense IQ National Summary, 2024 Operating Data. Download as image
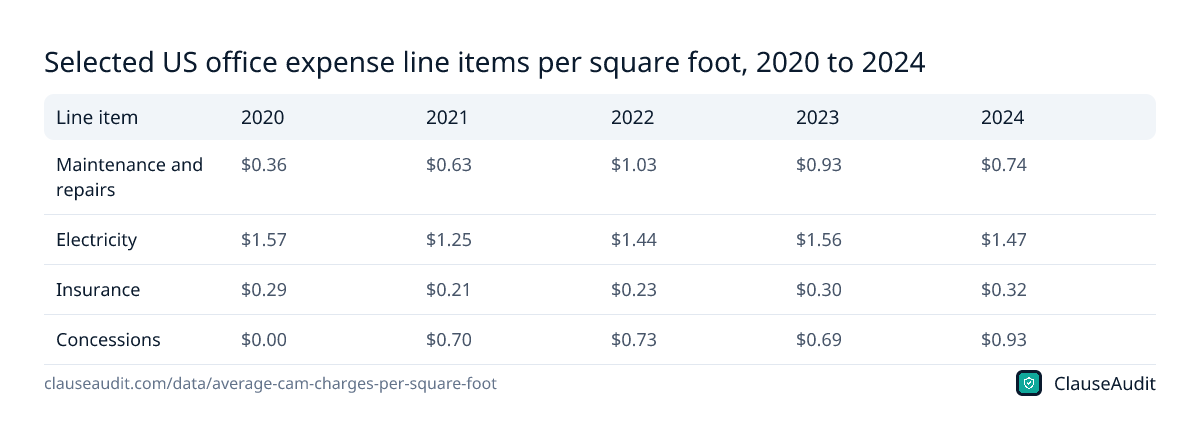
Selected US office expense line items per square foot, 2020 to 2024
| Line item | 2020 | 2021 | 2022 | 2023 | 2024 |
|---|---|---|---|---|---|
| Maintenance and repairs | $0.36 | $0.63 | $1.03 | $0.93 | $0.74 |
| Electricity | $1.57 | $1.25 | $1.44 | $1.56 | $1.47 |
| Insurance | $0.29 | $0.21 | $0.23 | $0.30 | $0.32 |
| Concessions | $0.00 | $0.70 | $0.73 | $0.69 | $0.93 |
Source: Institute of Real Estate Management (IREM), with BOMA International and the National Apartment Association, Income/Expense IQ National Summary, 2024 Operating Data. Download as image
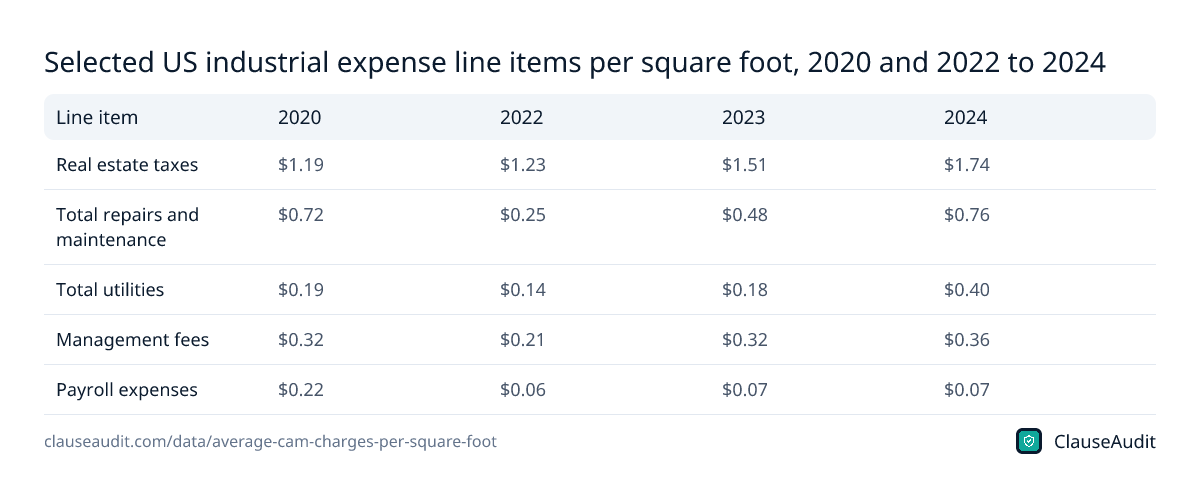
Selected US industrial expense line items per square foot, 2020 and 2022 to 2024
| Line item | 2020 | 2022 | 2023 | 2024 |
|---|---|---|---|---|
| Real estate taxes | $1.19 | $1.23 | $1.51 | $1.74 |
| Total repairs and maintenance | $0.72 | $0.25 | $0.48 | $0.76 |
| Total utilities | $0.19 | $0.14 | $0.18 | $0.40 |
| Management fees | $0.32 | $0.21 | $0.32 | $0.36 |
| Payroll expenses | $0.22 | $0.06 | $0.07 | $0.07 |
Source: Institute of Real Estate Management (IREM), with BOMA International and the National Apartment Association, Income/Expense IQ National Summary, 2024 Operating Data. Download as image
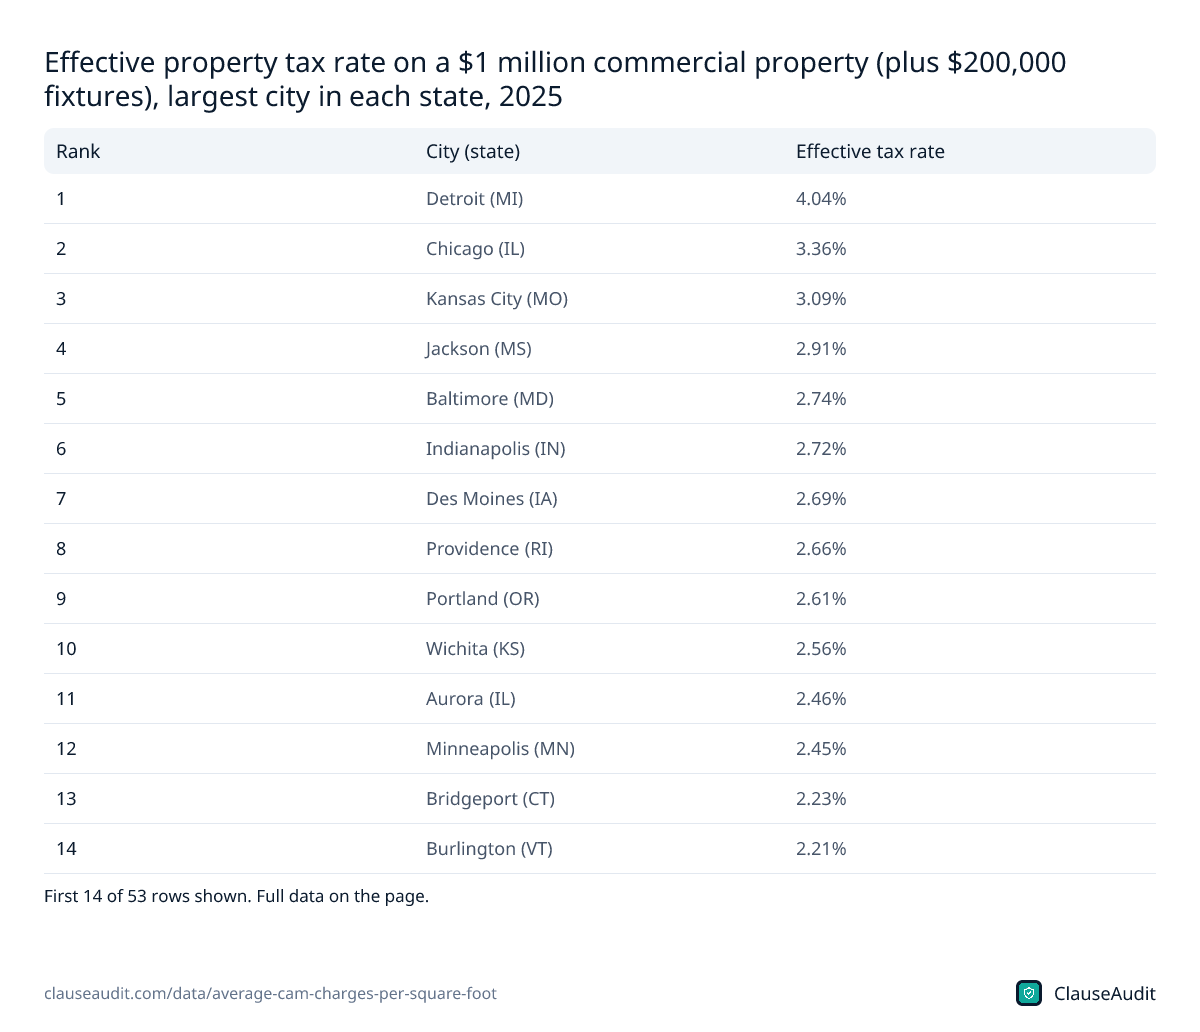
Effective property tax rate on a $1 million commercial property (plus $200,000 fixtures), largest city in each state, 2025
| Rank | City (state) | Effective tax rate |
|---|---|---|
| 1 | Detroit (MI) | 4.04% |
| 2 | Chicago (IL) | 3.36% |
| 3 | Kansas City (MO) | 3.09% |
| 4 | Jackson (MS) | 2.91% |
| 5 | Baltimore (MD) | 2.74% |
| 6 | Indianapolis (IN) | 2.72% |
| 7 | Des Moines (IA) | 2.69% |
| 8 | Providence (RI) | 2.66% |
| 9 | Portland (OR) | 2.61% |
| 10 | Wichita (KS) | 2.56% |
| 11 | Aurora (IL) | 2.46% |
| 12 | Minneapolis (MN) | 2.45% |
| 13 | Bridgeport (CT) | 2.23% |
| 14 | Burlington (VT) | 2.21% |
| 15 | Boston (MA) | 2.16% |
| 16 | Denver (CO) | 2.08% |
| 17 | Milwaukee (WI) | 2.06% |
| 18 | Philadelphia (PA) | 2.03% |
| 19 | Houston (TX) | 2.03% |
| 20 | Columbus (OH) | 1.99% |
| 21 | Charleston (SC) | 1.93% |
| 22 | Omaha (NE) | 1.88% |
| 23 | New Orleans (LA) | 1.84% |
| 24 | Charleston (WV) | 1.83% |
| 25 | New York City (NY) | 1.70% |
| 26 | Jacksonville (FL) | 1.68% |
| 27 | Albuquerque (NM) | 1.64% |
| 28 | Atlanta (GA) | 1.62% |
| 29 | Phoenix (AZ) | 1.61% |
| 30 | Wilmington (DE) | 1.60% |
| 31 | Newark (NJ) | 1.59% |
| 32 | Oklahoma City (OK) | 1.41% |
| 33 | Anchorage (AK) | 1.39% |
| 34 | Little Rock (AR) | 1.37% |
| 35 | Sioux Falls (SD) | 1.32% |
| 36 | Louisville (KY) | 1.22% |
| 37 | Portland (ME) | 1.20% |
| 38 | Los Angeles (CA) | 1.19% |
| 39 | Manchester (NH) | 1.15% |
| 40 | Washington (DC) | 1.15% |
| 41 | Fargo (ND) | 1.15% |
| 42 | Las Vegas (NV) | 1.13% |
| 43 | Nashville (TN) | 1.08% |
| 44 | Huntsville (AL) | 1.04% |
| 45 | Buffalo (NY) | 1.02% |
| 46 | Virginia Beach (VA) | 0.91% |
| 47 | Salt Lake City (UT) | 0.88% |
| 48 | Honolulu (HI) | 0.88% |
| 49 | Seattle (WA) | 0.86% |
| 50 | Boise (ID) | 0.75% |
| 51 | Billings (MT) | 0.73% |
| 52 | Charlotte (NC) | 0.70% |
| 53 | Cheyenne (WY) | 0.64% |
Source: Lincoln Institute of Land Policy and Minnesota Center for Fiscal Excellence, 50-State Property Tax Comparison Study (for taxes paid in 2025). Download as image
What are average CAM charges per square foot?
Start with the right number. The Institute of Real Estate Management puts total operating expenses for US office buildings at $10.33 per square foot in 2024, and $3.83 for industrial properties. That covers repairs, utilities, management fees, administration, taxes, insurance and a few smaller items.
Your CAM bill is a portion of that. In a strict sense, common area maintenance covers shared spaces: lobbies, parking lots, grounds upkeep, security, cleaning of hallways. Taxes and insurance are often billed as separate lines, and in a triple net lease all three are passed through together. So when a broker quotes you an NNN figure, compare it with the full operating expense number. When they quote CAM alone, expect it to be a smaller piece.
The gap between office and industrial is big for a reason. A warehouse has little shared space, few elevators and simple systems. An office building runs lobbies, HVAC across many floors and staff on site, which is why office repairs and maintenance alone came to $3.12 per square foot in 2024.
What goes into CAM charges in a commercial lease?
It depends entirely on the definition in your lease. A tight definition lists the items: cleaning of shared areas, parking lot repair, snow removal, security, elevator service, common area lighting. A loose one says something like all costs of operating, maintaining and managing the property. The second version is where surprises come from.
The IREM categories give you a sense of what a full pass-through can hold. For office buildings in 2024, the national figures were $3.12 per square foot for repairs and maintenance, $1.90 for utilities, $1.67 for administrative costs and $0.68 for management fees. Leasing expenses were only $0.09, but they should not be in your CAM at all. You are not the one paying to fill the empty suite next door.
Watch for costs that look routine but are really the landlord's investment in the building. A new HVAC system, a parking deck rebuild or a lobby renovation adds value the owner keeps after you leave. Good leases either exclude those or spread them over the useful life of the work, so you pay only the part that falls in your term.
Concessions are another tell. Office concessions, such as free rent offered to new tenants, ran $0.93 per square foot in 2024. That is a landlord cost, not an operating cost, and it has no place in a tenant's CAM bill.
Why do CAM charges go up even when my rent is fixed?
Base rent is set in the lease. Operating costs are not. When a landlord passes them through, you carry whatever the building actually costs to run that year.
Look at industrial property. Total operating expenses rose 26% in 2024, from $3.03 to $3.83 per square foot. Real estate taxes on industrial buildings went from $1.51 to $1.74, and total utilities from $0.18 to $0.40. A tenant whose rent never moved still saw a bigger reconciliation bill.
Office went the other way in 2024, with costs down 7%. But the longer trend shows how uneven this is: the line jumped from $8.92 in 2017 to $11.01 in 2018, then fell back. Pass-through costs follow the building, not your budget.
How much of my CAM bill is property tax?
More than most tenants expect. Taxes and insurance came to $2.66 per square foot for office buildings and $1.92 for industrial in 2024. For industrial space, that is the single largest operating cost.
Location drives it. The Lincoln Institute found the effective tax rate on a $1 million commercial property averaged 1.757% for taxes paid in 2025, across the largest city in each state plus DC and two other cities. That works out to $21,084 a year once you add $200,000 in fixtures. Detroit came in at 4.04%. Cheyenne was at 0.64%.
Two things to watch. First, a sale of the building can trigger a reassessment, and a pass-through clause may let the landlord bill you for the higher tax. Second, ask if you share in any tax refund if the landlord appeals the assessment and wins. Many leases are silent on that.
Are CAM charges negotiable?
The total cost of running the building is not really up for debate. How it gets split and what goes into it is. That is where you have room to push.
Ask for these, in roughly this order:
- A cap on controllable expenses, so maintenance, admin and management costs cannot rise without limit each year.
- A list of exclusions: capital improvements, roof replacement, costs to lease other suites, landlord legal fees, and fixes for code violations that existed before you moved in.
- A management fee limit. Office management fees averaged $0.68 per square foot in 2024; a fee calculated on gross revenue plus an admin markup on top can double-charge you.
- Audit rights, with a set window after each year-end statement and the landlord paying for the audit if the overcharge is material.
- A clear pro rata formula, based on rentable square footage of the whole building rather than only the occupied space.
How should a small business budget for CAM and NNN costs?
Treat the landlord's estimate as a floor, not a promise. Most leases bill CAM monthly from an estimate, then send a reconciliation after the year closes. If actual costs come in higher, you get an invoice for the difference.
Ask for the last few years of actual operating statements, not just the current budget. Compare the per square foot total with the benchmarks here. If an office landlord's operating costs sit well above $10.33, find out why: older systems, a big repair backlog or an expensive management contract are all things you would rather know before signing.
Also check which utilities are inside CAM. EIA's 2018 survey put energy spending at $1.63 per square foot for office buildings, but $5.14 for food service. In a mixed retail center without separate meters, how utilities get allocated can matter as much as the overall rate.
How ClauseAudit helps
The benchmark tells you what a building typically costs to run. Your lease decides how much of that lands on you, and the wording is often vague enough to let costs creep.
Upload your commercial lease and the automated review flags the pass-through clauses, explains each in plain English and suggests changes you can bring to the landlord.
- CAM definition: does it list what is included, or does it say "all costs of operating the property" with no limits?
- Exclusions: are capital improvements, roof and structural repairs, and the landlord's leasing and legal costs kept out?
- Expense cap: is there an annual cap on controllable CAM, and does it compound or not?
- Pro rata share: how is your share calculated, and can it change if the landlord remeasures the building?
- Reconciliation and audit: when must the landlord send the year-end statement, and do you have the right to audit it?
- Taxes and insurance: are tax increases from a sale passed through, and do you share in any tax refund?
Frequently asked questions
What is a normal CAM charge per square foot?
There is no published national average for CAM bills alone. The closest benchmark is total operating expenses, which averaged $10.33 per square foot for US office buildings and $3.83 for industrial properties in 2024. A CAM charge that covers only shared areas should be a portion of that. One that includes taxes and insurance, as in an NNN lease, will be closer to the full figure.
What is the difference between CAM and NNN charges?
CAM covers the upkeep of shared areas, such as parking lots, lobbies and grounds. NNN, or triple net, adds the landlord's property taxes and building insurance on top. So NNN charges are usually higher than CAM alone. When comparing two spaces, make sure both quotes cover the same costs before you compare the per square foot numbers.
Why are industrial operating costs so much lower than office?
Warehouses and industrial buildings have little shared space and simpler systems. In 2024, industrial repairs and maintenance came to $0.76 per square foot against $3.12 for office. Utilities were $0.40 versus $1.90. Taxes and insurance, at $1.92, are the biggest industrial cost, so the local tax rate drives much of what an industrial tenant pays.
What is a CAM reconciliation?
Most landlords bill CAM monthly from an estimate. After the year ends, they total the actual costs and compare them to what tenants paid. If costs ran higher, you get a bill for the difference. If they ran lower, you should get a credit. Your lease should set a deadline for this statement and give you the right to review the records behind it.
Can a landlord charge me for a new roof through CAM?
Only if your lease allows it. Many tenant-friendly leases exclude capital improvements like roof replacement, or allow them only spread out over the useful life of the work. Without that exclusion, a broad CAM definition can let the landlord bill a large repair to tenants in a single year. Read the definition and the exclusions list together.
Do property taxes count as CAM charges?
In many leases, property taxes are billed separately from CAM but still passed through to tenants. Under a triple net lease you pay your share of taxes, insurance and CAM. Rates vary a lot by city. For taxes paid in 2025, the effective rate on a $1 million commercial property averaged 1.757% across 53 large cities, from 0.64% in Cheyenne to 4.04% in Detroit.
How do I check if my CAM charges are too high?
Ask the landlord for the last few years of actual operating statements and divide the totals by the building's square footage. Compare that with the benchmark for your property type, $10.33 for office or $3.83 for industrial in 2024. Then look at the large lines, such as repairs, management fees and utilities, and ask about anything far above the national category figures.
Is a cap on CAM charges standard?
It is common to ask for one, but landlords rarely offer it unprompted. A cap usually applies only to controllable expenses, such as maintenance, admin and management, while taxes, insurance and utilities stay uncapped. Check whether the cap compounds each year or is measured from the first year, since that changes how much protection you actually get over a long term.
Use this data
Every chart and card below is free to reuse under CC BY 4.0. Download what you need and link back to this page.
 Stat cards
 Key findings card
 Infographic
 US office building operating expenses per square foot, 2015 to 2024 (USD per square foot per year)
 Office operating expenses by category, US, 2024 (dollars per square foot) (USD per square foot per year)
 Industrial operating expenses by category, US, 2024 (dollars per square foot) (USD per square foot per year)
 US industrial property operating expenses per square foot, 2020 and 2022 to 2024 (USD per square foot per year)
 Energy spending per square foot by commercial building type, US, 2018 (USD per square foot per year)
 Highest and lowest effective property tax rates on a $1 million commercial property, 2025 (%)
 US office vs industrial income and operating expenses per square foot, 2024
 Selected US office expense line items per square foot, 2020 to 2024
 Selected US industrial expense line items per square foot, 2020 and 2022 to 2024
 Effective property tax rate on a $1 million commercial property (plus $200,000 fixtures), largest city in each state, 2025
Embed the infographic
Free to share on your site, blog or slides under CC BY 4.0. Please keep the credit link.
Sources and method
Every number on this page comes from the sources below, each opened and read on or before October 18, 2026. A second, independent review checked every figure against its source and corrected anything that did not match. Figures that could not be confirmed were left out.
- Institute of Real Estate Management (IREM), with BOMA International and the National Apartment Association, Income/Expense IQ National Summary, 2024 Operating Data (2024 operating data (PDF dated October 2025))
- U.S. Energy Information Administration, 2018 Commercial Buildings Energy Consumption Survey (CBECS), Table C4: Sum of major fuels consumption and expenditure gross energy intensities (Released September 2022, revised December 2022)
- Lincoln Institute of Land Policy and Minnesota Center for Fiscal Excellence, 50-State Property Tax Comparison Study (for taxes paid in 2025) (April 2026)
Cite this page
ClauseAudit, “Average CAM Charges per Square Foot: Commercial Operating Expense Benchmarks”, updated October 18, 2026, https://clauseaudit.com/data/average-cam-charges-per-square-foot. Free to reuse with a link back (CC BY 4.0).
This page summarises published data and law as checked on October 18, 2026. Figures are updated as new editions are released, and your own situation may differ. It is general information, not legal, tax or financial advice.