Remote Work Statistics 2026: 160+ Numbers on Telework, Hybrid Work and Return to Office
By ClauseAudit Research · 166 statistics · 81 sources ·
What are the key remote work statistics for 2026?
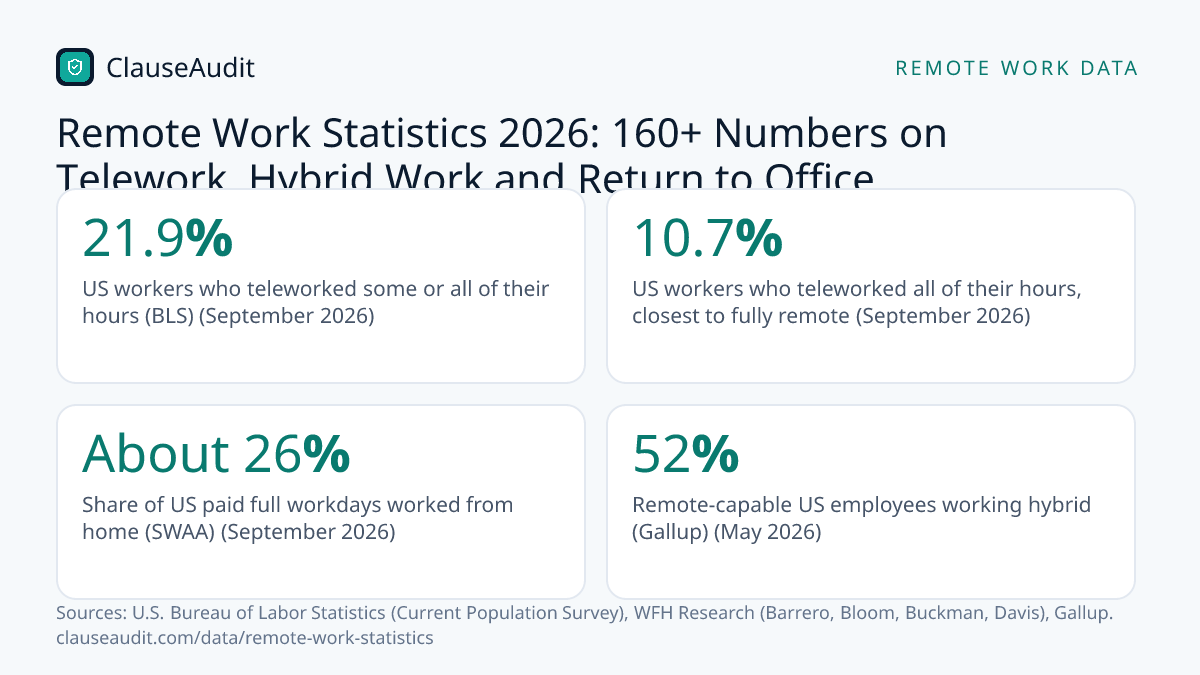
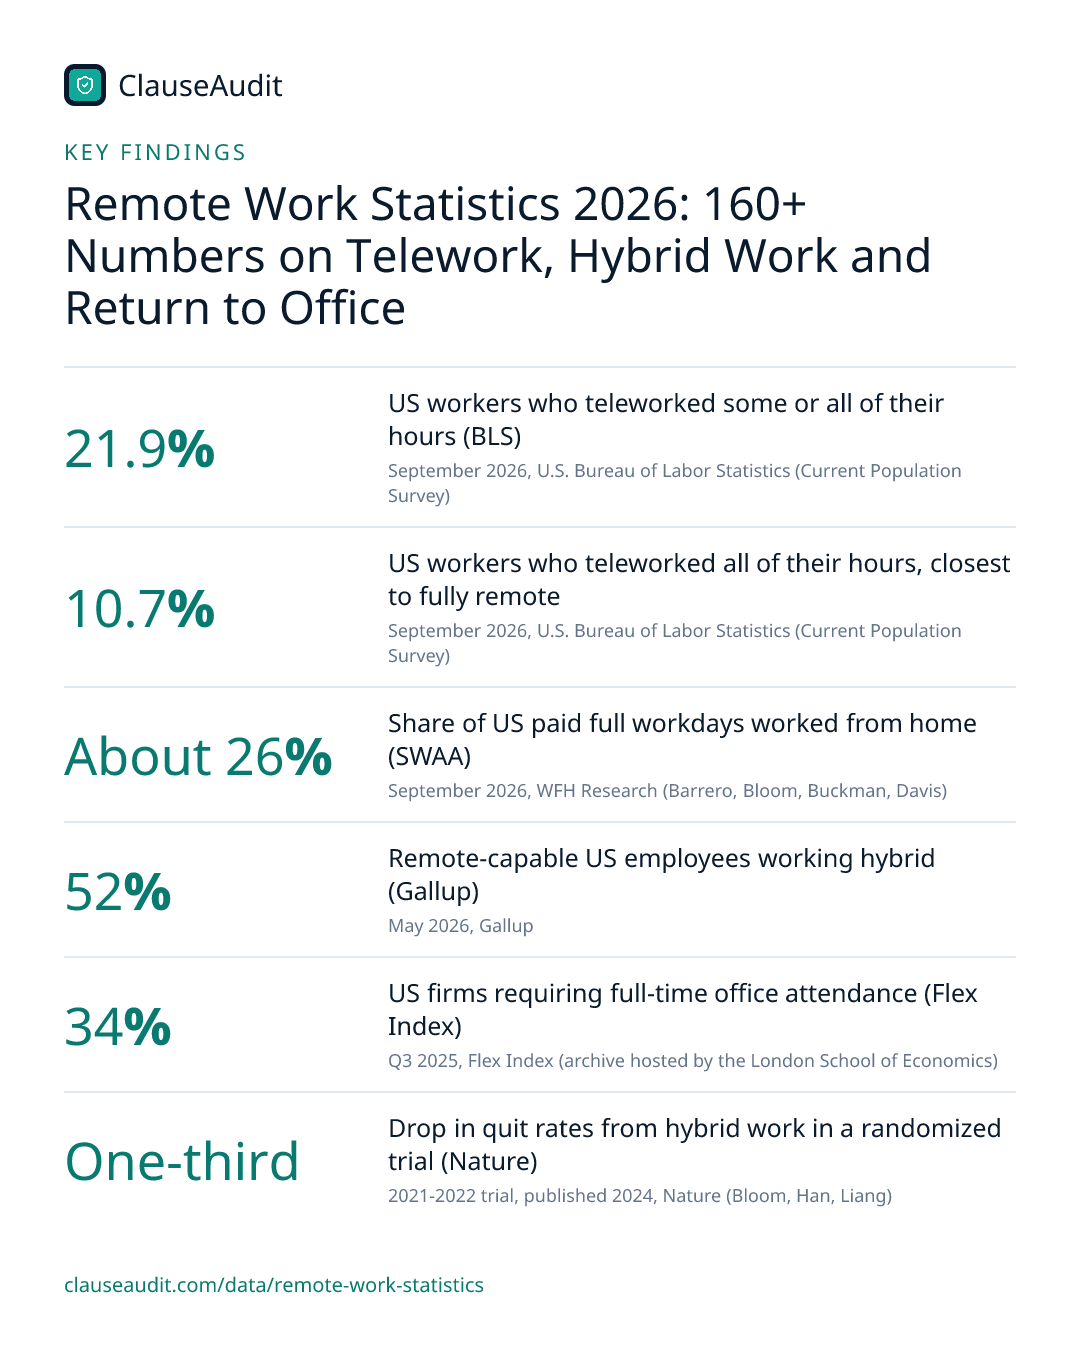
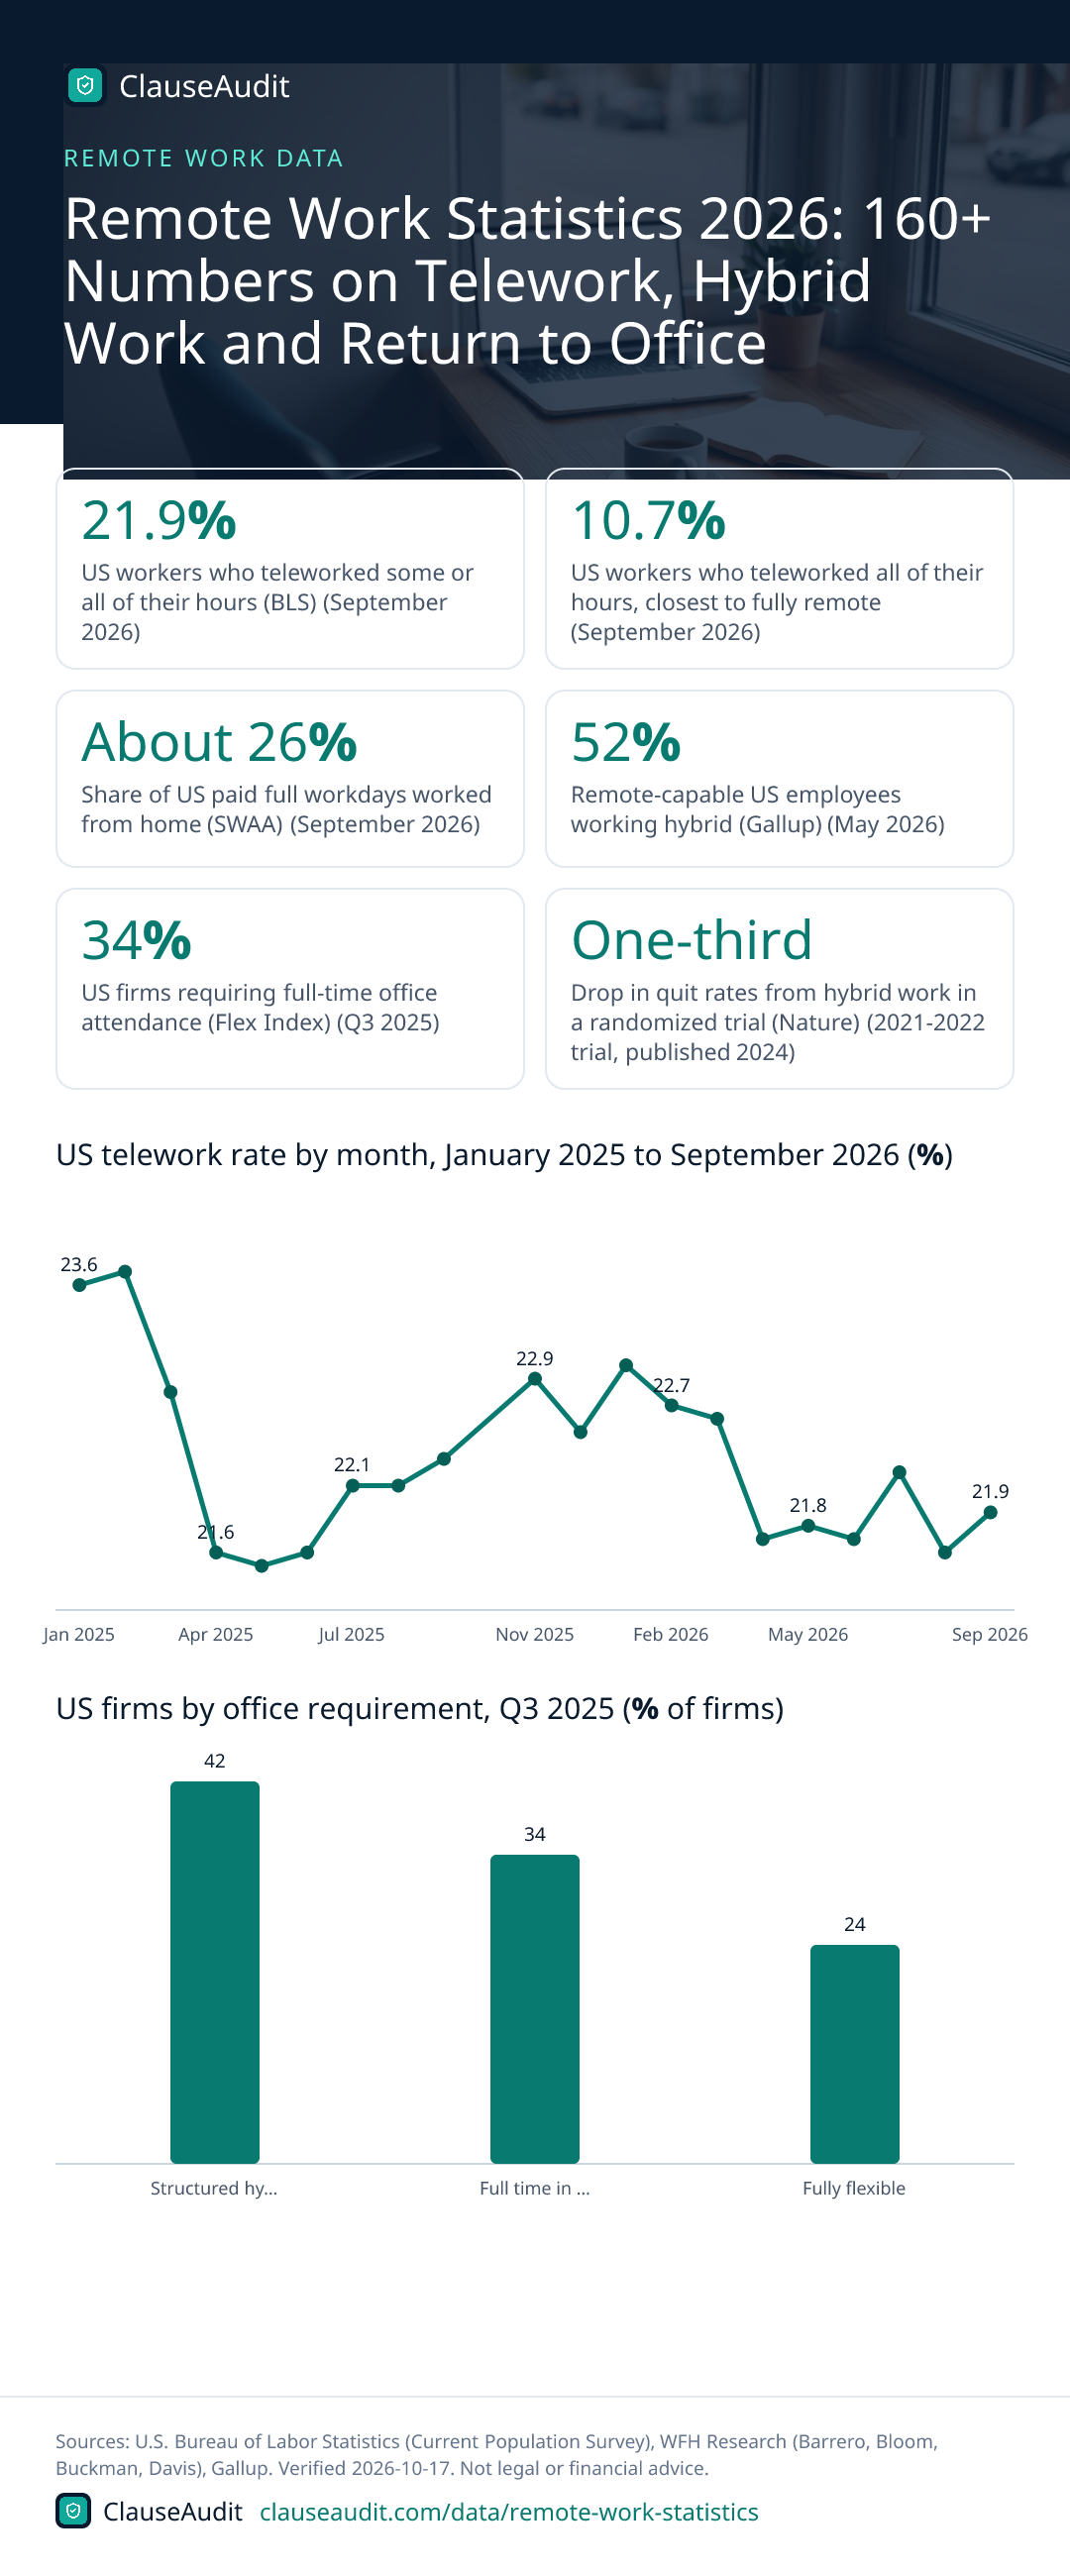
In September 2026, 21.9% of US workers teleworked some or all of their hours and 10.7% teleworked all of them, according to the BLS. About 26% of paid full workdays were worked from home that month. Gallup found 52% of remote-capable employees worked hybrid in May 2026, and 34% of US firms required full-time office attendance in Q3 2025.

- US workers who teleworked some or all of their hours (BLS) (September 2026, U.S. Bureau of Labor Statistics (Current Population Survey))
- 21.9%
- US workers who teleworked all of their hours, closest to fully remote (September 2026, U.S. Bureau of Labor Statistics (Current Population Survey))
- 10.7%
- Share of US paid full workdays worked from home (SWAA) (September 2026, WFH Research (Barrero, Bloom, Buckman, Davis))
- About 26%
- Remote-capable US employees working hybrid (Gallup) (May 2026, Gallup)
- 52%
- US firms requiring full-time office attendance (Flex Index) (Q3 2025, Flex Index (archive hosted by the London School of Economics))
- 34%
- Drop in quit rates from hybrid work in a randomized trial (Nature) (2021-2022 trial, published 2024, Nature (Bloom, Han, Liang))
- One-third
- US Indeed job postings mentioning remote or hybrid work (30 September 2026, Indeed Hiring Lab)
- 8.6%
- US national office vacancy rate (Cushman & Wakefield) (Q3 2026, Cushman & Wakefield)
- 19.8%
This page collects more than 160 remote work statistics in twelve groups: how many Americans work remotely, work from home days, hybrid work, return to office mandates, productivity research, remote job postings, who works remotely, pay and cost savings, office real estate, wellbeing and security, other countries including India, and the policy and legal rules around remote work.
Most US figures come from the Bureau of Labor Statistics, the Census Bureau, the Federal Reserve, OPM and GAO, with academic studies, Gallup, Pew and industry trackers labeled by name. Every number links to the page it came from, and the data was checked on October 17, 2026.
How Many People Work Remotely in the US? Official Telework Statistics
The telework questions in the monthly Current Population Survey are the main official US count. Census, Federal Reserve and time-use surveys ask different questions, so their figures run higher or lower.
- 21.9% of US workers at work teleworked for some or all of their hours in September 2026, according to the Current Population Survey. (U.S. Bureau of Labor Statistics (Current Population Survey), Table A-41. People at work by telework status and selected characteristics, September 2026, September 2026)
- 10.7% of US workers at work teleworked all of their hours in September 2026, the BLS measure closest to fully remote work. (U.S. Bureau of Labor Statistics (Current Population Survey), Table A-41. People at work by telework status and selected characteristics, September 2026, September 2026)
- 11.2% of US workers at work teleworked for some but not all of their hours in September 2026, a hybrid-style pattern. (U.S. Bureau of Labor Statistics (Current Population Survey), Table A-41. People at work by telework status and selected characteristics, September 2026, September 2026)
- 23.3% of full-time US workers teleworked in September 2026, compared with 15.2% of part-time workers. (U.S. Bureau of Labor Statistics (Current Population Survey), Table A-42. People at work by telework status, usual full- or part-time status, occupation, industry, and class of worker, September 2026, September 2026)
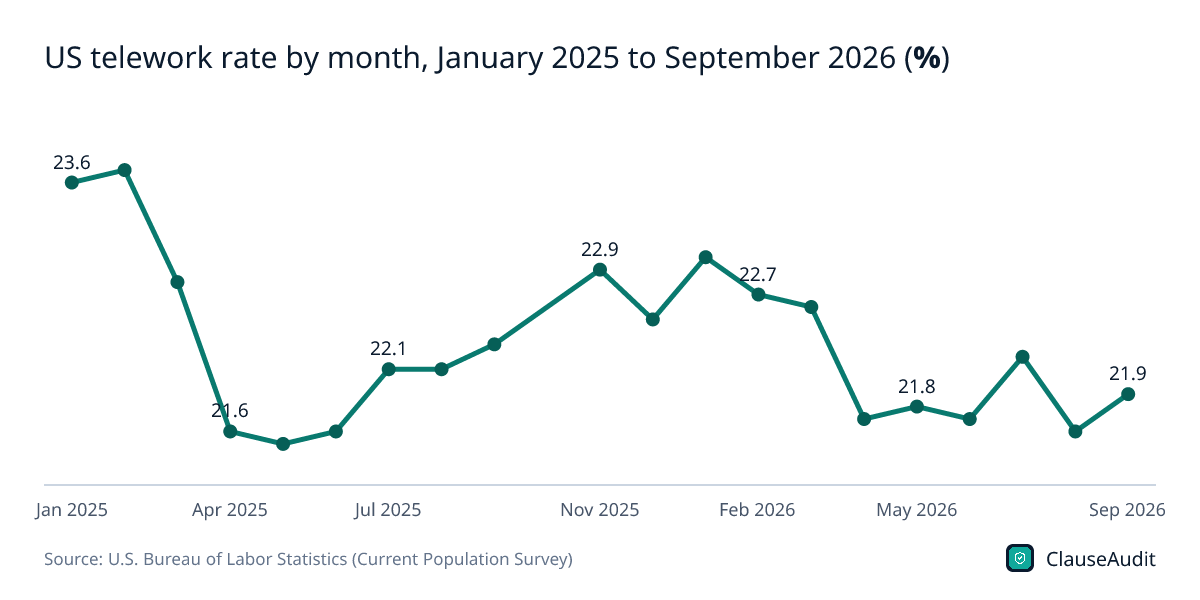
- 21.5% to 23.7% was the range of the monthly US telework rate from January 2025 to September 2026, showing a flat plateau rather than a decline. (U.S. Bureau of Labor Statistics (Current Population Survey), Percent, Persons who teleworked (series LNU0201B46B), Jan 2025 to Sep 2026)
- 35% of employed Americans did some or all of their work at home on days they worked in 2025, per the American Time Use Survey. (U.S. Bureau of Labor Statistics, American Time Use Survey: 2025 Results (USDL-26-1022), 2025)
- 38% of employed women worked at home on days they worked in 2025, compared with 31% of employed men. (U.S. Bureau of Labor Statistics, American Time Use Survey: 2025 Results (USDL-26-1022), 2025)
- 39% of US workers said they worked from home at least some of the time in the week before the Federal Reserve's October 2025 survey. (Board of Governors of the Federal Reserve System, Economic Well-Being of U.S. Households in 2025, October 2025)
- 17% of US workers worked entirely from home in 2025, while 23% worked from home some of the time. (Board of Governors of the Federal Reserve System, Economic Well-Being of U.S. Households in 2025, October 2025)
- 13% of all US workers worked from home one or two days per week in 2025, the most common hybrid pattern. (Board of Governors of the Federal Reserve System, Economic Well-Being of U.S. Households in 2025, October 2025)
- 5.7% to 17.9% was the jump in the share of US workers primarily working from home between 2019 and 2021, per the American Community Survey. (U.S. Census Bureau, Commuting in the United States: 2022 (ACSBR-018), 2019 to 2021)
- 15.2% of US workers primarily worked from home in 2022, down from the 2021 peak as pandemic protections ended. (U.S. Census Bureau, Commuting in the United States: 2022 (ACSBR-018), 2022)
- More than 20 million Americans worked from home in 2022, while almost 140 million routinely commuted to work. (U.S. Census Bureau, Commuting in the United States: 2022 (ACSBR-018), 2022)
- 48.3% of workers in the District of Columbia worked from home in 2021, the highest share of any state or state equivalent in the ACS. (U.S. Census Bureau, The Number of People Primarily Working From Home Tripled Between 2019 and 2021 (2021 ACS 1-year estimates, release CB22-155), 2021)
- 59% of US workers whose jobs can mainly be done from home were working from home all or most of the time in January 2022 (Pew). (Pew Research Center, COVID-19 Pandemic Continues To Reshape Work in America, January 2022)
Figure 1: US telework rate by month, January 2025 to September 2026 (%)
Chart data
| Label | Value (%) |
|---|---|
| Jan 2025 | 23.6 |
| Feb 2025 | 23.7 |
| Mar 2025 | 22.8 |
| Apr 2025 | 21.6 |
| May 2025 | 21.5 |
| Jun 2025 | 21.6 |
| Jul 2025 | 22.1 |
| Aug 2025 | 22.1 |
| Sep 2025 | 22.3 |
| Nov 2025 | 22.9 |
| Dec 2025 | 22.5 |
| Jan 2026 | 23 |
| Feb 2026 | 22.7 |
| Mar 2026 | 22.6 |
| Apr 2026 | 21.7 |
| May 2026 | 21.8 |
| Jun 2026 | 21.7 |
| Jul 2026 | 22.2 |
| Aug 2026 | 21.6 |
| Sep 2026 | 21.9 |
Work From Home Days Statistics: Share of Paid Workdays at Home
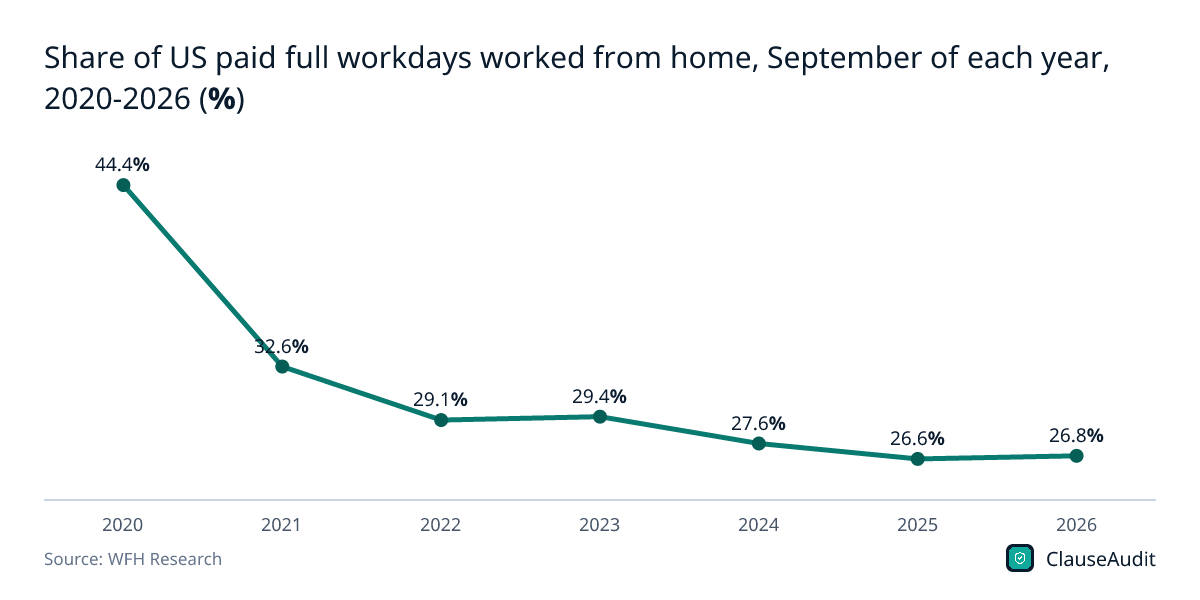
The Survey of Working Arrangements and Attitudes measures the share of paid workdays done at home rather than the share of people. That share peaked at 61.68% in May 2020 and was about 26% in September 2026.
- About 26% of paid full workdays in the US were worked from home in September 2026, according to the Survey of Working Arrangements and Attitudes. (WFH Research (Barrero, Bloom, Buckman, Davis), SWAA October 2026 Updates, September 2026)
- 61.68% of paid full workdays were worked from home in May 2020, the first and highest monthly reading in the SWAA series. (WFH Research, SWAA monthly work from home rate time series, May 2020)
- 3.5 times the 2019 level is where work from home has stabilized in the US, at about 25% of all paid workdays as of 2025. (National Bureau of Economic Research (Barrero, Bloom, Davis), Why Working from Home Will Stick (NBER Working Paper 28731), 2025)
- 12% of full-time US wage and salary employees were fully remote from October 2025 to September 2026, while 62% worked fully on site. (WFH Research (Barrero, Bloom, Buckman, Davis), SWAA October 2026 Updates, Oct 2025 to Sep 2026)
- 26% of full-time US wage and salary employees worked a hybrid arrangement, splitting the week between home and business premises, over the same period. (WFH Research (Barrero, Bloom, Buckman, Davis), SWAA October 2026 Updates, Oct 2025 to Sep 2026)
- 1.3-1.5 days per week is where US employer plans for work from home have hovered, closely matching actual WFH levels since mid-2022. (WFH Research (Barrero, Bloom, Buckman, Davis), SWAA October 2026 Updates, July 2020 to September 2026)
- Half a day per week is roughly the gap between how much US employees want to work from home and how much they actually do. (WFH Research (Barrero, Bloom, Buckman, Davis), SWAA September 2026 Updates, August 2020 to August 2026)
- 33.0% of full paid workdays were worked from home by US graduate-degree holders in 2026 to date, versus 19.2% for workers with high school or less. (WFH Research (Barrero, Bloom, Buckman, Davis), SWAA October 2026 Updates, 2026 (months to date))
- Almost 40 years of pre-pandemic growth in work from home is what the pandemic’s permanent increase in WFH is equivalent to, based on SWAA and time-use data. (WFH Research (Barrero, Bloom, Buckman, Davis), SWAA October 2026 Updates, 1965 to 2026)
- 5.10 hours is the average time employed Americans who worked at home spent working there on days worked in 2025, rising to 5.35 hours for full-time workers. (U.S. Bureau of Labor Statistics, American Time Use Survey, Table 6: Employed persons working at home and at their workplace, 2025 annual averages, 2025 annual average)
- More than 45 percent of US workers in professional and business services or information lived in a different metro area from their manager by February 2026, per ADP payroll data. (ADP Research, Who went the distance? (Today at Work), February 2026)
- 28.6 percent of US finance and insurance workers lived in a different metro from their manager at the start of 2026, up from 18.9 percent before the pandemic. (ADP Research, Who went the distance? (Today at Work), Early 2026)
- 2.66 days a week is how much college-educated women with children want to work from home, 0.13 days more than women without children, across 40 countries. (Stanford Institute for Economic Policy Research (Aksoy, Barrero, Bloom, Davis, Dolls, Zarate), Working from Home in 2025: Five Key Facts, Nov 2024 to Feb 2025)
- 28 percent of paid workdays among Americans aged 20 to 64 were full days worked at home as of mid-2023, about four times the 2019 rate. (American Economic Association, The Evolution of Work from Home (Barrero, Bloom and Davis), Journal of Economic Perspectives 37(4), Mid-2023)
Hybrid Work Statistics: Hybrid vs Fully Remote vs On-Site
Hybrid is the most common arrangement for people whose jobs can be done remotely. Gallup, the Flex Index, Pew and Owl Labs each measure it differently, from employee reports to company policy.
- 52% of US employees with remote-capable jobs work hybrid, while 26% are exclusively remote and 22% work fully on-site. (Gallup, Indicator: Hybrid Work, May 2026)
- 61% of remote-capable US employees say they prefer hybrid work, versus 33% who prefer fully remote and 6% who prefer on-site. (Gallup, Indicator: Hybrid Work, November 2025)
- 11% of US employees are on teams that set their hybrid policy together, the teams most likely to call their policy fair. (Gallup, Indicator: Hybrid Work, May 2025)
- 66% of US firms offer work location flexibility, meaning they do not require corporate employees in the office full time. (Flex Index (archive hosted by the London School of Economics), Flex Report Q3 2025, Q3 2025)
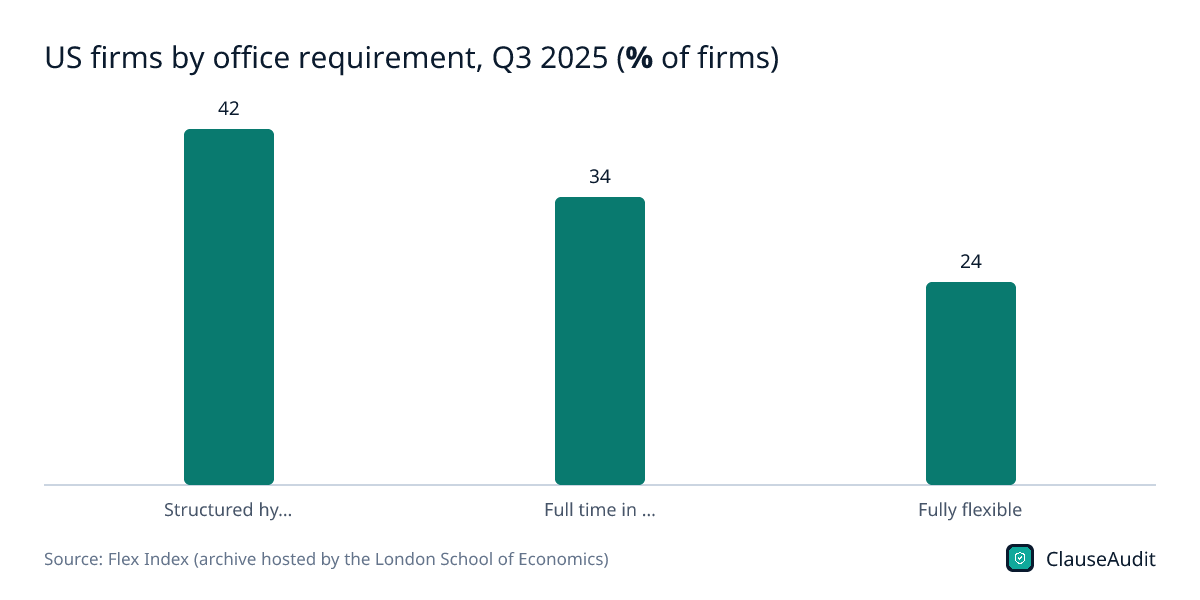
- 42% of US firms use a Structured Hybrid model with set office expectations, up from 20% in Q1 2023. (Flex Index (archive hosted by the London School of Economics), Flex Report Q3 2025, Q3 2025)
- 67% of US companies with fewer than 500 employees are Fully Flexible, compared with just 11% of enterprises with 25,000+ employees. (Flex Index (archive hosted by the London School of Economics), Flex Report Q3 2025, Q3 2025)
- 3 days a week is how long most US hybrid workers spend in the office, according to Owl Labs’ 2026 State of Hybrid Work report. (Owl Labs, State of Hybrid Work 2026 (US Report, 10th edition), 2026 edition)
- 40% of US hybrid workers are still "coffee badging", going to the office for a few hours just to show their face, per Owl Labs’ 2026 report. (Owl Labs, State of Hybrid Work 2026 (US Report, 10th edition), 2026 edition)
- 25% of remote-capable US employees expect to work exclusively remote in the long term, while 52% expect hybrid and 23% expect on-site work. (Gallup, Indicator: Hybrid Work, May 2026)
- 75% of US workers with teleworkable jobs who are not fully remote say their employer requires in-person days, up from 63% in early 2023. (Pew Research Center, Many remote workers say they'd be likely to leave their job if they could no longer work from home, October 2024)
- 24% of US hybrid workers say they would work from home all the time if they could choose, while 72% would pick a hybrid arrangement. (Pew Research Center, Many remote workers say they'd be likely to leave their job if they could no longer work from home, October 2024)
- 10.0% of employed people in Canada had a hybrid arrangement, splitting work between home and another location, a share that changed little through May 2025. (Statistics Canada, Number of Canadian commuters increases for fourth straight year in 2025 (The Daily), May 2025)
- 17.4% of employed people in Canada mostly worked from home in May 2025, down from 18.7% in May 2024. (Statistics Canada, Number of Canadian commuters increases for fourth straight year in 2025 (The Daily), May 2025)
- 60% of remote-capable US employees wanted a long-term hybrid work arrangement in June 2022, while only 6% wanted to work entirely on-site. (Gallup, Returning to the Office: The Current, Preferred and Future State of Remote Work, June 2022)
- Nearly 40 percent of US firms with remote workers in the Atlanta Fed business survey said management decides remote days; about 30% let employees decide (2021 survey). (Federal Reserve Bank of Atlanta, Hybrid Working Arrangements: Who Decides? (Survey of Business Uncertainty), July and December 2021 surveys)
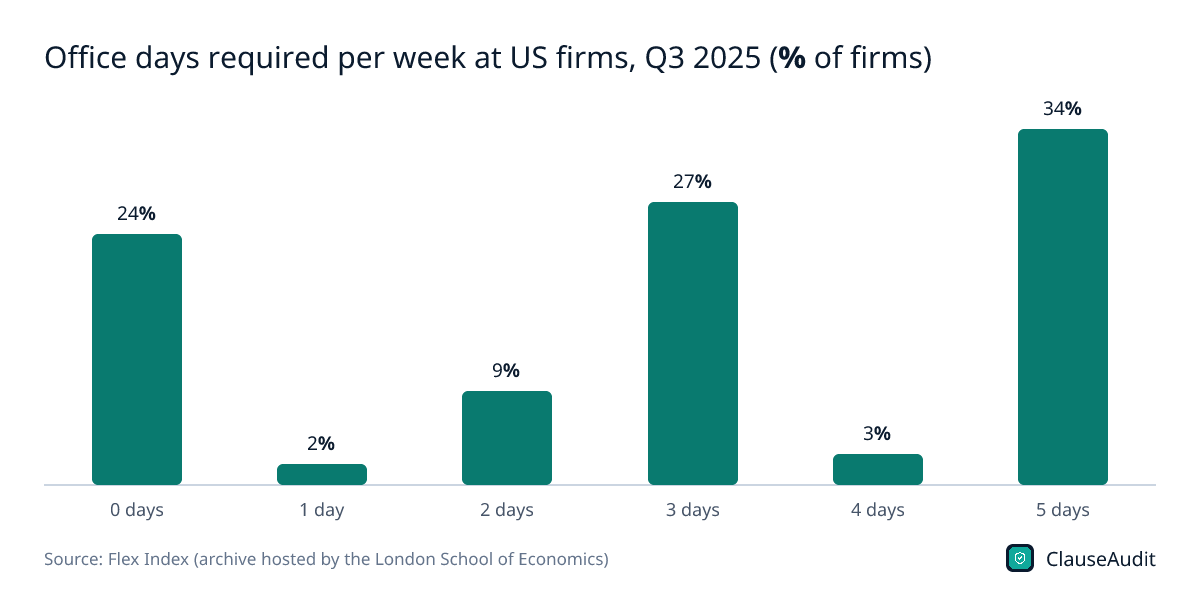
Figure 3: Office days required per week at US firms, Q3 2025 (% of firms)
Chart data
| Label | Value (% of firms) |
|---|---|
| 0 days | 24% |
| 1 day | 2% |
| 2 days | 9% |
| 3 days | 27% |
| 4 days | 3% |
| 5 days | 34% |
Return to Office Statistics: RTO Mandates, Compliance and Attrition
Office requirements rose from early 2024 to late 2025, and the latest rise in full-time mandates came mainly from government agencies. These figures cover company policies, including Amazon and Microsoft, the federal return-to-office order and how workers responded.
- 34% of US firms required full-time office attendance in Q3 2025, a 2-point rise driven mainly by federal and state government agencies. (Flex Index (archive hosted by the London School of Economics), Flex Report Q3 2025, Q3 2025)
- 2.87 days per week is the average office time US firms required of corporate employees in Q3 2025, up from 2.57 days in Q1 2024. (Flex Index (archive hosted by the London School of Economics), Flex Report Q3 2025, Q3 2025)
- 45% of Fortune 100 companies required four or five office days per week in Q3 2025, while 71% still offered some flexibility. (Flex Index (archive hosted by the London School of Economics), Flex Report Q3 2025, Q3 2025)
- 12% was the rise in required office time at US firms since early 2024, while actual office attendance increased only 1% to 3%. (Flex Index (archive hosted by the London School of Economics), Flex Report Q3 2025, Q1 2024 to Q3 2025)
- 36% of employers surveyed by Robert Half reported increasing the number of days employees must work on-site over the past year. (Robert Half, Remote work statistics and trends, Past year (2026 report))
- January 20, 2025 is the date of the presidential memorandum ordering federal agencies to end remote work and return staff to their duty stations full time. (The White House, Return to In-Person Work (Presidential Memorandum), January 2025)
- 207,710 federal employees, about 9% of the civilian workforce at the 24 CFO Act agencies, were fully remote in June 2024, before the RTO order. (U.S. Government Accountability Office, Federal Remote Work: OPM Guidance Could Help Relevant Agencies Evaluate Effects on Agency Performance (GAO-25-107363), June 2024)
- 366 applications on average went to remote federal job announcements, compared with 51 for similar non-remote positions, according to OPM data reviewed by GAO. (U.S. Government Accountability Office, Federal Remote Work: OPM Guidance Could Help Relevant Agencies Evaluate Effects on Agency Performance (GAO-25-107363), 2025 report)
- 18.4% of federal government workers teleworked in September 2026, below the 21.0% rate for private-industry wage and salary workers. (U.S. Bureau of Labor Statistics (Current Population Survey), Table A-42. People at work by telework status, usual full- or part-time status, occupation, industry, and class of worker, September 2026, September 2026)
- 76% of 7,463 federal employees in a self-selected May 2026 Federal News Network survey said they were less productive after returning to the office. (Federal News Network, After returning to the office, federal employees report low productivity, morale, May 2026)
- 93% of federal employees responding to the non-scientific May 2026 Federal News Network survey called for a more flexible schedule with fewer office days. (Federal News Network, After returning to the office, federal employees report low productivity, morale, May 2026)
- 5 days per week in the office became Amazon's corporate expectation starting January 2, 2025, a return to its pre-COVID policy. (Amazon, CEO Andy Jassy's latest update on Amazon's return-to-office, manager team ratio, January 2025)
- 3 days a week in the office became Microsoft's expectation for Puget Sound employees by the end of February 2026, under its September 2025 update. (Microsoft, Microsoft flexible work update, February 2026)
- 38% of US full-time workers said in 2024 that a full-time office requirement would make them decline a job offer. (Owl Labs, State of Hybrid Work 2024 (US report, 2,000 full-time workers), July 2024)
Figure 4: US firms by office requirement, Q3 2025 (% of firms)
Chart data
| Label | Value (% of firms) |
|---|---|
| Structured hybrid | 42 |
| Full time in office | 34 |
| Fully flexible | 24 |
Remote Work Productivity Statistics: What the Research Shows
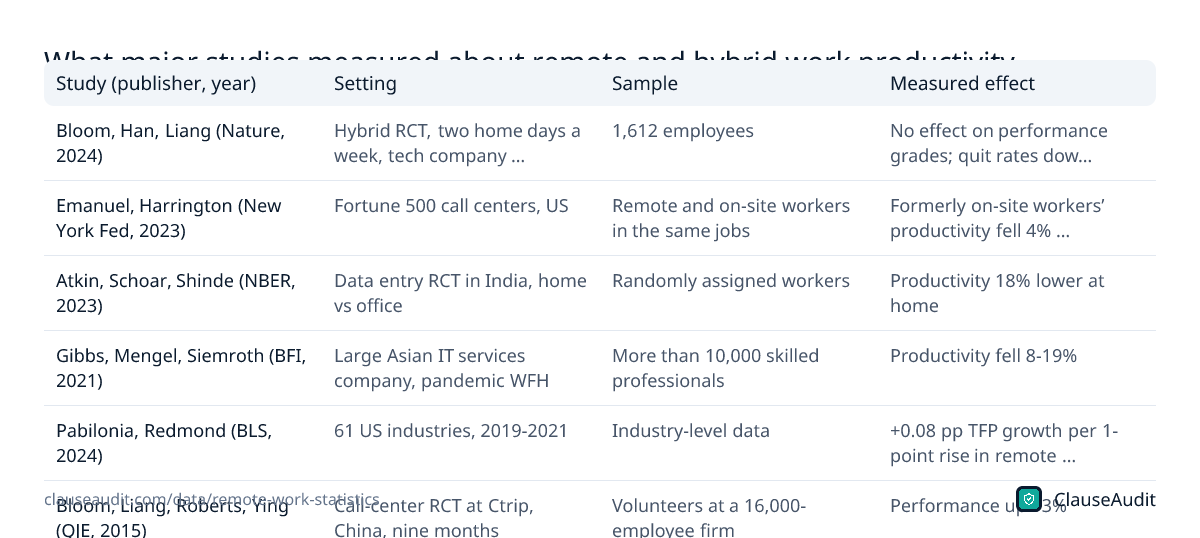
Studies disagree because they measure different jobs and settings. A randomized trial of hybrid work found no effect on performance grades, while studies of call-center and data entry work at home found lower output in some cases and higher output in one.
- One-third fewer quits followed when staff at a Chinese tech company worked from home two days a week, in a randomized trial published in Nature in 2024. (Nature (Bloom, Han, Liang), Hybrid working from home improves retention without damaging performance, 2021-2022 trial, published 2024)
- 1,612 employees took part in the Nature hybrid-work experiment, and hybrid working did not affect their performance grades over the next two years of reviews. (Nature (Bloom, Han, Liang), Hybrid working from home improves retention without damaging performance, 2021-2022 trial, published 2024)
- 395 managers in the same experiment shifted from expecting hybrid work to cut productivity by 2.6% to expecting a 1.0% gain after the trial. (Nature (Bloom, Han, Liang), Hybrid working from home improves retention without damaging performance, 2021-2022 trial, published 2024)
- 0.08 percentage points higher total factor productivity growth was associated with each 1-point rise in a US industry’s remote worker share from 2019 to 2021, BLS researchers found. (U.S. Bureau of Labor Statistics (Pabilonia, Redmond), The rise in remote work since the pandemic and its impact on productivity (Beyond the Numbers, vol. 13, no. 8), 2019-2021, published 2024)
- 44 of 61 detailed US industries had more than 10 percent of their workforce working remotely in 2021, according to the BLS productivity study. (U.S. Bureau of Labor Statistics (Pabilonia, Redmond), The rise in remote work since the pandemic and its impact on productivity (Beyond the Numbers, vol. 13, no. 8), 2021)
- 12 percent fewer calls per hour were answered by remote workers than on-site workers before COVID-19 in a Fortune 500 firm’s US call centers (2023 study). (Federal Reserve Bank of New York (Emanuel, Harrington), Working Remotely? Selection, Treatment, and the Market for Remote Work (Staff Report 1061), Pre-2020, published 2023)
- 4 percent drop in productivity hit formerly on-site call-center workers when offices closed for COVID-19, relative to already-remote colleagues, a 2023 New York Fed study found. (Federal Reserve Bank of New York (Emanuel, Harrington), Working Remotely? Selection, Treatment, and the Market for Remote Work (Staff Report 1061), 2020, published 2023)
- 18% lower productivity was measured for data entry workers in India randomly assigned to work from home versus the office, in a 2023 NBER field experiment. (National Bureau of Economic Research (Atkin, Schoar, Shinde), Working from Home, Worker Sorting and Development (NBER Working Paper 31515), 2023)
- 8-19% fall in productivity was found among more than 10,000 skilled professionals at a large Asian IT services company during pandemic work from home (2021 study). (Becker Friedman Institute, University of Chicago (Gibbs, Mengel, Siemroth), Work from Home & Productivity: Evidence from Personnel & Analytics Data on IT Professionals (BFI Working Paper 2021-56), Pandemic WFH period, published 2021)
- 3.5% lower output per hour, including commute time, would result from returning to pre-pandemic work arrangements, according to a calibrated model by SWAA researchers. (National Bureau of Economic Research (Barrero, Bloom, Davis), Why Working from Home Will Stick (NBER Working Paper 28731), Revised October 2026)
- 87% of knowledge workers said they are productive at work in a 2022 Microsoft survey of 20,006 people across 11 countries. (Microsoft WorkLab, Hybrid Work Is Just Work. Are We Doing It Wrong? (Work Trend Index), July-August 2022)
- 12% of leaders said they had full confidence their team is productive in the same 2022 Microsoft survey, a gap Microsoft called productivity paranoia. (Microsoft WorkLab, Hybrid Work Is Just Work. Are We Doing It Wrong? (Work Trend Index), July-August 2022)
- 13% performance increase came from home working in a randomized call-center experiment at Ctrip, published in 2015, mostly from working more minutes per shift. (The Quarterly Journal of Economics (Bloom, Liang, Roberts, Ying), Does Working from Home Work? Evidence from a Chinese Experiment, Published 2014 (QJE 2015))
| Study (publisher, year) | Setting | Sample | Measured effect |
|---|---|---|---|
| Bloom, Han, Liang (Nature, 2024) | Hybrid RCT, two home days a week, tech company in China | 1,612 employees | No effect on performance grades; quit rates down one-third |
| Emanuel, Harrington (New York Fed, 2023) | Fortune 500 call centers, US | Remote and on-site workers in the same jobs | Formerly on-site workers’ productivity fell 4% when sent home |
| Atkin, Schoar, Shinde (NBER, 2023) | Data entry RCT in India, home vs office | Randomly assigned workers | Productivity 18% lower at home |
| Gibbs, Mengel, Siemroth (BFI, 2021) | Large Asian IT services company, pandemic WFH | More than 10,000 skilled professionals | Productivity fell 8-19% |
| Pabilonia, Redmond (BLS, 2024) | 61 US industries, 2019-2021 | Industry-level data | +0.08 pp TFP growth per 1-point rise in remote share |
| Bloom, Liang, Roberts, Ying (QJE, 2015) | Call-center RCT at Ctrip, China, nine months | Volunteers at a 16,000-employee firm | Performance up 13% |
Remote Job Statistics: Remote and Hybrid Job Postings Share
Job posting data shows what employers advertise, and a much smaller share of postings mention remote work than the share of workers who telework. Indeed tracks postings with remote or hybrid terms in the seven countries shown here, and Robert Half classifies US postings by arrangement.
- 8.6% of US job postings on Indeed mentioned remote or hybrid work terms at the end of September 2026. (Indeed Hiring Lab, Remote Tracker: share of job postings with remote/hybrid terms (remote_postings.csv), 30 September 2026)
- 2.9% of US Indeed job postings mentioned remote or hybrid work on 1 January 2020, before the pandemic. (Indeed Hiring Lab, Remote Tracker: share of job postings with remote/hybrid terms (remote_postings.csv), January 2020)
- 10.5% was the peak share of US Indeed postings mentioning remote or hybrid work, reached in late February 2022. (Indeed Hiring Lab, Remote Tracker: share of job postings with remote/hybrid terms (remote_postings.csv), 26 February 2022)
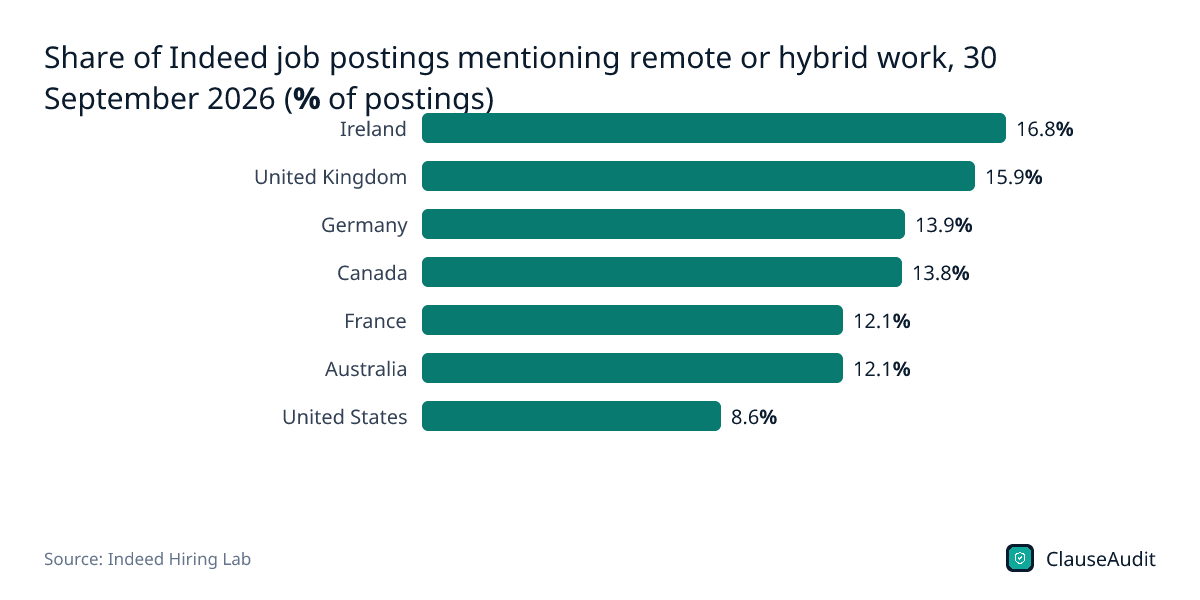
- 16.8% of job postings on Indeed in Ireland mentioned remote or hybrid work, the highest of the seven countries tracked. (Indeed Hiring Lab, Remote Tracker: share of job postings with remote/hybrid terms (remote_postings.csv), 30 September 2026)
- 15.9% of UK job postings on Indeed mentioned remote or hybrid work, nearly double the US share. (Indeed Hiring Lab, Remote Tracker: share of job postings with remote/hybrid terms (remote_postings.csv), 30 September 2026)
- 7.9% of US job searches on Indeed were for remote or hybrid work at the end of September 2026. (Indeed Hiring Lab, Remote Tracker: share of job searches for remote/hybrid work (remote_searches.csv), 30 September 2026)
- 87% of US job postings analyzed by Robert Half were fully on-site in Q2 2026, with 10% hybrid and 3% fully remote. (Robert Half, Remote work statistics and trends, Q2 2026)
- 65% of US postings in Robert Half's analysis were fully in-office in Q4 2025, before rising to 87% by Q2 2026. (Robert Half, Remote work statistics and trends, Q4 2025 to Q2 2026)
- 11% of US technology job postings were hybrid in Q2 2026, with 4% remote and 85% fully on-site. (Robert Half, Remote work statistics and trends, Q2 2026)
- 12% of senior-level US postings (5+ years' experience) were hybrid and 4% remote, versus 8% and 2% for entry-level roles. (Robert Half, Remote work statistics and trends, Q2 2026)
- 39% of US professionals job hunting in the second half of 2026 say more remote flexibility is a primary motivation. (Robert Half, Remote work statistics and trends, H2 2026)
- 9.1% of job postings on Indeed in India explicitly mentioned work from home or remote work in October 2025, up from 7.6% a year earlier. (Indeed Hiring Lab, October 2025 IN Labour Market Update: The Latest Remote Work Trends, October 2025)
- 18.2% of IT infrastructure, operations and support postings in India offered remote work, the highest of any occupation on Indeed India. (Indeed Hiring Lab, October 2025 IN Labour Market Update: The Latest Remote Work Trends, October quarter 2025)
Figure 6: Share of Indeed job postings mentioning remote or hybrid work, 30 September 2026 (% of postings)
Chart data
| Label | Value |
|---|---|
| Ireland | 16.8% |
| United Kingdom | 15.9% |
| Germany | 13.9% |
| Canada | 13.8% |
| France | 12.1% |
| Australia | 12.1% |
| United States | 8.6% |
Remote Work Demographics: Who Works From Home by Industry, Education and Income
Remote work is concentrated among college graduates and in information, finance and professional jobs. Roughly 60% of US workers have jobs that cannot be done from home, according to Pew.
- 37.8% of US workers aged 25+ with a bachelor's degree or higher teleworked in September 2026, versus 8.3% of high school graduates with no college. (U.S. Bureau of Labor Statistics (Current Population Survey), Table A-41. People at work by telework status and selected characteristics, September 2026, September 2026)
- 4.4% of US workers without a high school diploma teleworked in September 2026, the lowest rate of any education group. (U.S. Bureau of Labor Statistics (Current Population Survey), Table A-41. People at work by telework status and selected characteristics, September 2026, September 2026)
- 23.9% of women at work teleworked in September 2026, compared with 20.1% of men. (U.S. Bureau of Labor Statistics (Current Population Survey), Table A-41. People at work by telework status and selected characteristics, September 2026, September 2026)
- 5.7% of workers aged 16 to 24 teleworked in September 2026, compared with 26.2% of workers aged 35 to 44 and 45 to 54. (U.S. Bureau of Labor Statistics (Current Population Survey), Table A-41. People at work by telework status and selected characteristics, September 2026, September 2026)
- 63.7% of workers in computer and mathematical occupations teleworked in September 2026, the highest rate among major occupation groups. (U.S. Bureau of Labor Statistics (Current Population Survey), Table A-42. People at work by telework status, usual full- or part-time status, occupation, industry, and class of worker, September 2026, September 2026)
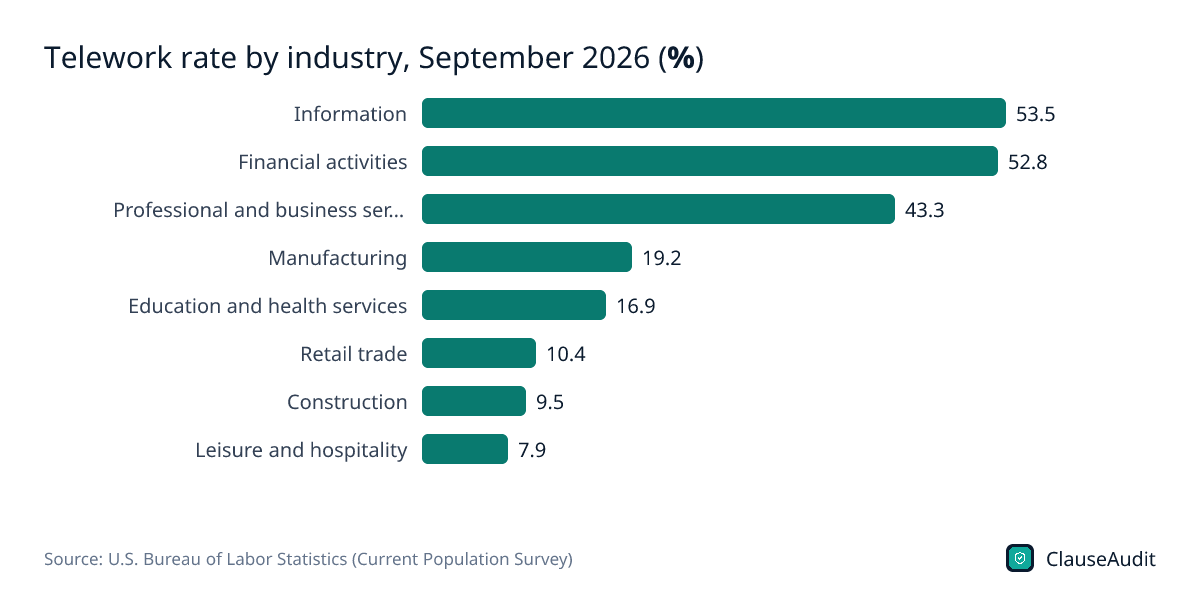
- 52.8% of workers in financial activities teleworked in September 2026, close to the 53.5% rate in the information industry. (U.S. Bureau of Labor Statistics (Current Population Survey), Table A-42. People at work by telework status, usual full- or part-time status, occupation, industry, and class of worker, September 2026, September 2026)
- 36.9% of self-employed workers teleworked in September 2026, compared with 21.0% of private-industry wage and salary workers. (U.S. Bureau of Labor Statistics (Current Population Survey), Table A-42. People at work by telework status, usual full- or part-time status, occupation, industry, and class of worker, September 2026, September 2026)
- 23% of US workers with at least a bachelor's degree worked entirely from home in 2025, compared with 10% of those with a high school degree or less. (Board of Governors of the Federal Reserve System, Economic Well-Being of U.S. Households in 2025, October 2025)
- 30% of self-employed US workers worked entirely from home in 2025, per the Federal Reserve's household survey. (Board of Governors of the Federal Reserve System, Economic Well-Being of U.S. Households in 2025, October 2025)
- 51% of employed people aged 25+ with a bachelor's degree or higher did some work at home on days worked in 2025, versus 19% with only a high school diploma. (U.S. Bureau of Labor Statistics, American Time Use Survey: 2025 Results (USDL-26-1022), 2025)
- Roughly 60% of US workers do not have jobs that can be done from home, according to a Pew Research Center report published February 2025. (Pew Research Center, How COVID-19 changed U.S. workplaces (5 Years Later: America Looks Back at the Impact of COVID-19), Published February 2025)
- 20% or more of workers in Colorado, the District of Columbia and Washington worked from home in 2022, versus about 8% or less in Mississippi and North Dakota. (U.S. Census Bureau, Commuting in the United States: 2022 (ACSBR-018), 2022)
- 37% of US jobs could be performed entirely at home, according to a widely cited 2020 NBER estimate; those jobs accounted for 46% of US wages. (National Bureau of Economic Research, How Many Jobs Can be Done at Home? (NBER Working Paper 26948), 2020)
Figure 7: Telework rate by industry, September 2026 (%)
Chart data
| Label | Value |
|---|---|
| Information | 53.5 |
| Financial activities | 52.8 |
| Professional and business services | 43.3 |
| Manufacturing | 19.2 |
| Education and health services | 16.9 |
| Retail trade | 10.4 |
| Construction | 9.5 |
| Leisure and hospitality | 7.9 |
Remote Work Salary and Cost Savings Statistics
Economists estimate the value of remote work by how much pay workers will give up for it. These figures also cover the commute time and daily costs saved by working from home.
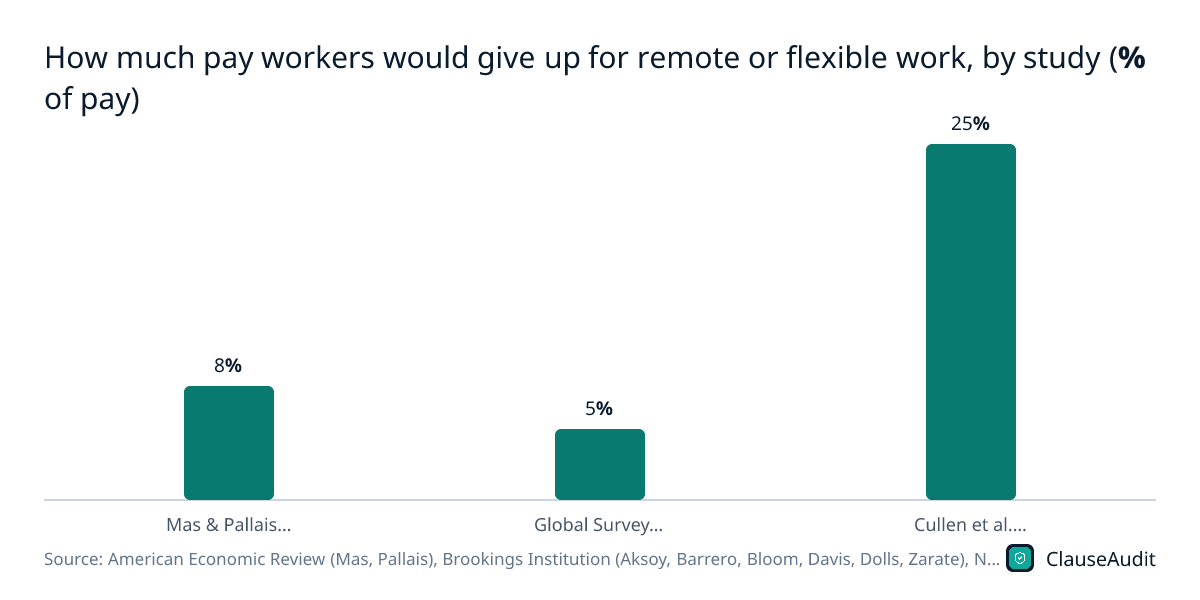
- 25% pay cut is what US tech workers were willing to accept, on average, for partly or fully remote roles, in a 2025 revealed-preference study. (National Bureau of Economic Research (Cullen, Pakzad-Hurson, Perez-Truglia), Home Sweet Home: How Much Do Employees Value Remote Work? (NBER Working Paper 33383), January 2025)
- 5 percent of pay is how much employees across 27 countries valued the option to work from home two or three days a week, on average, in 2021-2022 surveys. (Brookings Institution (Aksoy, Barrero, Bloom, Davis, Dolls, Zarate), Working from Home Around the World (Brookings Papers on Economic Activity), 2021-2022)
- 8 percent of wages is what call-center job applicants were willing to give up for the option to work from home, in a 2017 field experiment. (American Economic Review (Mas, Pallais), Valuing Alternative Work Arrangements, 2017)
- 47% of US workers would take a pay cut of 10% or more for flexible working hours, and more than one in four would accept 15% or more (Owl Labs 2026). (Owl Labs, State of Hybrid Work 2026 (US Report, 10th edition), 2026 edition)
- $53 a day is what US hybrid workers say they spend on an office day, a $2 decrease from $55 in 2025. (Owl Labs, State of Hybrid Work 2026 (US Report, 10th edition), 2026 edition)
- $33 a day is the estimated saving for a US hybrid worker on a day worked at home instead of the office, per Owl Labs’ 2026 cost breakdown. (Owl Labs, State of Hybrid Work 2026 (US Report, 10th edition), 2026 edition)
- 72 minutes is the average daily commute time saved when working from home, across workers in 27 countries (2023 study). (American Economic Association (Aksoy, Barrero, Bloom, Davis, Dolls, Zarate), Time Savings When Working from Home (AEA Papers and Proceedings, vol. 113), 2021-2022 data, published 2023)
- 40 percent of the commute time saved by working from home goes to their jobs, and about 11 percent to caregiving, per the same 2023 27-country study. (American Economic Association (Aksoy, Barrero, Bloom, Davis, Dolls, Zarate), Time Savings When Working from Home (AEA Papers and Proceedings, vol. 113), 2021-2022 data, published 2023)
- 56 minutes is the average commute time saved on a day worked from home in Great Britain, according to the ONS Time Use Survey. (Office for National Statistics (UK), Who are the hybrid workers?, March 2024)
- 2.6% lower average worker welfare would follow a return to pre-pandemic work arrangements in the US, according to the SWAA researchers’ calibrated model. (National Bureau of Economic Research (Barrero, Bloom, Davis), Why Working from Home Will Stick (NBER Working Paper 28731), Revised October 2026)
- Up to 58% of work’s carbon footprint in the US can be cut by switching from onsite work to working from home, according to a 2023 PNAS study. (Proceedings of the National Academy of Sciences (Tao et al.), via PubMed Central, Climate mitigation potentials of teleworking are sensitive to changes in lifestyle and workplace rather than ICT usage, 2023)
- 60 percent of employees across 34 countries named no commute as the top benefit of working from home in the 2023 Global Survey of Working Arrangements. (WFH Research / ifo Institute (Aksoy, Barrero, Bloom, Davis, Dolls, Zarate), Working from Home Around the Globe: 2023 Report, April-May 2023)
- 44 percent of employees across 34 countries cited savings on gas and lunch costs as a top benefit of working from home in the 2023 survey. (WFH Research / ifo Institute (Aksoy, Barrero, Bloom, Davis, Dolls, Zarate), Working from Home Around the Globe: 2023 Report, April-May 2023)
- 2.0 percentage points of cumulative US wage-growth moderation over two years was linked to the rise of remote work in a 2022 Atlanta Fed working paper. (Federal Reserve Bank of Atlanta, The Shift to Remote Work Lessens Wage-Growth Pressures, Working Paper 2022-7, 2022)
Figure 8: How much pay workers would give up for remote or flexible work, by study (% of pay)
Chart data
| Label | Value (% of pay) |
|---|---|
| Mas & Pallais field experiment (2017) | 8% |
| Global Survey of Working Arrangements, 27 countries (2022) | 5% |
| Cullen et al., US tech job offers (2025) | 25% |
Remote Work and Office Vacancy Statistics
Office demand shows how remote work has changed where people work. Vacancy rates differ by source because each firm uses its own building inventory and method.
- 19.8% was the US national office vacancy rate in Q3 2026, down 30 basis points year over year. (Cushman & Wakefield, U.S. Office MarketBeat Reports, Q3 2026, Q3 2026)
- 15.5 million sq ft of US office space was absorbed over the year to Q3 2026, though Q3 itself was barely positive at +50,000 sq ft. (Cushman & Wakefield, U.S. Office MarketBeat Reports, Q3 2026, Q4 2025 to Q3 2026)
- 17.8% was the US national office vacancy rate in August 2026 by CommercialEdge's measure, down 90 basis points year over year. (CommercialEdge, National Office Report (September 2026), August 2026)
- $33.20 per square foot was the average US office listing rate in August 2026. (CommercialEdge, National Office Report (September 2026), August 2026)
- 9.6 million sq ft of US office space was removed from inventory in Q3 2026, driving another net decline in total office stock. (JLL, U.S. Office Market Dynamics, Q3 2026, Q3 2026)
- 6.4% growth in US office leasing volume over the 12 months to Q3 2026, with gateway markets up 13%. (JLL, U.S. Office Market Dynamics, Q3 2026, Q3 2026)
- 55.4% was average weekly office occupancy across major US cities, measured by badge swipes against a February 2020 baseline. (Kastle Systems, Kastle Back to Work Barometer, Week ending 30 September 2026)
- 65.5% was peak-day US office occupancy on Tuesday, the busiest day of the week, versus the pre-pandemic baseline. (Kastle Systems, Kastle Back to Work Barometer, 29 September 2026)
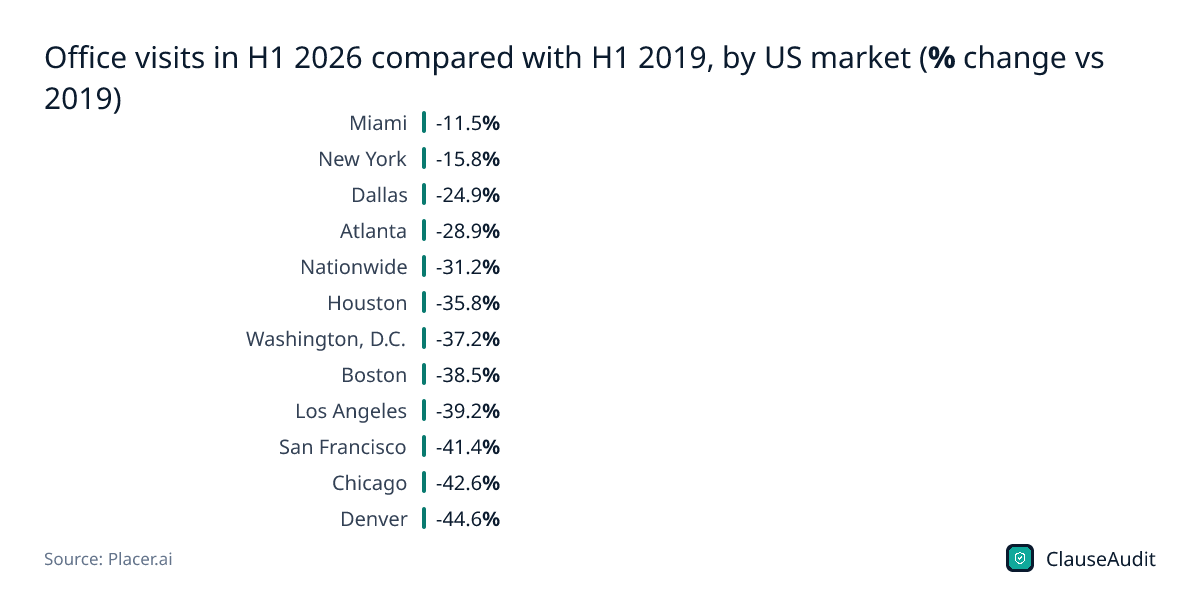
- 31.2% fewer office visits were recorded nationwide in H1 2026 than in H1 2019, based on Placer.ai foot-traffic data. (Placer.ai, 2026 Office Recovery Trends Across Major U.S. Markets, H1 2026)
- 41.4% below 2019 levels: San Francisco office visits in H1 2026, compared with New York at 15.8% below. (Placer.ai, 2026 Office Recovery Trends Across Major U.S. Markets, H1 2026)
- 12.3% was the US prime office vacancy rate in Q2 2026, well below the 18.3% overall rate as tenants favour top-quality buildings. (CBRE, U.S. Office Market Report Q2 2026: Top-Quality Space Leads Broadening Office Market Recovery, Q2 2026)
- 46 percent decline in the long-run value of New York City office buildings is attributed to remote work in a 2026 American Economic Review study. (American Economic Association, Work from Home and the Office Real Estate Apocalypse (Gupta, Mittal and Van Nieuwerburgh), American Economic Review 116(2): 674-709, Published February 2026)
- $556.8 billion of office value destruction across all US office markets combined is estimated in the same American Economic Review study of remote work. (American Economic Association, Work from Home and the Office Real Estate Apocalypse (Gupta, Mittal and Van Nieuwerburgh), American Economic Review 116(2): 674-709, Published February 2026)
Figure 9: Office visits in H1 2026 compared with H1 2019, by US market (% change vs 2019)
Chart data
| Label | Value |
|---|---|
| Miami | -11.5% |
| New York | -15.8% |
| Dallas | -24.9% |
| Atlanta | -28.9% |
| Nationwide | -31.2% |
| Houston | -35.8% |
| Washington, D.C. | -37.2% |
| Boston | -38.5% |
| Los Angeles | -39.2% |
| San Francisco | -41.4% |
| Chicago | -42.6% |
| Denver | -44.6% |
Remote Work Burnout, Engagement and Cybersecurity Statistics
Remote workers report higher engagement but not always better wellbeing. This section also covers longer workdays and the security risk of personal devices used for work.
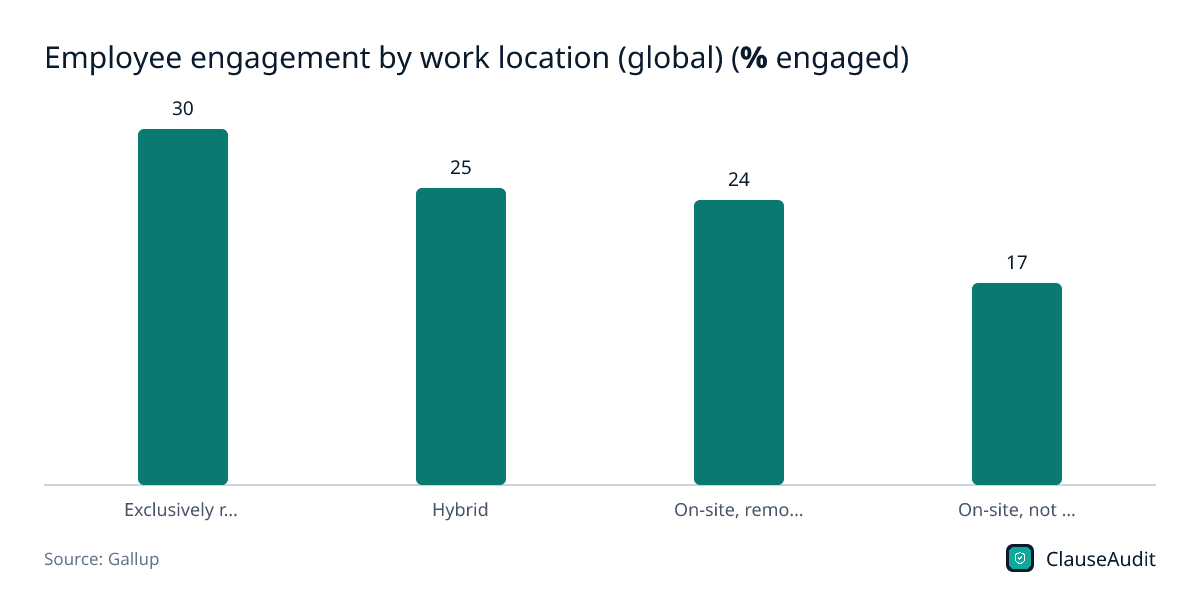
- 30% of exclusively remote employees worldwide were engaged at work in 2025, the highest of any work arrangement in Gallup’s global data. (Gallup, State of the Global Workplace 2026: Global Data Summary, 2025 data (2026 report))
- 25% of hybrid employees worldwide were engaged at work in 2025, versus 24% of on-site remote-capable and 17% of on-site non-remote-capable workers. (Gallup, State of the Global Workplace 2026: Global Data Summary, 2025 data (2026 report))
- 33% of exclusively remote employees were thriving in their overall lives in 2025, compared with 45% of hybrid workers, despite higher engagement. (Gallup, State of the Global Workplace 2026: Global Data Summary, 2025 data (2026 report))
- 41% of exclusively remote employees reported a lot of daily stress in 2025, below hybrid and on-site remote-capable workers (46% each) but above on-site non-remote-capable (39%). (Gallup, State of the Global Workplace 2026: Global Data Summary, 2025 data (2026 report))
- 20% of employees worldwide were engaged at work in 2025, down from a 2022 peak of 23%, based on 263,810 respondents. (Gallup, State of the Global Workplace: 2026 Report, 2025)
- 22% of managers worldwide were engaged in 2025, a five-point drop from 27% in 2024, according to Gallup's global workplace data. (Gallup, State of the Global Workplace: 2026 Report, 2025)
- 16% year-over-year increase in Microsoft 365 meetings starting after 8 p.m., a sign of the stretched workday in distributed teams. (Microsoft WorkLab, Breaking down the infinite workday (Work Trend Index), Year to February 2025)
- 46% of infostealer-compromised systems holding corporate logins were non-managed devices, likely personal or BYOD machines, in Verizon’s 2025 Data Breach Investigations Report (a 2026 edition has since been released). (Verizon Business, 2025 Data Breach Investigations Report, 2025 report)
- 275 interruptions a day from meetings, emails or chats hit the most-pinged 20% of Microsoft 365 users, about one every two minutes in core hours. (Microsoft WorkLab, Breaking down the infinite workday (Work Trend Index), Year to February 2025)
- 73% of US workers who work from home at least sometimes say their arrangement has helped them balance work and personal life (Pew, February 2025). (Pew Research Center, How COVID-19 changed U.S. workplaces (5 Years Later: America Looks Back at the Impact of COVID-19), Published February 2025)
- 49% of US workers who work from home at least sometimes say it has made it harder to feel connected with co-workers (Pew, February 2025). (Pew Research Center, How COVID-19 changed U.S. workplaces (5 Years Later: America Looks Back at the Impact of COVID-19), Published February 2025)
- 36% of US workers say their work-related stress has increased since last year, while 53% say it has stayed the same (Owl Labs 2026). (Owl Labs, State of Hybrid Work 2026 (US Report, 10th edition), 2026 edition)
- 36% of UK businesses used a virtual private network for staff connecting remotely in 2025/26, up from 31% the year before, still one of the less common cyber controls. (UK Department for Science, Innovation and Technology (GOV.UK), Cyber security breaches survey 2025/2026, 2025/2026 survey)
- 91 percent of 3,000 remote workers in Buffer's 2023 survey reported a positive experience with remote work; just 1% said it was negative. (Buffer, State of Remote Work 2023 (3,000 remote workers), Surveyed Oct-Nov 2022, published 2023)
Figure 10: Employee engagement by work location (global) (% engaged)
Chart data
| Label | Value (% engaged) |
|---|---|
| Exclusively remote | 30 |
| Hybrid | 25 |
| On-site, remote-capable | 24 |
| On-site, not remote-capable | 17 |
Global Remote Work Statistics: Europe, India and Other Countries
Countries measure home working in different ways, so compare shares with care. These figures come from Eurostat, the ONS, the Australian Bureau of Statistics, Destatis, ADP Research, Indeed, LinkedIn and the Global Survey of Working Arrangements.
- 8.8% of employed people aged 15 to 64 in the EU usually worked from home in 2025, up from 5.4% in 2019. (Eurostat, Employed persons working from home by professional status - % of total employment (lfsa_ehomp), EU-27 time series, 2025)
- 14.2% of employed people aged 15 to 64 in the EU sometimes worked from home in 2025, up from 9.0% in 2019. (Eurostat, Employed persons working from home by professional status - % of total employment (lfsa_ehomp), EU-27 time series, 2025)
- 41.0% of employed people in the Netherlands sometimes worked from home in 2025, with another 11.3% usually doing so, the highest combined share in the EU. (Eurostat, Employed persons working from home by professional status - % of total employment (lfsa_ehomp), by country, 2025)
- 20.5% of employed people in Finland usually worked from home in 2025, versus 2.7% in Italy and 1.3% in Romania, according to Eurostat. (Eurostat, Employed persons working from home by professional status - % of total employment (lfsa_ehomp), by country, 2025)
- 35% of working parents in Great Britain worked hybrid in April to June 2024, compared with 24% of working non-parents. (Office for National Statistics (UK), Who are the hybrid workers?, April-June 2024)
- 59% of Australian managers and professionals usually worked from home in August 2025, compared with 21% across all other occupations. (Australian Bureau of Statistics, Working Arrangements, August 2025, August 2025)
- 42% of Australians who worked from home also worked overtime in August 2025, compared with 26% of those who did not work from home. (Australian Bureau of Statistics, Working Arrangements, August 2025, August 2025)
- 53.4% of solo self-employed people in Germany worked from home in 2023, the highest share of any group, versus 23.5% of all employed persons. (Federal Statistical Office of Germany (Destatis), Quality of employment: Working from home, 2023)
- 36% of employees in India work in hybrid mode, while 50% work on-site daily and only 14% work remotely, per ADP Research’s People at Work 2025. (ADP India, India Workforce Engagement Plummets to 19% in 2025, Defying Global Trends: ADP Research (People at Work 2025), 2025 report)
- 45% of employees in India report full autonomy over their work location, among the highest globally and second only to Egypt at 47%. (ADP India, India Workforce Engagement Plummets to 19% in 2025, Defying Global Trends: ADP Research (People at Work 2025), 2025 report)
- 20.3% of India’s LinkedIn job postings were hybrid and 10.0% were remote in July 2024, versus 13.4% hybrid and 8.5% remote in the US. (LinkedIn Economic Graph Research Institute, Global State of Remote and Hybrid Work, July 2024)
- 1.27 days per week is the average work from home among college-educated full-time employees across 22 countries in late 2024 and early 2025, down from 1.6 in 2022. (Hoover Institution, Stanford University (Aksoy, Barrero, Bloom, Davis, Dolls, Zarate), The Global Persistence of Work from Home (Economics Working Paper 25108), Nov 2024 to Feb 2025)
- 1.5 to 2 days a week of work from home is typical in English-speaking countries, versus 0.5 to 1 day in Asian countries, in the 40-country Global Survey of Working Arrangements. (Stanford Institute for Economic Policy Research (Aksoy, Barrero, Bloom, Davis, Dolls, Zarate), Working from Home in 2025: Five Key Facts, Nov 2024 to Feb 2025)
- 28% of working adults in Great Britain worked hybrid (home plus travelling to work) and 16% worked from home only, September 2022 to January 2023. (Office for National Statistics, Characteristics of homeworkers, Great Britain: September 2022 to January 2023, Sep 2022 to Jan 2023)
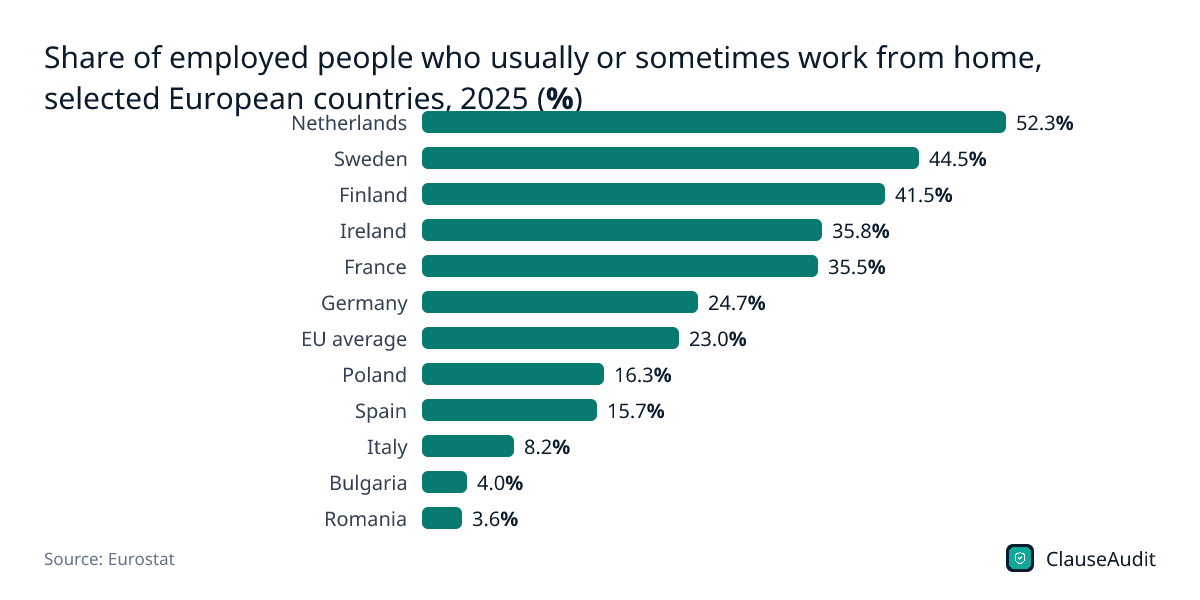
Figure 11: Share of employed people who usually or sometimes work from home, selected European countries, 2025 (%)
Chart data
| Label | Value |
|---|---|
| Netherlands | 52.3% |
| Sweden | 44.5% |
| Finland | 41.5% |
| Ireland | 35.8% |
| France | 35.5% |
| Germany | 24.7% |
| EU average | 23.0% |
| Poland | 16.3% |
| Spain | 15.7% |
| Italy | 8.2% |
| Bulgaria | 4.0% |
| Romania | 3.6% |
Remote Work Policy, Contract and Legal Statistics
This section covers federal telework eligibility, independent contractor counts and classification rules, rules on flexible working and disconnecting from work in Ontario, the EU and the UK, and India's hybrid work rule for SEZ units.
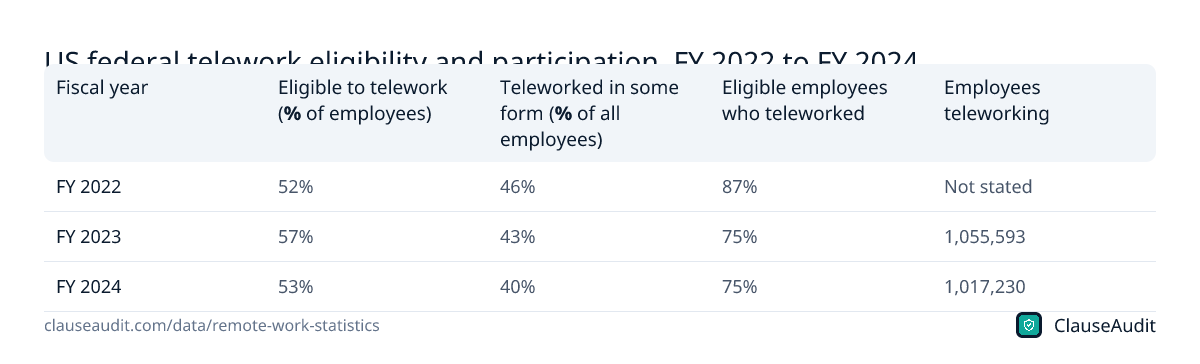
- 53% of federal employees in reporting agencies (1,349,440 people) were eligible to telework in FY 2024, down from 57% in FY 2023. (U.S. Office of Personnel Management, Telework in the Federal Government Report to Congress, Fiscal Year 2024, FY 2024)
- 40% of all federal employees in reporting agencies (1,017,230 people) teleworked in some form in FY 2024. (U.S. Office of Personnel Management, Telework in the Federal Government Report to Congress, Fiscal Year 2024, FY 2024)
- 75% of telework-eligible federal employees actually teleworked in some form in FY 2024. (U.S. Office of Personnel Management, Telework in the Federal Government Report to Congress, Fiscal Year 2024, FY 2024)
- 186,397 federal workers, about 7% of the federal workforce, were fully remote under remote work agreements in FY 2023. (U.S. Office of Personnel Management, Status of Telework in the Federal Government Report to Congress, Fiscal Year 2023, FY 2023)
- 51% of responding federal agencies said in FY 2023 that candidates cited their telework and remote work policy as key to applying or accepting a job. (U.S. Office of Personnel Management, Status of Telework in the Federal Government Report to Congress, Fiscal Year 2023, FY 2023)
- 11.9 million Americans, 7.4% of total employment, were independent contractors in their main job in July 2023, up from 6.9% in 2017. (U.S. Bureau of Labor Statistics, Contingent and Alternative Employment Arrangements, July 2023, July 2023)
- 74.9 million Americans earned income independently in 2026, a record high, according to MBO Partners' State of Independence research. (MBO Partners, State of Independence 2026, 2026)
- All employees of an Indian SEZ unit could be covered by hybrid work under the November 2023 Rule 43A (IT/ITeS staff, plus travelling, offsite or temporarily incapacitated staff), with permission running up to 31 December 2024. (Ministry of Commerce and Industry, Government of India, Special Economic Zones (Fourth Amendment) Rules, 2023: substituted Rule 43A (Hybrid working), G.S.R. 824(E), November 2023 rule, valid to 31 December 2024)
- 25 or more employees on 1 January triggers Ontario's legal duty to have a written policy on disconnecting from work, due before 1 March. (Government of Ontario, Your guide to the Employment Standards Act: Written policy on disconnecting from work, Current rule (since 2022))
- March 11, 2024 is when the US Labor Department's independent contractor classification rule took effect; a new proposal to replace it followed in February 2026. (U.S. Department of Labor, Wage and Hour Division, Employee or Independent Contractor Classification rulemaking, 2024 to 2026)
- 472 MEPs voted in January 2021 for an EU law on the right to disconnect, with 126 against and 83 abstentions. (European Parliament, Right to disconnect should be an EU-wide fundamental right, MEPs say, January 2021)
- 24.8 million US independent contractors, counting secondary jobs, is the Labor Department's estimate in its February 2026 proposed classification rule, versus 11.9 million in main jobs. (U.S. Department of Labor, Wage and Hour Division (Federal Register via GovInfo), Employee or Independent Contractor Status Under the FLSA, FMLA and MSPA (Notice of Proposed Rulemaking, 91 FR 9932), 2023 data, proposed rule February 2026)
- 35.5 million new independent contractor relationships a year would be assessed under the Labor Department's proposed 2026 classification test, based on 1.43 jobs per contractor. (U.S. Department of Labor, Wage and Hour Division (Federal Register via GovInfo), Employee or Independent Contractor Status Under the FLSA, FMLA and MSPA (Notice of Proposed Rulemaking, 91 FR 9932), Proposed rule February 2026)
- 2 applications for flexible working, including remote work, can be made by UK employees in any 12-month period; employers must decide within 2 months. (GOV.UK, Flexible working: Applying for flexible working, Current rule (2026))
| Fiscal year | Eligible to telework (% of employees) | Teleworked in some form (% of all employees) | Eligible employees who teleworked | Employees teleworking |
|---|---|---|---|---|
| FY 2022 | 52% | 46% | 87% | Not stated |
| FY 2023 | 57% | 43% | 75% | 1,055,593 |
| FY 2024 | 53% | 40% | 75% | 1,017,230 |
What the numbers mean for workers
Remote work has settled at a steady level rather than fading. The BLS telework rate stayed between 21.5% and 23.7% every month from January 2025 to September 2026, and 10.7% of workers teleworked all of their hours in September 2026. About 26% of paid full workdays were worked from home that month, and SWAA researchers estimate work from home has stabilized at about 3.5 times its 2019 level.
Remote jobs are harder to find than remote workers. Only 8.6% of US Indeed postings mentioned remote or hybrid work at the end of September 2026, and 87% of postings in Robert Half's Q2 2026 analysis were fully on-site. Competition follows: in a 2025 GAO report, remote federal job announcements drew 366 applications on average, against 51 for similar non-remote positions. Workers also put a price on flexibility. US tech workers accepted a 25% pay cut on average for partly or fully remote roles in a 2025 study, so remote status is worth negotiating as part of the pay package, not as a side detail.
Office mandates are rising faster than attendance
Employers have tightened policy. 34% of US firms required full-time office attendance in Q3 2025, and the average requirement rose to 2.87 days a week from 2.57 days in Q1 2024. Among Fortune 100 companies, 45% required four or five office days in Q3 2025. Attendance has not kept pace. Required office time rose 12% since early 2024 while actual attendance rose only 1% to 3%, and 40% of US hybrid workers still go in for a few hours just to show their face, according to Owl Labs' 2026 report.
For businesses, the retention data is the strongest case for clear hybrid terms. In a randomized trial of 1,612 employees published in Nature, two home days a week cut quits by one-third with no effect on performance grades. Results for fully remote work are mixed: a New York Fed study found a 4 percent productivity drop for call-center workers sent home, and an NBER experiment measured 18% lower productivity for data entry workers in India at home. An earlier call-center trial at Ctrip found a 13% performance gain from home working. The type of work and how it is managed matter more than the label.
What to do with this data
- Get your work location in writing. 75% of US workers with teleworkable jobs who are not fully remote said in October 2024 that their employer requires in-person days, up from 63% in early 2023, according to Pew, so an informal arrangement can change quickly.
- Look for a clause that lets the employer change your location or schedule at its discretion, and ask for advance notice and a defined outcome, such as severance, if it does.
- Check which state's law applies. More than 45 percent of workers in professional and business services or information lived in a different metro area from their manager by February 2026, and non-compete, wage and leave rules can depend on where you actually work.
- Ask who pays for equipment, internet and travel to the office, and put the answer in the contract or a written policy.
- Read monitoring and after-hours terms. Microsoft recorded a 16% year-over-year rise in meetings starting after 8 p.m. in the year to February 2025, and Ontario requires employers with 25 or more employees to have a written policy on disconnecting from work.
- Employers should write down how office days are set. Only 11% of US employees were on teams that set their hybrid policy together in May 2025, and those teams are the most likely to call their policy fair.
Check the remote work terms in your employment contract
Remote arrangements often sit in an offer letter, a handbook policy or an email, and many contracts let the employer change them later. An automated review of your employment contract flags the clauses that decide where you work, who pays for it and what happens if the policy changes, and explains each one in plain English with a suggested change to ask for.
- Stated work location, and whether the role is remote, hybrid or on-site
- Clauses that let the employer change your location, schedule or duties
- Required office days, travel and relocation obligations
- Equipment, internet and home office expense reimbursement
- Monitoring, device and data security requirements
- Working hours, availability and after-hours contact
- Governing law and which state's rules apply when you work across state lines
- Non-compete, non-solicitation and notice period terms
Frequently asked questions
How many people work remotely in the US?
In September 2026, 21.9% of US workers at work teleworked for some or all of their hours, and 10.7% teleworked all of their hours, according to the Bureau of Labor Statistics Current Population Survey.
Is remote work declining in 2026?
Not by the official measure. The BLS monthly telework rate stayed between 21.5% and 23.7% from January 2025 to September 2026. The share of paid full workdays done at home was about 26% in September 2026, far below the 61.68% peak of May 2020.
What percentage of companies require employees in the office full time?
34% of US firms required full-time office attendance in Q3 2025, according to the Flex Index, and the average requirement was 2.87 days a week. Among Fortune 100 companies, 45% required four or five office days in the same quarter.
Are remote workers more productive?
It depends on the job and the setup. A Nature trial of 1,612 employees found two home days a week had no effect on performance grades and cut quits by one-third, while an NBER experiment found data entry workers in India were 18% less productive at home.
How many remote jobs are there?
8.6% of US job postings on Indeed mentioned remote or hybrid work at the end of September 2026, up from 2.9% in January 2020 but below the 10.5% peak in February 2022.
Would workers take a pay cut to work remotely?
Many would. US tech workers accepted a 25% pay cut on average for partly or fully remote roles in a 2025 NBER study, and employees across 27 countries valued two or three home days a week at 5 percent of pay in 2021-2022 surveys.
Which jobs have the most remote work?
63.7% of workers in computer and mathematical occupations teleworked in September 2026, the highest of any major occupation group. By industry, information (53.5%) and financial activities (52.8%) had the highest rates.
Use this data
Every chart and card below is free to reuse under CC BY 4.0. Download what you need and link back to this page.
 Stat cards
 Key findings card
 Infographic
 US telework rate by month, January 2025 to September 2026 (%)
 US firms by office requirement, Q3 2025 (% of firms)
 Telework rate by industry, September 2026 (%)
 Employee engagement by work location (global) (% engaged)
 Share of US paid full workdays worked from home, September of each year, 2020-2026 (%)
 How much pay workers would give up for remote or flexible work, by study (% of pay)
 Share of employed people who usually or sometimes work from home, selected European countries, 2025 (%)
 Office days required per week at US firms, Q3 2025 (% of firms)
 Share of Indeed job postings mentioning remote or hybrid work, 30 September 2026 (% of postings)
 Office visits in H1 2026 compared with H1 2019, by US market (% change vs 2019)
 What major studies measured about remote and hybrid work productivity
 US federal telework eligibility and participation, FY 2022 to FY 2024
Embed the infographic
Free to share on your site, blog or slides under CC BY 4.0. Please keep the credit link.
Sources and method
Every number on this page comes from the sources below, each opened and read on or before October 17, 2026. A second, independent review checked every figure against its source and corrected anything that did not match. Figures that could not be confirmed were left out.
- U.S. Bureau of Labor Statistics (Current Population Survey), Table A-41. People at work by telework status and selected characteristics, September 2026 (September 2026 data (not seasonally adjusted))
- U.S. Bureau of Labor Statistics (Current Population Survey), Table A-42. People at work by telework status, usual full- or part-time status, occupation, industry, and class of worker, September 2026 (September 2026 data (not seasonally adjusted))
- U.S. Bureau of Labor Statistics (Current Population Survey), Percent, Persons who teleworked (series LNU0201B46B) (Monthly data through September 2026)
- U.S. Bureau of Labor Statistics, American Time Use Survey: 2025 Results (USDL-26-1022) (June 25, 2026)
- U.S. Census Bureau, Commuting in the United States: 2022 (ACSBR-018) (February 2024)
- Board of Governors of the Federal Reserve System, Economic Well-Being of U.S. Households in 2025 (May 2026)
- Flex Index (archive hosted by the London School of Economics), Flex Report Q3 2025 (Q3 2025 edition)
- The White House, Return to In-Person Work (Presidential Memorandum) (January 20, 2025)
- U.S. Government Accountability Office, Federal Remote Work: OPM Guidance Could Help Relevant Agencies Evaluate Effects on Agency Performance (GAO-25-107363) (June 17, 2025)
- Amazon, CEO Andy Jassy's latest update on Amazon's return-to-office, manager team ratio (Undated (policy effective January 2, 2025))
- Microsoft, Microsoft flexible work update (September 9, 2025)
- Federal News Network, After returning to the office, federal employees report low productivity, morale (July 20, 2026)
- Robert Half, Remote work statistics and trends (Q2 2026 data)
- Gallup, State of the Global Workplace 2026: Global Data Summary (April 2026 (data collected January-December 2025))
- Gallup, State of the Global Workplace: 2026 Report (2026 edition (2025 data))
- Microsoft WorkLab, Breaking down the infinite workday (Work Trend Index) (June 17, 2025)
- Pew Research Center, How COVID-19 changed U.S. workplaces (5 Years Later: America Looks Back at the Impact of COVID-19) (February 12, 2025)
- Owl Labs, State of Hybrid Work 2026 (US Report, 10th edition) (2026)
- UK Department for Science, Innovation and Technology (GOV.UK), Cyber security breaches survey 2025/2026 (30 April 2026)
- National Bureau of Economic Research, How Many Jobs Can be Done at Home? (NBER Working Paper 26948) (April 2020 (revised June 2020))
- Verizon Business, 2025 Data Breach Investigations Report (2025 edition (superseded by the 2026 DBIR))
- WFH Research (Barrero, Bloom, Buckman, Davis), SWAA October 2026 Updates (5 October 2026)
- WFH Research (Barrero, Bloom, Buckman, Davis), SWAA September 2026 Updates (September 2026)
- WFH Research, SWAA monthly work from home rate time series (Data through September 2026)
- U.S. Bureau of Labor Statistics, American Time Use Survey, Table 6: Employed persons working at home and at their workplace, 2025 annual averages (June 25, 2026)
- ADP Research, Who went the distance? (Today at Work) (July 16, 2026)
- National Bureau of Economic Research (Barrero, Bloom, Davis), Why Working from Home Will Stick (NBER Working Paper 28731) (April 2021, revised October 2026)
- Stanford Institute for Economic Policy Research (Aksoy, Barrero, Bloom, Davis, Dolls, Zarate), Working from Home in 2025: Five Key Facts (April 14, 2025)
- Nature (Bloom, Han, Liang), Hybrid working from home improves retention without damaging performance (June 12, 2024)
- U.S. Bureau of Labor Statistics (Pabilonia, Redmond), The rise in remote work since the pandemic and its impact on productivity (Beyond the Numbers, vol. 13, no. 8) (October 31, 2024)
- Federal Reserve Bank of New York (Emanuel, Harrington), Working Remotely? Selection, Treatment, and the Market for Remote Work (Staff Report 1061) (May 2023)
- National Bureau of Economic Research (Atkin, Schoar, Shinde), Working from Home, Worker Sorting and Development (NBER Working Paper 31515) (July 2023, revised December 2023)
- Becker Friedman Institute, University of Chicago (Gibbs, Mengel, Siemroth), Work from Home & Productivity: Evidence from Personnel & Analytics Data on IT Professionals (BFI Working Paper 2021-56) (July 13, 2021)
- Microsoft WorkLab, Hybrid Work Is Just Work. Are We Doing It Wrong? (Work Trend Index) (September 22, 2022)
- The Quarterly Journal of Economics (Bloom, Liang, Roberts, Ying), Does Working from Home Work? Evidence from a Chinese Experiment (Published 20 November 2014 (vol. 130, issue 1, February 2015))
- Brookings Institution (Aksoy, Barrero, Bloom, Davis, Dolls, Zarate), Working from Home Around the World (Brookings Papers on Economic Activity) (September 7, 2022)
- American Economic Review (Mas, Pallais), Valuing Alternative Work Arrangements (December 2017)
- National Bureau of Economic Research (Cullen, Pakzad-Hurson, Perez-Truglia), Home Sweet Home: How Much Do Employees Value Remote Work? (NBER Working Paper 33383) (January 2025)
- American Economic Association (Aksoy, Barrero, Bloom, Davis, Dolls, Zarate), Time Savings When Working from Home (AEA Papers and Proceedings, vol. 113) (May 2023)
- Office for National Statistics (UK), Who are the hybrid workers? (11 November 2024)
- Proceedings of the National Academy of Sciences (Tao et al.), via PubMed Central, Climate mitigation potentials of teleworking are sensitive to changes in lifestyle and workplace rather than ICT usage (September 18, 2023)
- WFH Research / ifo Institute (Aksoy, Barrero, Bloom, Davis, Dolls, Zarate), Working from Home Around the Globe: 2023 Report (28 June 2023)
- Eurostat, Employed persons working from home by professional status - % of total employment (lfsa_ehomp), by country (2025 annual data, updated 10 September 2026)
- Eurostat, Employed persons working from home by professional status - % of total employment (lfsa_ehomp), EU-27 time series (2019-2025 annual data, updated 10 September 2026)
- Australian Bureau of Statistics, Working Arrangements, August 2025 (12 December 2025)
- Federal Statistical Office of Germany (Destatis), Quality of employment: Working from home (2023 data (update expected autumn 2026))
- ADP India, India Workforce Engagement Plummets to 19% in 2025, Defying Global Trends: ADP Research (People at Work 2025) (8 April 2025)
- LinkedIn Economic Graph Research Institute, Global State of Remote and Hybrid Work (September 2024)
- Hoover Institution, Stanford University (Aksoy, Barrero, Bloom, Davis, Dolls, Zarate), The Global Persistence of Work from Home (Economics Working Paper 25108) (April 24, 2025)
- Gallup, Indicator: Hybrid Work (May 2026 data)
- Indeed Hiring Lab, Remote Tracker: share of job postings with remote/hybrid terms (remote_postings.csv) (Data through 30 September 2026)
- Indeed Hiring Lab, Remote Tracker: share of job searches for remote/hybrid work (remote_searches.csv) (Data through 30 September 2026)
- Cushman & Wakefield, U.S. Office MarketBeat Reports, Q3 2026 (Q3 2026)
- CommercialEdge, National Office Report (September 2026) (17 September 2026)
- JLL, U.S. Office Market Dynamics, Q3 2026 (13 October 2026)
- Kastle Systems, Kastle Back to Work Barometer (Week ending 30 September 2026)
- Placer.ai, 2026 Office Recovery Trends Across Major U.S. Markets (13 August 2026)
- U.S. Office of Personnel Management, Telework in the Federal Government Report to Congress, Fiscal Year 2024 (December 2025)
- U.S. Office of Personnel Management, Status of Telework in the Federal Government Report to Congress, Fiscal Year 2023 (December 2024)
- U.S. Bureau of Labor Statistics, Contingent and Alternative Employment Arrangements, July 2023 (8 November 2024)
- MBO Partners, State of Independence 2026 (2026 (Report #1: Perspectives from the Independent Workforce))
- Ministry of Commerce and Industry, Government of India, Special Economic Zones (Fourth Amendment) Rules, 2023: substituted Rule 43A (Hybrid working), G.S.R. 824(E) (7 November 2023)
- Government of Ontario, Your guide to the Employment Standards Act: Written policy on disconnecting from work (Current guidance)
- U.S. Department of Labor, Wage and Hour Division, Employee or Independent Contractor Classification rulemaking (Updated 2026)
- European Parliament, Right to disconnect should be an EU-wide fundamental right, MEPs say (21 January 2021)
- Pew Research Center, Many remote workers say they'd be likely to leave their job if they could no longer work from home (13 January 2025 (survey 7-13 October 2024, n=2,315))
- Statistics Canada, Number of Canadian commuters increases for fourth straight year in 2025 (The Daily) (26 August 2025)
- Indeed Hiring Lab, October 2025 IN Labour Market Update: The Latest Remote Work Trends (2 December 2025)
- CBRE, U.S. Office Market Report Q2 2026: Top-Quality Space Leads Broadening Office Market Recovery (29 July 2026)
- American Economic Association, Work from Home and the Office Real Estate Apocalypse (Gupta, Mittal and Van Nieuwerburgh), American Economic Review 116(2): 674-709 (February 2026)
- U.S. Department of Labor, Wage and Hour Division (Federal Register via GovInfo), Employee or Independent Contractor Status Under the FLSA, FMLA and MSPA (Notice of Proposed Rulemaking, 91 FR 9932) (27 February 2026)
- U.S. Census Bureau, The Number of People Primarily Working From Home Tripled Between 2019 and 2021 (2021 ACS 1-year estimates, release CB22-155) (September 15, 2022)
- Pew Research Center, COVID-19 Pandemic Continues To Reshape Work in America (February 16, 2022)
- American Economic Association, The Evolution of Work from Home (Barrero, Bloom and Davis), Journal of Economic Perspectives 37(4) (Fall 2023)
- Gallup, Returning to the Office: The Current, Preferred and Future State of Remote Work (August 2022)
- Federal Reserve Bank of Atlanta, Hybrid Working Arrangements: Who Decides? (Survey of Business Uncertainty) (January 12, 2022)
- Owl Labs, State of Hybrid Work 2024 (US report, 2,000 full-time workers) (2024 (surveyed July 2024))
- Federal Reserve Bank of Atlanta, The Shift to Remote Work Lessens Wage-Growth Pressures, Working Paper 2022-7 (July 8, 2022)
- Buffer, State of Remote Work 2023 (3,000 remote workers) (2023 (surveyed Oct-Nov 2022))
- Office for National Statistics, Characteristics of homeworkers, Great Britain: September 2022 to January 2023 (13 February 2023)
- GOV.UK, Flexible working: Applying for flexible working (Current guidance (accessed October 2026))
Cite this page
ClauseAudit, “Remote Work Statistics 2026: 160+ Numbers on Telework, Hybrid Work and Return to Office”, updated October 17, 2026, https://clauseaudit.com/data/remote-work-statistics. Free to reuse with a link back (CC BY 4.0).
This page summarises published data and law as checked on October 17, 2026. Figures are updated as new editions are released, and your own situation may differ. It is general information, not legal, tax or financial advice.