Average PTO in the US: Paid Vacation Days by Years of Service (2026)
By ClauseAudit Research · 7 sources ·
What is the average number of PTO days per year in the US?
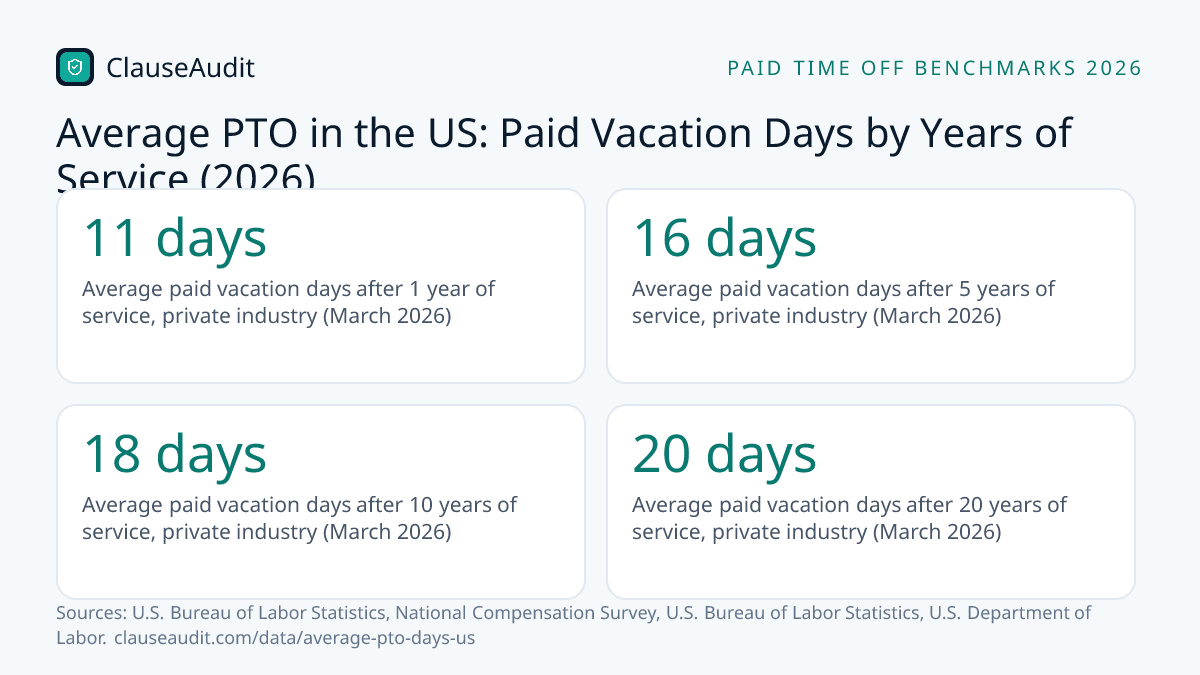
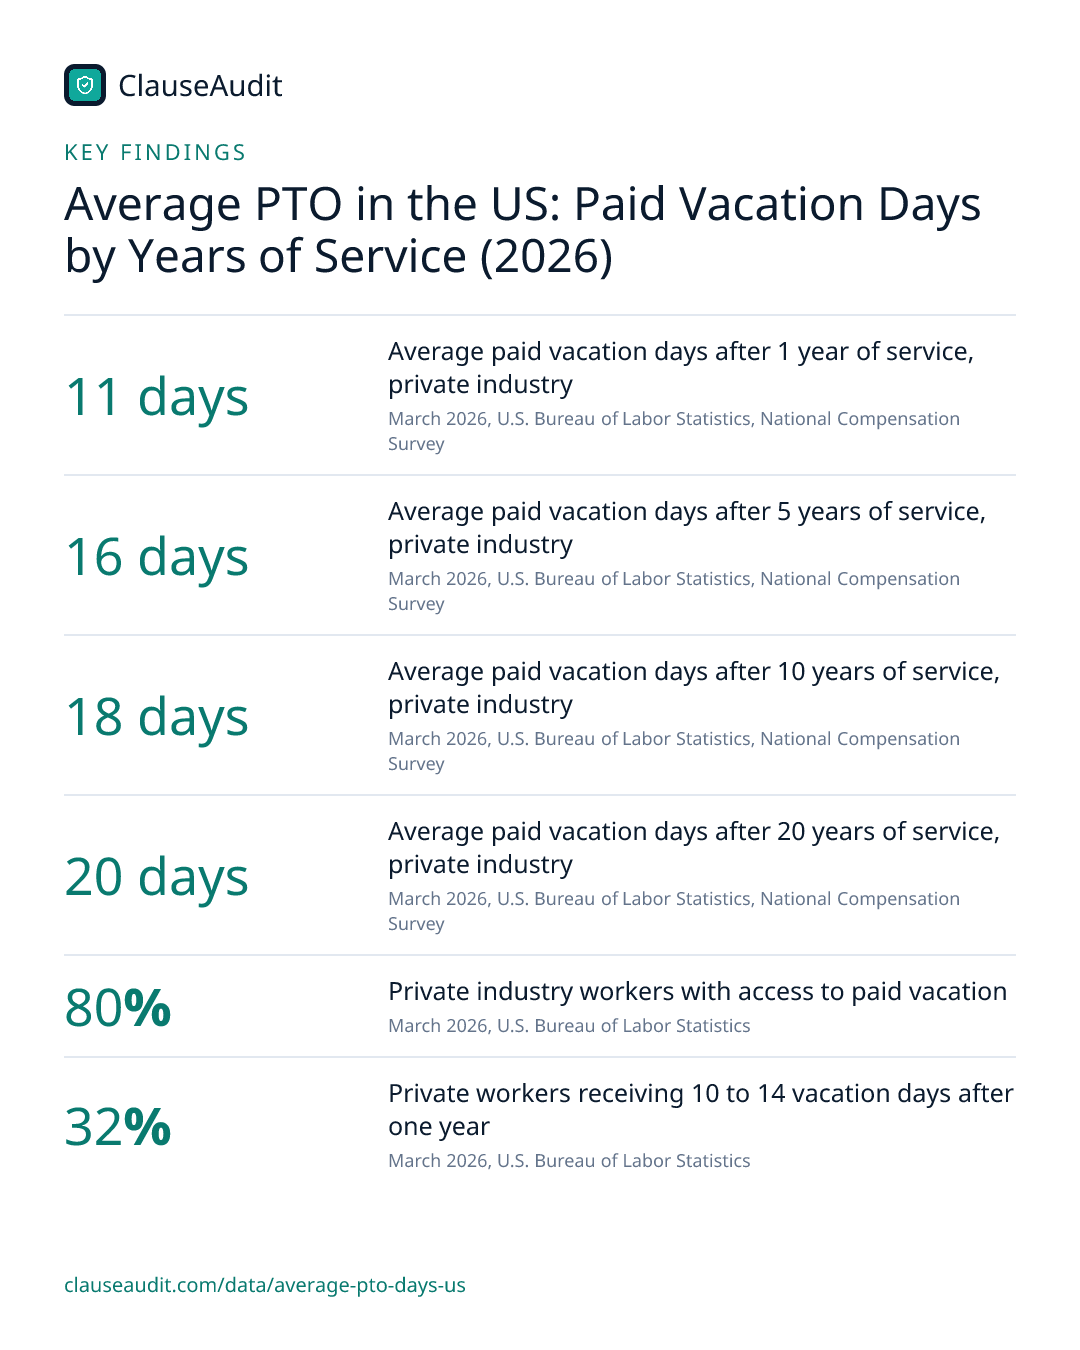
Private-sector workers in the US average 11 paid vacation days after one year on the job, according to March 2026 BLS data. That climbs to 16 days after 5 years, 18 after 10 and 20 after 20. Paid holidays and sick days often come on top, and no federal law requires paid vacation.

- Average paid vacation days after 1 year of service, private industry (March 2026, U.S. Bureau of Labor Statistics, National Compensation Survey)
- 11 days
- Average paid vacation days after 5 years of service, private industry (March 2026, U.S. Bureau of Labor Statistics, National Compensation Survey)
- 16 days
- Average paid vacation days after 10 years of service, private industry (March 2026, U.S. Bureau of Labor Statistics, National Compensation Survey)
- 18 days
- Average paid vacation days after 20 years of service, private industry (March 2026, U.S. Bureau of Labor Statistics, National Compensation Survey)
- 20 days
- Private industry workers with access to paid vacation (March 2026, U.S. Bureau of Labor Statistics)
- 80%
- Private workers receiving 10 to 14 vacation days after one year (March 2026, U.S. Bureau of Labor Statistics)
- 32%
- Paid vacation days federal law (FLSA) requires private employers to give (Current law (page read 2026-10-18), U.S. Department of Labor)
- 0 days
- Workers with paid time off who take less time off than offered (Feb. 6-12, 2023 survey, Pew Research Center)
- 46%
Ask a few friends how much vacation they get and you will hear wildly different answers. There is no federal minimum for paid vacation, so every number comes from a policy your employer wrote or a deal you struck when you were hired.
This page shows what is typical in 2026, how it grows with tenure and how much it depends on who you work for. Use it to judge an offer letter, to push back on a thin policy, or to set a fair policy for your own staff.
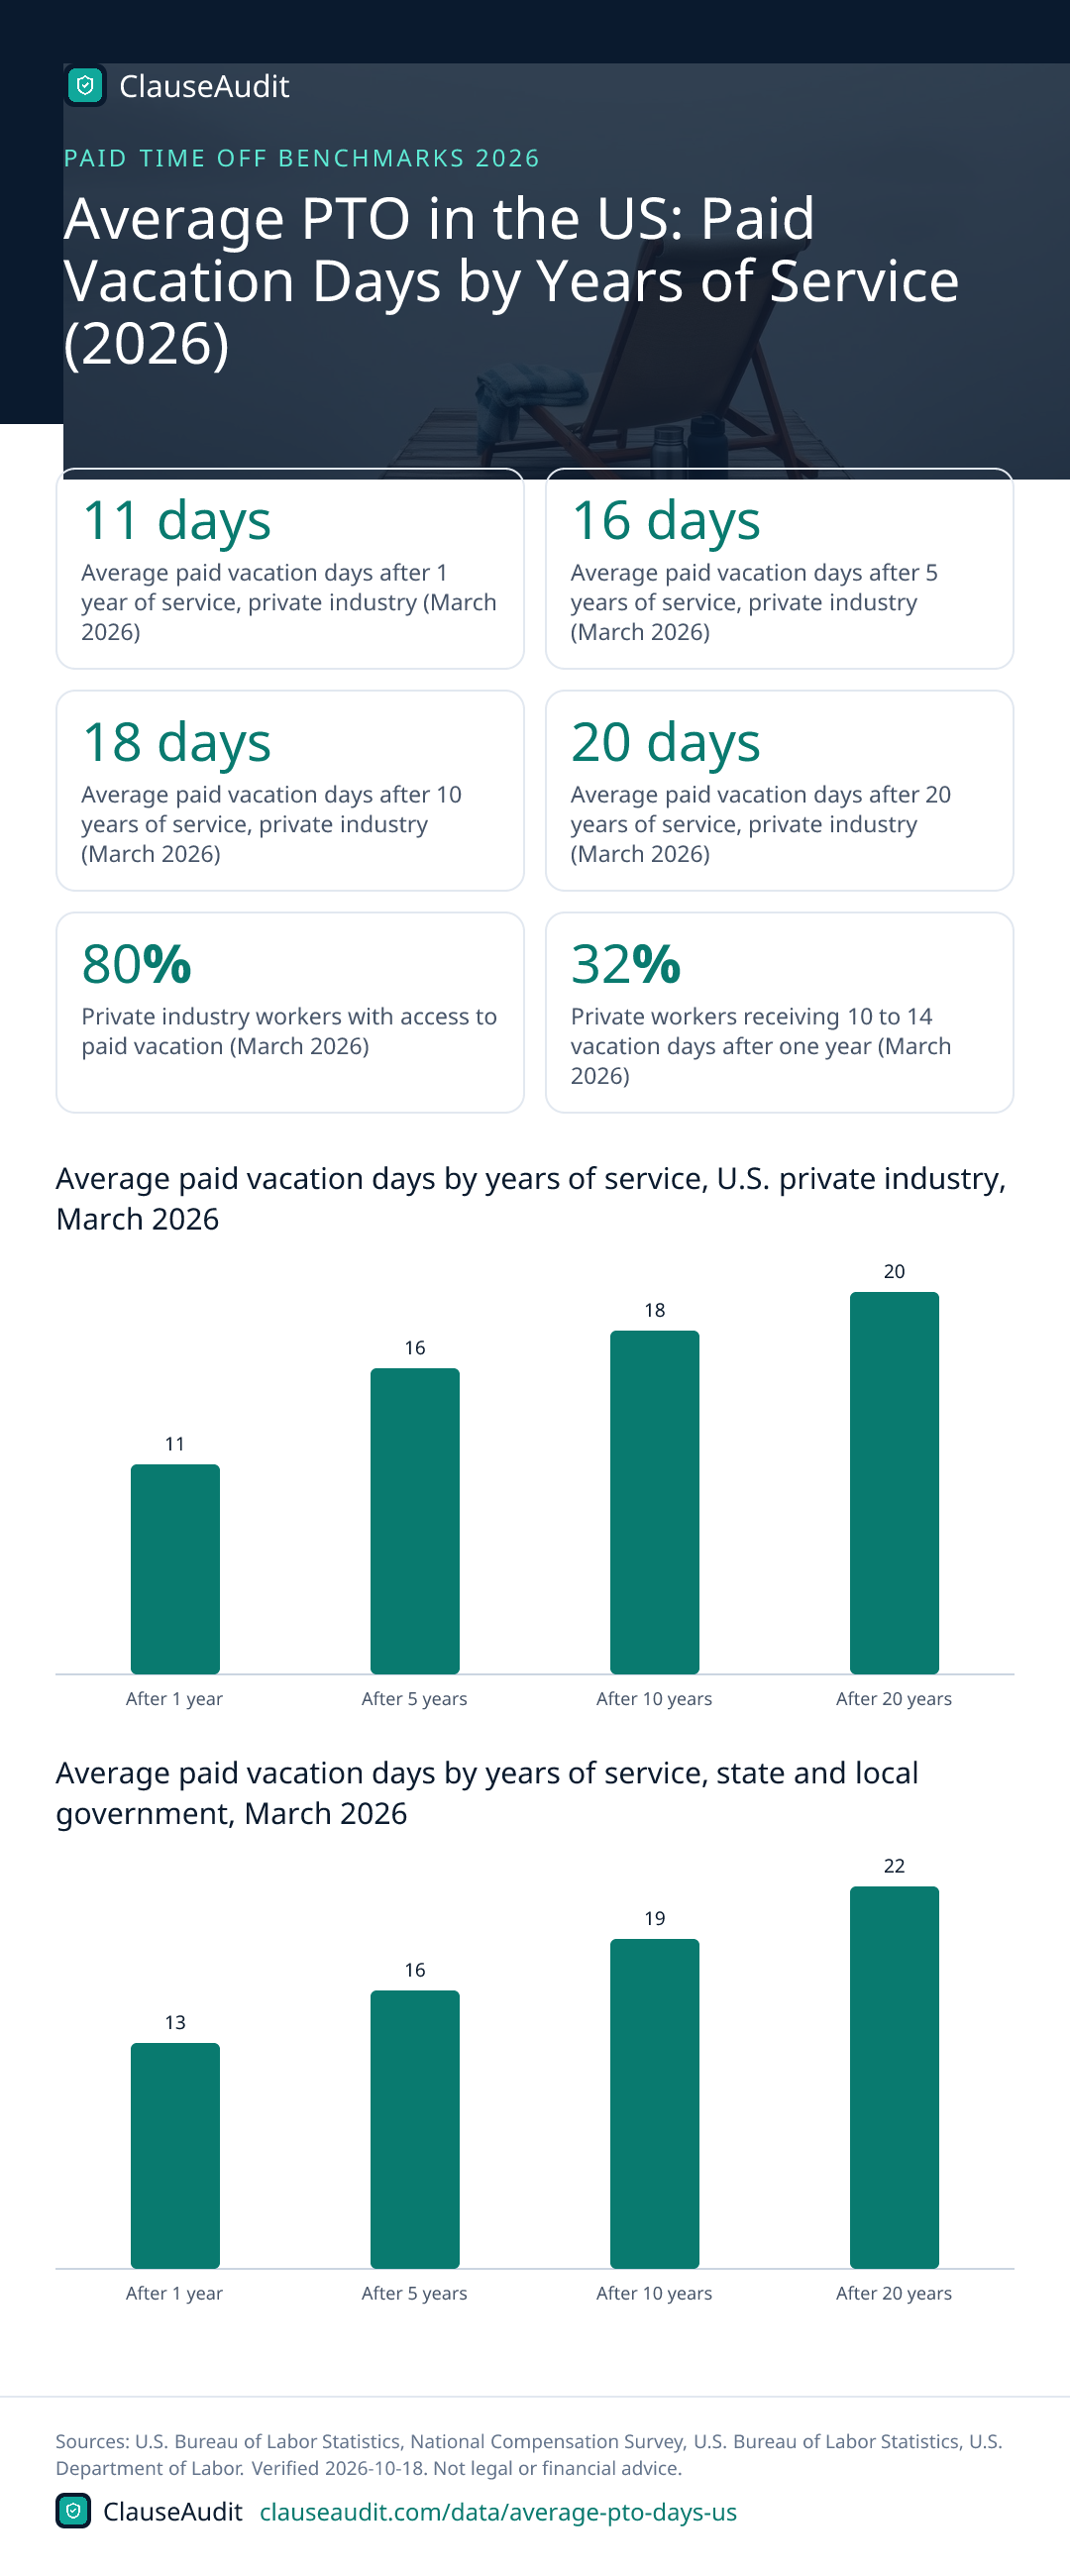
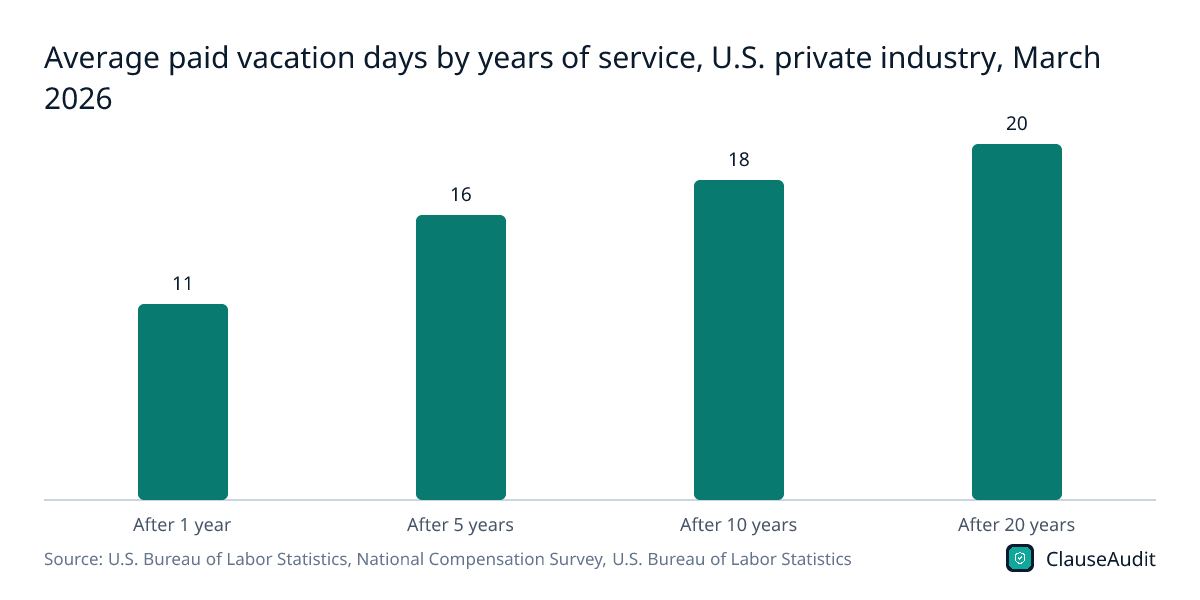
Average paid vacation days by years of service, U.S. private industry, March 2026
Chart data
| Label | Value |
|---|---|
| After 1 year | 11 |
| After 5 years | 16 |
| After 10 years | 18 |
| After 20 years | 20 |
The biggest jump happens early. Workers climb from 11 days to 16 by year 5, then add only a handful more over the next 15 years, so the early steps are the ones worth negotiating.
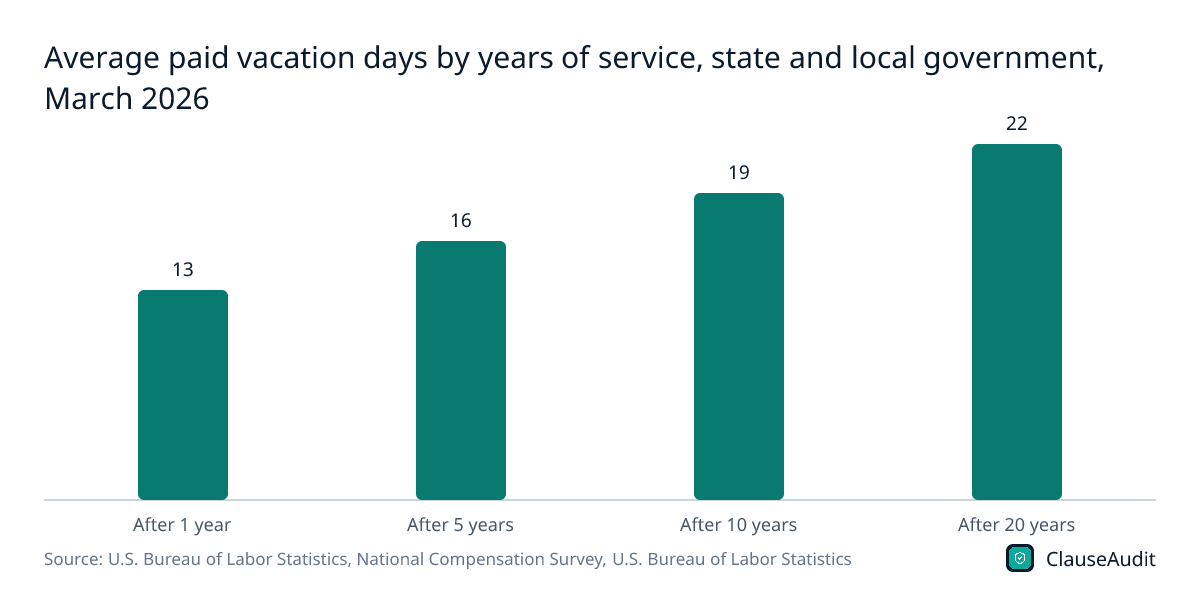
Download this chart (PNG)Average paid vacation days by years of service, state and local government, March 2026
Chart data
| Label | Value |
|---|---|
| After 1 year | 13 |
| After 5 years | 16 |
| After 10 years | 19 |
| After 20 years | 22 |
State and local government starts higher at 13 days after a year and reaches 22 after 20 years. Keep in mind only 61% of these workers have paid vacation at all, partly because many teachers are not offered it.
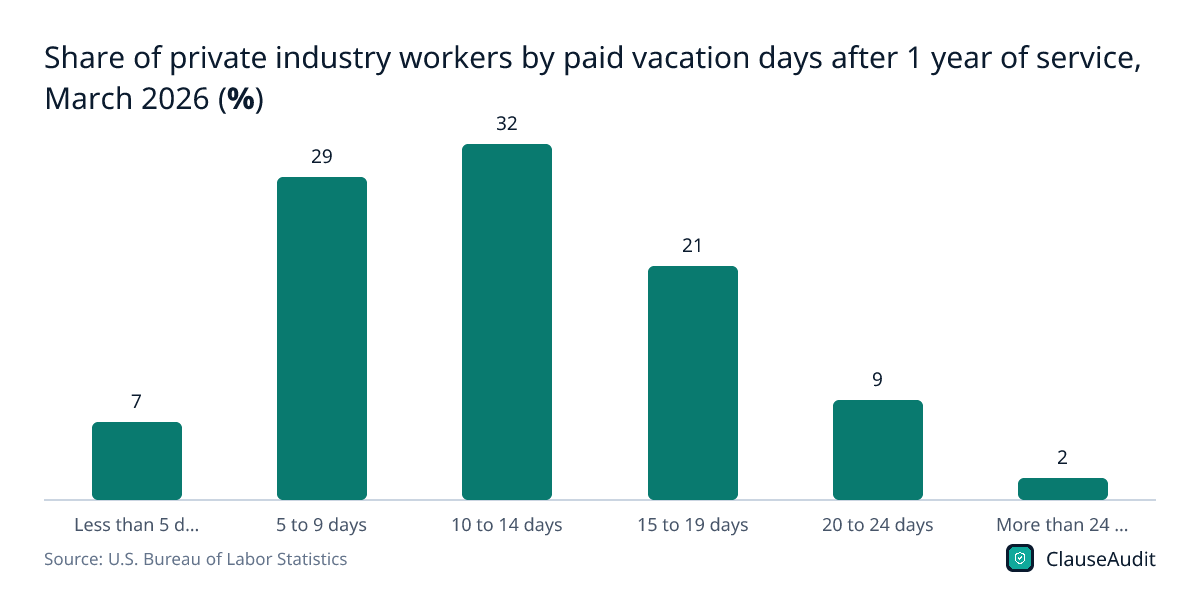
Download this chart (PNG)Share of private industry workers by paid vacation days after 1 year of service, March 2026 (%)
Chart data
| Label | Value (%) |
|---|---|
| Less than 5 days | 7 |
| 5 to 9 days | 29 |
| 10 to 14 days | 32 |
| 15 to 19 days | 21 |
| 20 to 24 days | 9 |
| More than 24 days | 2 |
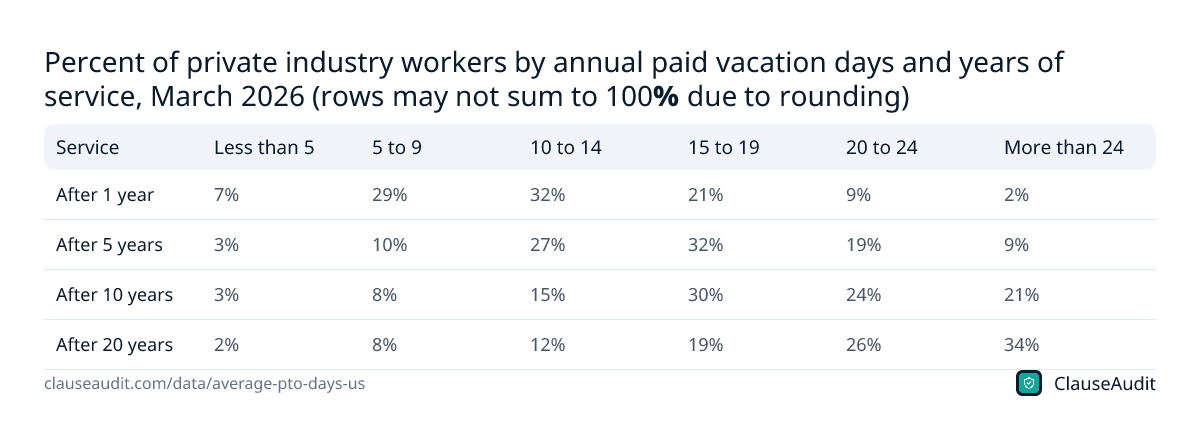
The averages hide a wide spread. After one year, 29% of private workers get 5 to 9 days while 21% get 15 to 19, so a 15-day starting offer already beats most of the market.
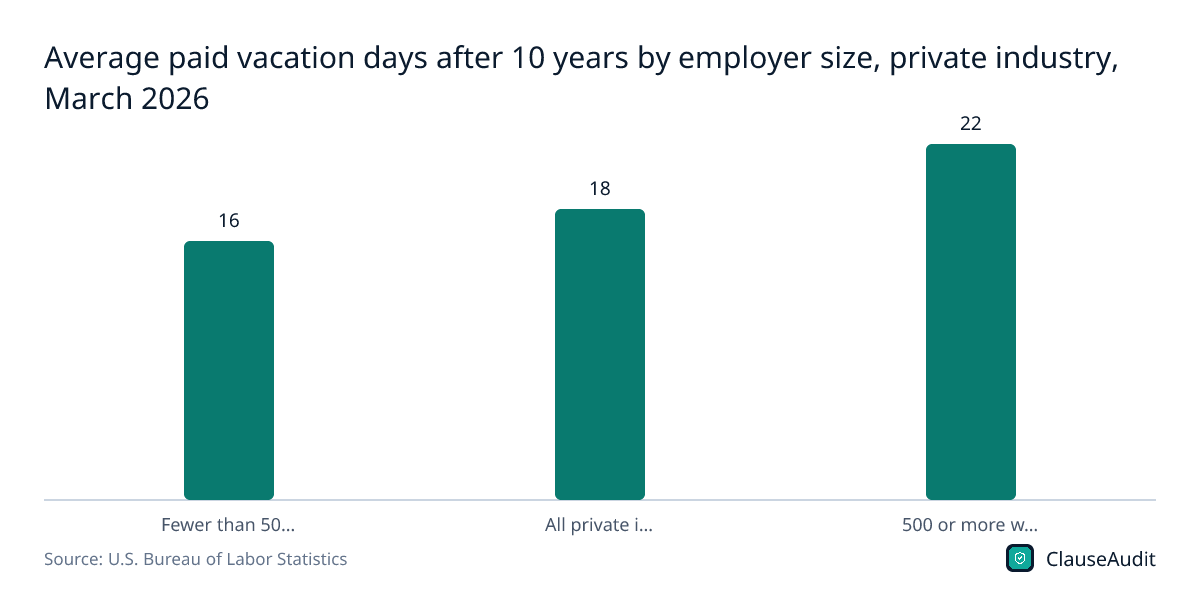
Download this chart (PNG)Average paid vacation days after 10 years by employer size, private industry, March 2026
Chart data
| Label | Value |
|---|---|
| Fewer than 50 workers | 16 |
| All private industry | 18 |
| 500 or more workers | 22 |
Employer size is one of the clearest dividing lines. A 10-year employee at a company with 500 or more workers averages 22 days, compared with 16 at a firm with fewer than 50.
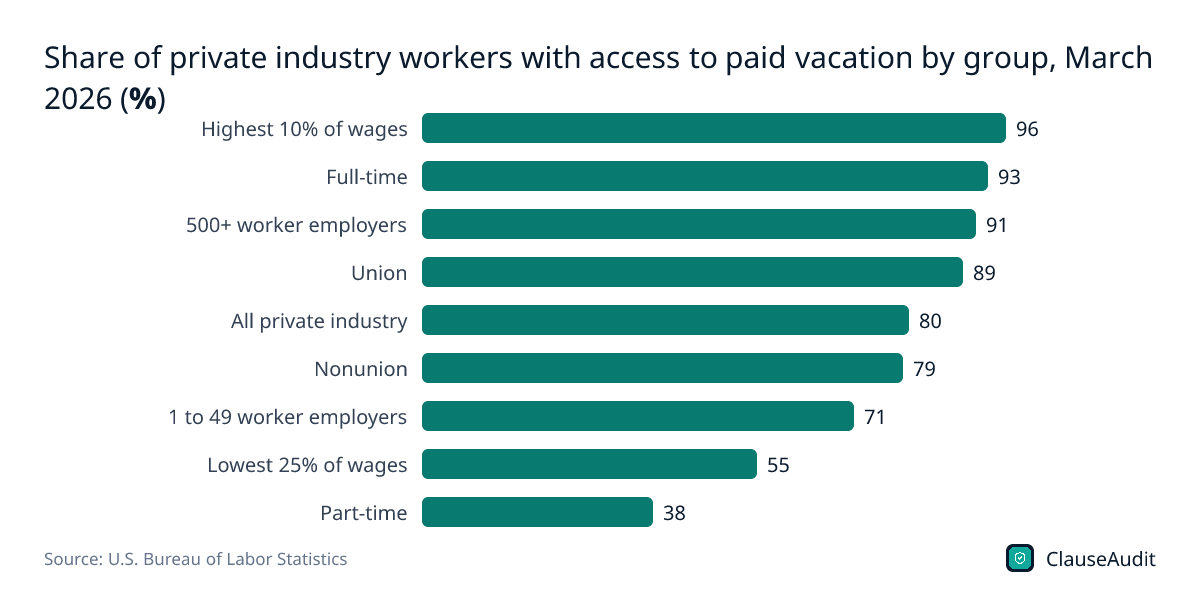
Download this chart (PNG)Share of private industry workers with access to paid vacation by group, March 2026 (%)
Chart data
| Label | Value |
|---|---|
| Highest 10% of wages | 96 |
| Full-time | 93 |
| 500+ worker employers | 91 |
| Union | 89 |
| All private industry | 80 |
| Nonunion | 79 |
| 1 to 49 worker employers | 71 |
| Lowest 25% of wages | 55 |
| Part-time | 38 |
Who gets vacation at all depends heavily on pay and hours. Only 38% of part-time workers and 55% of the lowest-paid quarter have paid vacation, against 93% of full-time workers.
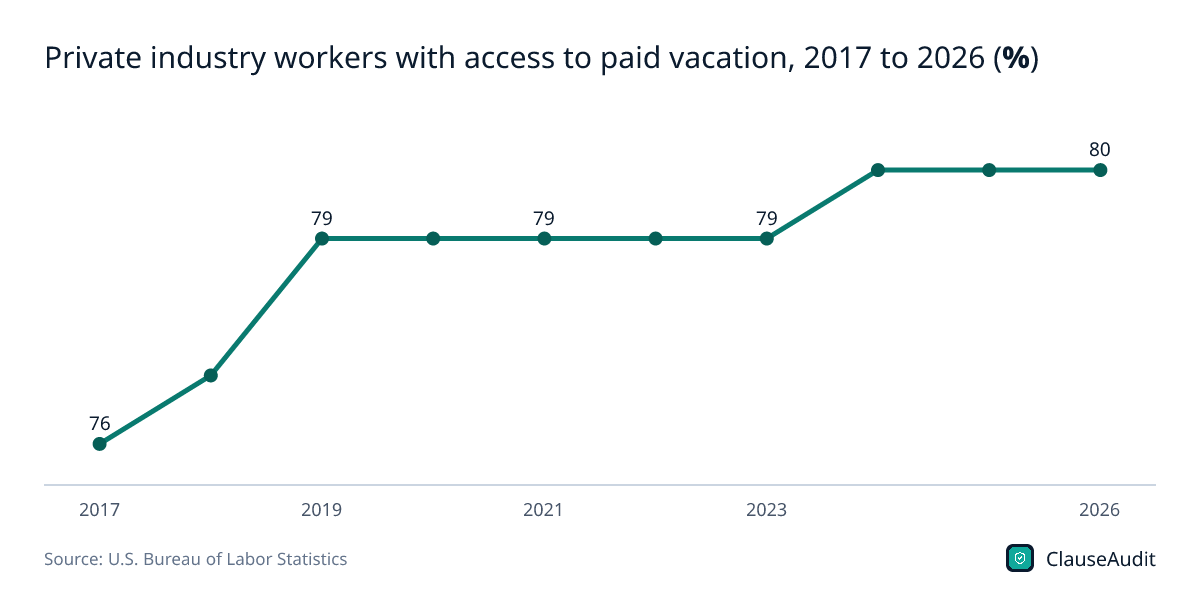
Download this chart (PNG)Private industry workers with access to paid vacation, 2017 to 2026 (%)
Chart data
| Label | Value (%) |
|---|---|
| 2017 | 76 |
| 2018 | 77 |
| 2019 | 79 |
| 2020 | 79 |
| 2021 | 79 |
| 2022 | 79 |
| 2023 | 79 |
| 2024 | 80 |
| 2025 | 80 |
| 2026 | 80 |
Access has crept up from 76% in 2017 to 80% in 2026. BLS warns these yearly estimates are not a strict time series, so read the line as a slow drift rather than a precise trend.
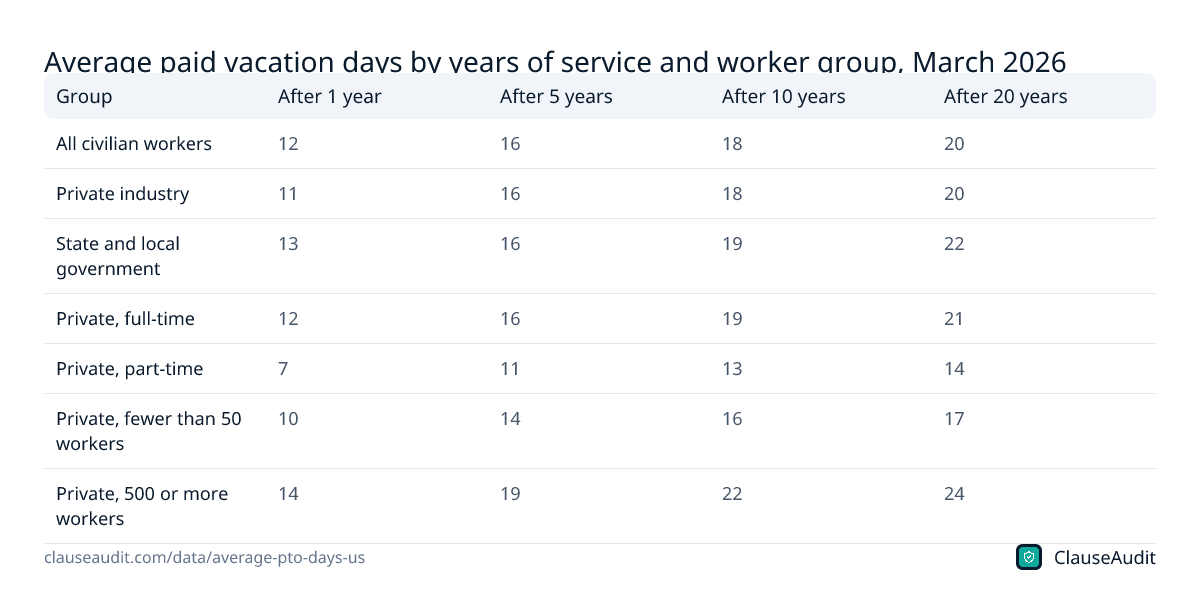
Download this chart (PNG)Average paid vacation days by years of service and worker group, March 2026
| Group | After 1 year | After 5 years | After 10 years | After 20 years |
|---|---|---|---|---|
| All civilian workers | 12 | 16 | 18 | 20 |
| Private industry | 11 | 16 | 18 | 20 |
| State and local government | 13 | 16 | 19 | 22 |
| Private, full-time | 12 | 16 | 19 | 21 |
| Private, part-time | 7 | 11 | 13 | 14 |
| Private, fewer than 50 workers | 10 | 14 | 16 | 17 |
| Private, 500 or more workers | 14 | 19 | 22 | 24 |
Source: U.S. Bureau of Labor Statistics, National Compensation Survey, Benefits (NB) time series: paid vacation average days and day bands, paid vacation access, paid holidays and sick leave average days (e.g., NBU20500000000000030039, NBU20500000000000033030); U.S. Bureau of Labor Statistics, National Compensation Survey, Paid leave benefits: Average number of sick and vacation days by length of service requirement, March 2026. Download as image
Percent of private industry workers by annual paid vacation days and years of service, March 2026 (rows may not sum to 100% due to rounding)
| Service | Less than 5 | 5 to 9 | 10 to 14 | 15 to 19 | 20 to 24 | More than 24 |
|---|---|---|---|---|---|---|
| After 1 year | 7% | 29% | 32% | 21% | 9% | 2% |
| After 5 years | 3% | 10% | 27% | 32% | 19% | 9% |
| After 10 years | 3% | 8% | 15% | 30% | 24% | 21% |
| After 20 years | 2% | 8% | 12% | 19% | 26% | 34% |
Source: U.S. Bureau of Labor Statistics, National Compensation Survey, Benefits (NB) time series: paid vacation average days and day bands, paid vacation access, paid holidays and sick leave average days (e.g., NBU20500000000000030039, NBU20500000000000033030); U.S. Bureau of Labor Statistics, Paid vacations: Who receives paid vacations? (fact sheet). Download as image
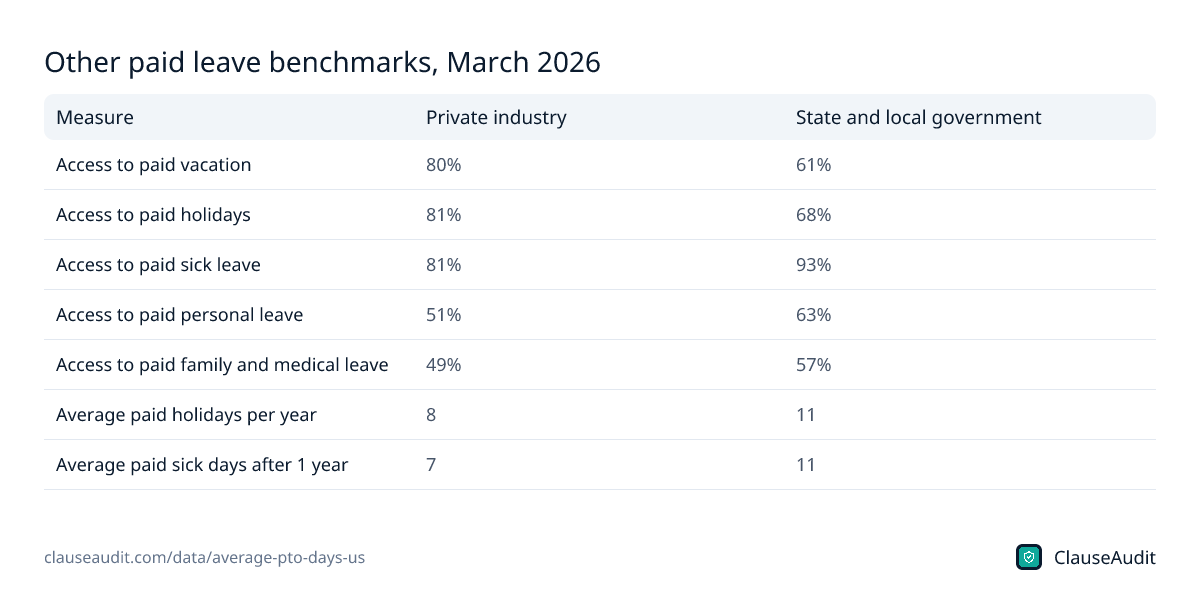
Other paid leave benchmarks, March 2026
| Measure | Private industry | State and local government |
|---|---|---|
| Access to paid vacation | 80% | 61% |
| Access to paid holidays | 81% | 68% |
| Access to paid sick leave | 81% | 93% |
| Access to paid personal leave | 51% | 63% |
| Access to paid family and medical leave | 49% | 57% |
| Average paid holidays per year | 8 | 11 |
| Average paid sick days after 1 year | 7 | 11 |
Source: U.S. Bureau of Labor Statistics, Employee Benefits in the United States, March 2026 (news release USDL); U.S. Bureau of Labor Statistics, National Compensation Survey, Benefits (NB) time series: paid vacation average days and day bands, paid vacation access, paid holidays and sick leave average days (e.g., NBU20500000000000030039, NBU20500000000000033030); U.S. Bureau of Labor Statistics, National Compensation Survey, Paid leave benefits: Average number of sick and vacation days by length of service requirement, March 2026. Download as image
How many PTO days is normal in the US?
For a private-sector worker with one year of service, 11 paid vacation days is the average. Full-time workers do a little better at 12. If you are part-time, the average drops to 7, and that is only among part-timers who get paid vacation in the first place.
Those numbers count vacation only. Most employers also give paid holidays, with private industry averaging 8 a year, and separate sick days, averaging 7 after a year. So a job advertised as "11 days PTO" might be fairly standard if holidays and sick time sit on top, or quite lean if everything is lumped into one bucket.
That is the first thing to sort out when you compare offers. A combined PTO bank of 20 days sounds better than 11 vacation days. But 11 vacation days plus 8 paid holidays plus 7 sick days is more total time off than that bank, so the plan that looks smaller on paper can give you more rest.
How does vacation grow with years of service?
Most policies use a tenure ladder. In private industry the averages are 11 days after 1 year, 16 after 5, 18 after 10 and 20 after 20. The 5-year figure was 15 days in March 2025, so that step moved up by a day this year.
Notice how flat the top gets. Once you pass five years, each extra day takes years to earn. That has two practical effects. First, the vacation you lock in when you are hired matters more than the steps that come later. Second, if you leave a long-tenured job, you may drop back to the bottom rung unless you negotiate your way back up.
Say you have spent 10 years at a large company and earn about 22 days. A smaller firm recruits you with its standard new-hire policy of 10 days. On paper that is the same title and more salary, but you would be giving up a big chunk of paid rest every year. Ask them to start you on the rung that matches your experience. The answer may be no, but you will never have more bargaining power than before you sign.
Why do some workers get far more PTO than others?
Employer size is a big driver. After one year, private firms with fewer than 50 workers average 10 days, while those with 500 or more average 14. At 20 years the gap widens to 17 days versus 24.
Pay and hours decide even more about who gets vacation at all. In the top tenth of wages, 96% of workers have paid vacation. For the lowest-paid quarter it is 55%, and for part-time workers it is 38%. Union members are also ahead of nonunion workers, 89% to 79%.
Other kinds of paid leave are less common. Just 51% of private workers have paid personal leave and 49% have paid family and medical leave, so a job that offers both beats what most private employers provide.
Public employers turn some of this around. State and local government workers are less likely to have paid vacation, at 61%, but far more likely to have paid sick leave, at 93% versus 81% in private industry. They also average 11 paid holidays to private industry's 8.
Is paid vacation required by law?
No. The federal Fair Labor Standards Act requires 0 paid vacation days. The Department of Labor treats vacation as a matter of agreement between you and your employer, which is exactly why the contract or written policy matters so much.
Some states and cities step in on related issues. Many require paid sick leave, and some require employers to pay out unused vacation when you leave, or bar policies where earned time simply disappears. Those rules vary a lot, so check your own state before you assume your balance is safe.
Do Americans actually use their PTO?
Having vacation and taking it are two different things. In Pew Research Center's 2023 survey, 46% of workers who get paid time off said they take less than their employer offers. People gave reasons like worrying about falling behind, feeling bad for coworkers who would cover for them, or not feeling they needed the time.
Leaving days on the table can cost you real money. If your policy has a carryover cap or a use-it-or-lose-it rule, unused days vanish at year end. If your state does not require payout and your handbook says nothing, you may walk away from a job with a balance and get nothing for it.
Here is a simple habit that helps. Look at your balance every quarter, book at least part of it in advance, and read the carryover and payout sections of your policy once a year. Policies change, and in many cases an employer can revise one going forward without asking for your agreement.
What to do with these numbers
- Job seekers: treat vacation as part of pay. If an offer comes in below 12 days for a full-time role, the full-time average after a year, ask for more before you sign, when you have the most bargaining power.
- Experienced hires: ask to be placed on the tenure step that matches your years in the field, not the new-hire rung.
- Employees: check if your time accrues per pay period, when it vests, whether it carries over and what happens to it when you quit or are let go.
- Small business owners: you do not have to match a 500-person company, but offering 10 to 14 days after a year puts you in the most common band, where 32% of private workers sit, and ahead of the 29% who get 5 to 9.
- Everyone: actually use it. 46% of workers with paid time off took less than they were offered in Pew's 2023 survey, and unused days are worth nothing if your policy lets them expire.
How ClauseAudit helps
Your vacation is only as good as the words in your offer letter, employment agreement or handbook. Vague phrases like "PTO at manager discretion" or "subject to change" can quietly shrink what you thought you were getting.
Upload your contract and our automated review flags the leave terms in plain English, so you know what to ask about before you sign.
- Annual days and tenure steps: is the number stated, and does it grow with service?
- Accrual and waiting periods: when can you take time, and how fast does it build?
- Carryover caps and use-it-or-lose-it rules that can wipe out your balance
- Payout of unused vacation when you resign or are terminated
- Unlimited PTO wording that leaves approval and payout entirely to the employer
- Unilateral change clauses that let the employer cut benefits without your consent
Frequently asked questions
Is 15 days of PTO good?
For someone with a year or so of service, yes. The private-sector average after one year is 11 vacation days, and most private workers get fewer than 15 at that point. Check whether the 15 days include holidays and sick time, though. If they do, it falls short of the typical package of 11 vacation days plus 8 holidays plus 7 sick days.
How many vacation days do government employees get?
State and local government workers who have paid vacation average 13 days after one year, 16 after 5 years, 19 after 10 and 22 after 20. Only 61% of them have paid vacation, partly because many teachers are on school calendars instead.
Does PTO include holidays and sick days?
It depends on the employer. Some use one combined PTO bank. Others keep vacation, sick leave and holidays separate. The BLS figures on this page are vacation only. Private employers also average 8 paid holidays and 7 sick days after a year, so add those to the 11 vacation days before you compare a combined bank with a split policy.
Can I negotiate more vacation in a job offer?
Often, yes. Vacation is one of the terms employers tend to have room on, especially for experienced hires. Ask before you sign, get the number in writing in the offer letter, and ask whether the higher starting point also carries up the tenure ladder later.
Does my employer have to pay out unused vacation when I leave?
There is no federal rule requiring payout. Some states require it, and others let the employer's written policy decide. That makes the payout wording in your contract or handbook important. If it says unused time is forfeited, check if your state allows that.
Do part-time workers get paid vacation?
Less often. Just 38% of private part-time workers have paid vacation, compared with 93% of full-timers. Those who do get it average 7 days after a year, 11 after 5 years and 14 after 20 years. If you work reduced hours, ask if your vacation is prorated from the full-time policy and get the formula in writing.
Is unlimited PTO better than a set number of days?
Not always. With unlimited PTO there is usually no balance to pay out when you leave, and every request usually still needs your manager's approval. If you are offered one, ask how much time people on the team actually take, and read what the policy says happens when you quit.
How common is paid vacation in the US?
80% of private industry workers had access to paid vacation in March 2026, up from 76% in 2017. No federal law requires it, and the other 20% get none. Part-time and lower-wage workers are the most likely to go without, and access is lower at small firms, at 71% for employers with 1 to 49 workers.
Use this data
Every chart and card below is free to reuse under CC BY 4.0. Download what you need and link back to this page.
 Stat cards
 Key findings card
 Infographic
 Average paid vacation days by years of service, U.S. private industry, March 2026
 Average paid vacation days by years of service, state and local government, March 2026
 Share of private industry workers by paid vacation days after 1 year of service, March 2026 (%)
 Average paid vacation days after 10 years by employer size, private industry, March 2026
 Share of private industry workers with access to paid vacation by group, March 2026 (%)
 Private industry workers with access to paid vacation, 2017 to 2026 (%)
 Average paid vacation days by years of service and worker group, March 2026
 Percent of private industry workers by annual paid vacation days and years of service, March 2026 (rows may not sum to 100% due to rounding)
 Other paid leave benchmarks, March 2026
Embed the infographic
Free to share on your site, blog or slides under CC BY 4.0. Please keep the credit link.
Sources and method
Every number on this page comes from the sources below, each opened and read on or before October 18, 2026. A second, independent review checked every figure against its source and corrected anything that did not match. Figures that could not be confirmed were left out.
- U.S. Bureau of Labor Statistics, National Compensation Survey, Paid leave benefits: Average number of sick and vacation days by length of service requirement, March 2026 (March 2026 estimates (released September 25, 2026))
- U.S. Bureau of Labor Statistics, Employee Benefits in the United States, March 2026 (news release USDL) (September 25, 2026)
- U.S. Bureau of Labor Statistics, Table 6. Selected paid leave benefits: Access, March 2026 (September 25, 2026)
- U.S. Bureau of Labor Statistics, Paid vacations: Who receives paid vacations? (fact sheet) (Last modified September 25, 2026 (2026 data))
- U.S. Bureau of Labor Statistics, National Compensation Survey, Benefits (NB) time series: paid vacation average days and day bands, paid vacation access, paid holidays and sick leave average days (e.g., NBU20500000000000030039, NBU20500000000000033030) (2026 annual estimates (March 2026 reference), queried 2026-10-18)
- U.S. Department of Labor, Vacation Leave (Undated page, read 2026-10-18)
- Pew Research Center, More than 4 in 10 U.S. workers don't take all their paid time off (August 10, 2023)
Cite this page
ClauseAudit, “Average PTO in the US: Paid Vacation Days by Years of Service (2026)”, updated October 18, 2026, https://clauseaudit.com/data/average-pto-days-us. Free to reuse with a link back (CC BY 4.0).
This page summarises published data and law as checked on October 18, 2026. Figures are updated as new editions are released, and your own situation may differ. It is general information, not legal, tax or financial advice.