SaaS and Cloud Outage Statistics: How Often Software Goes Down and What It Costs
By ClauseAudit Research · 10 sources ·
What is the cost of downtime for a business?
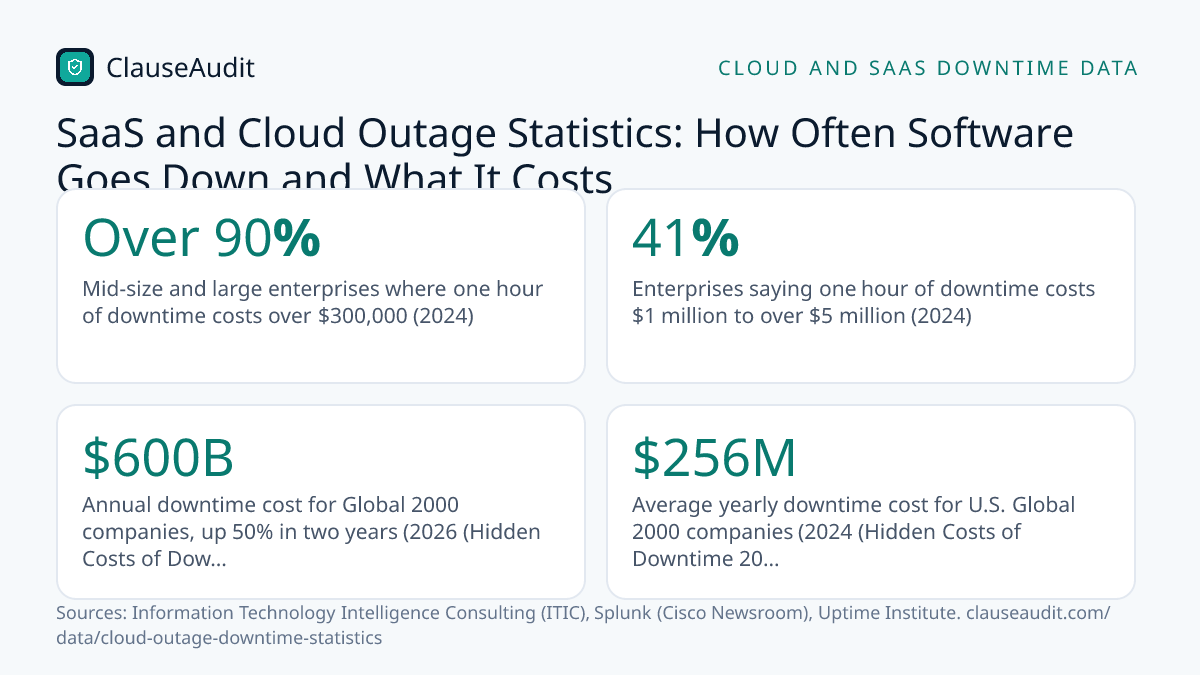
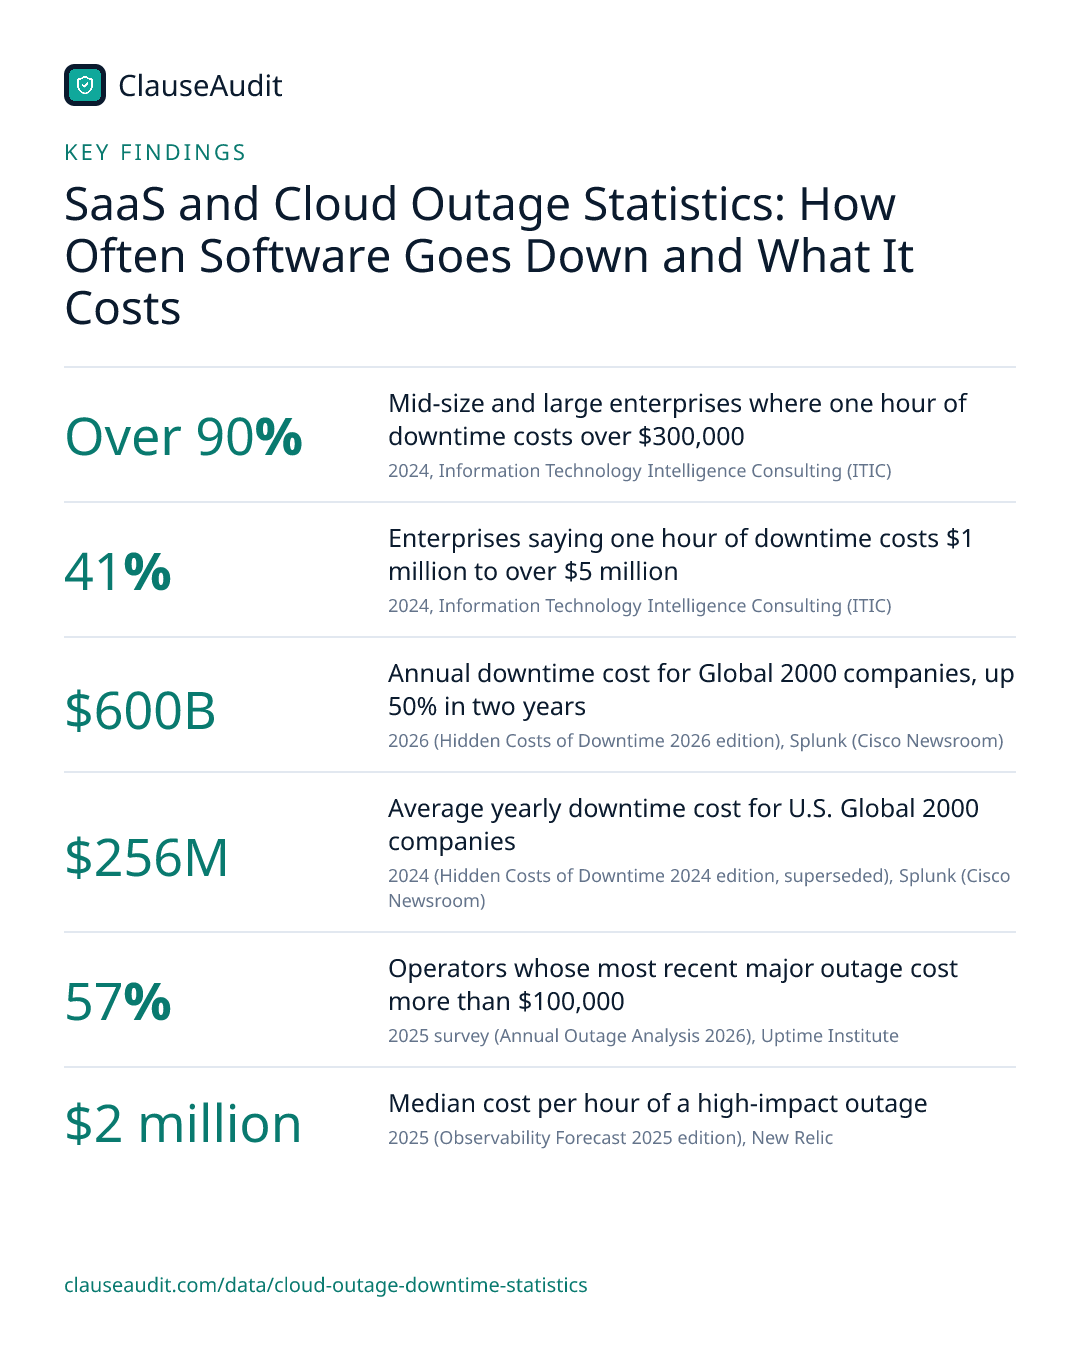
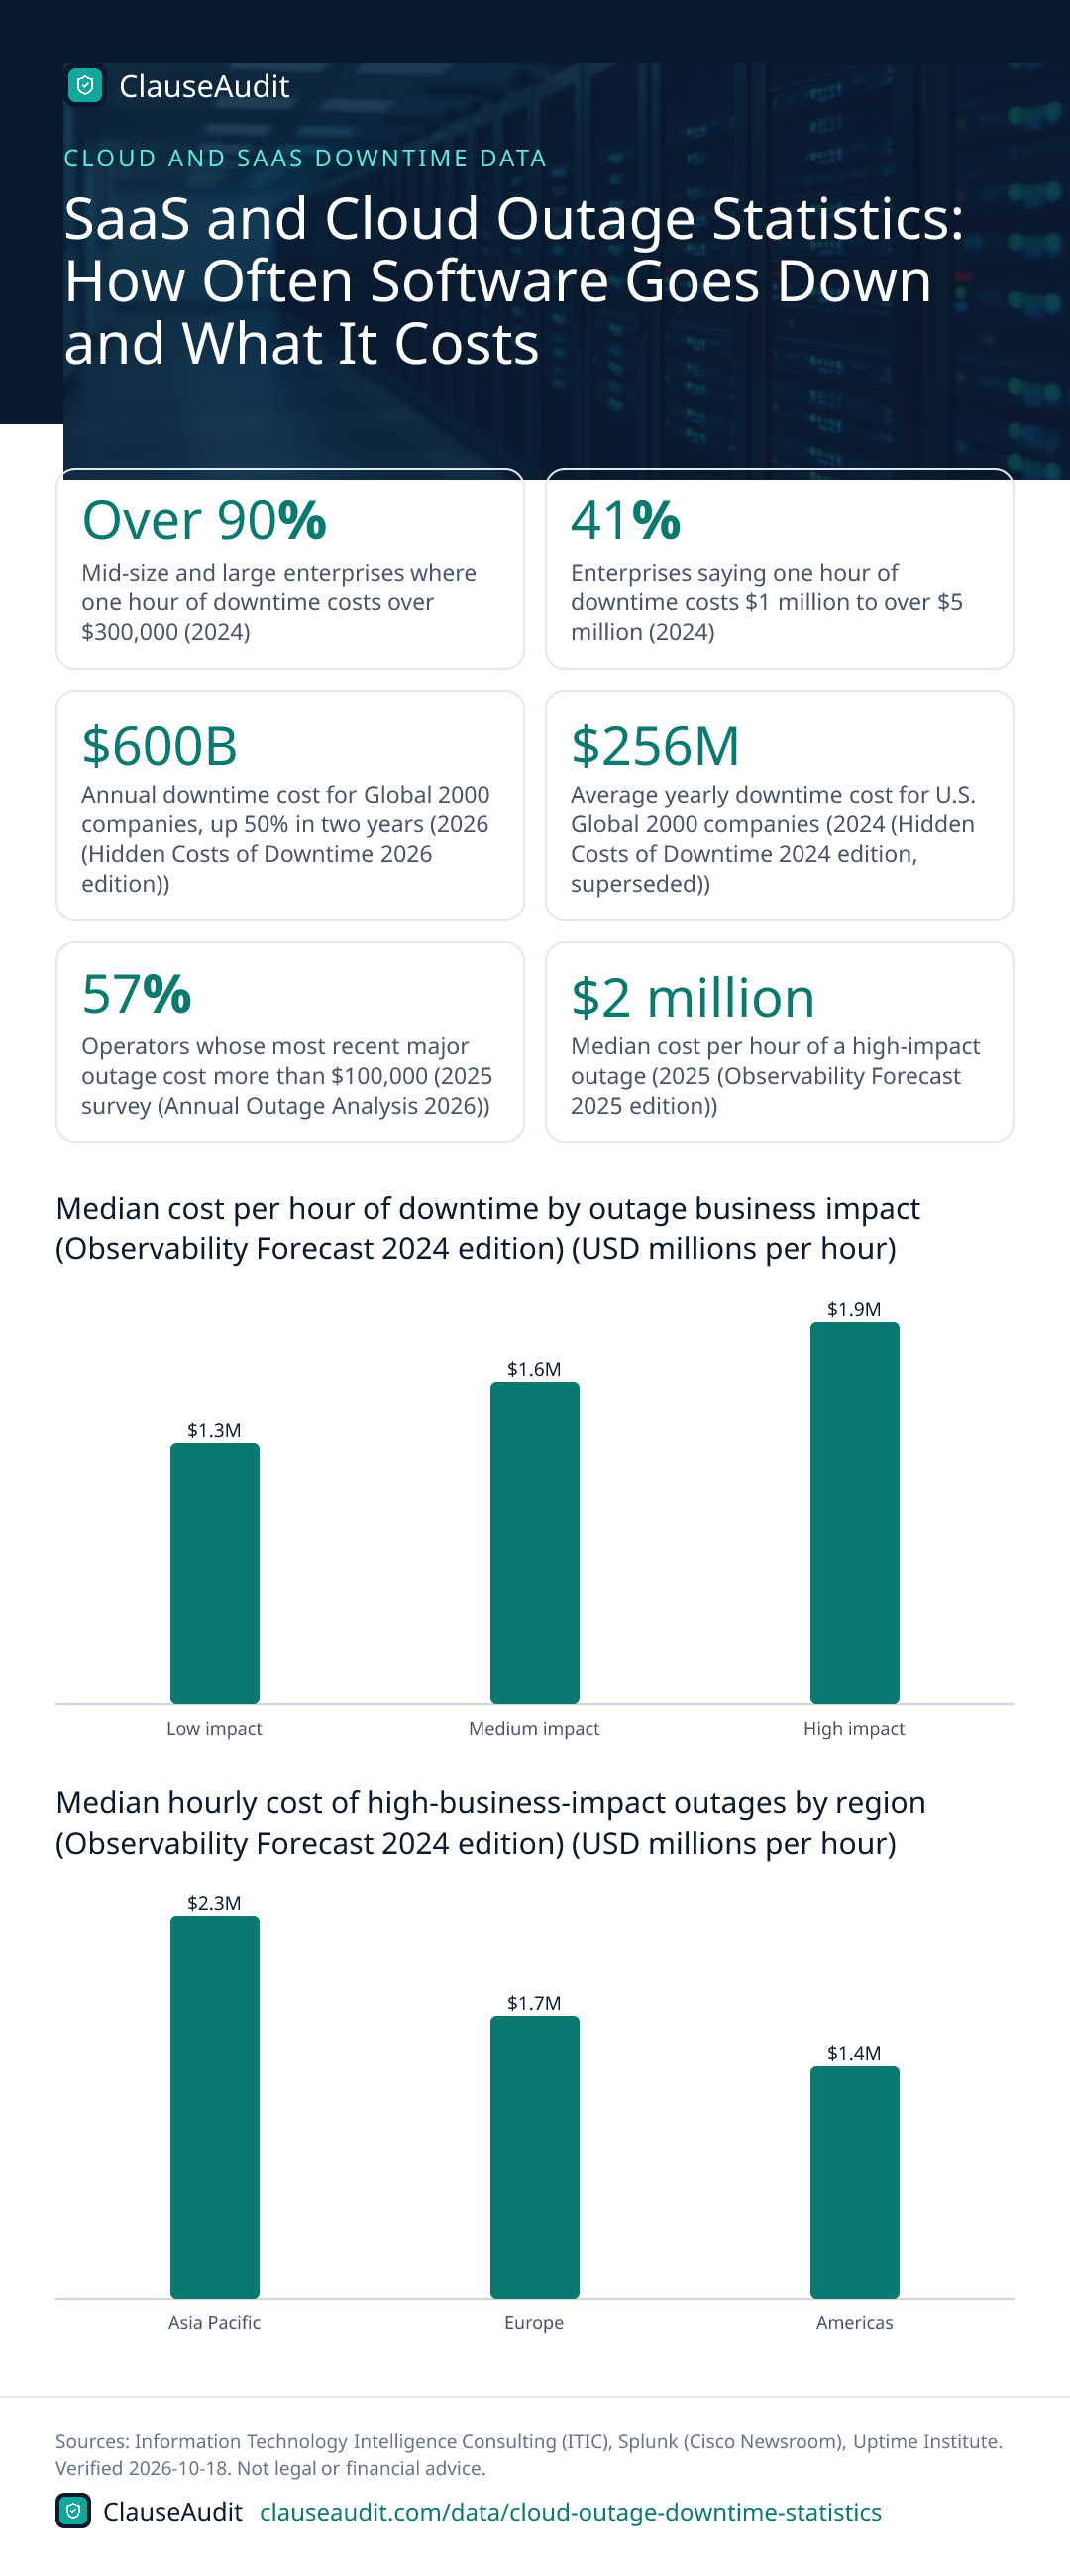
Downtime is expensive for almost any company that runs on software. Over 90% of mid-size and large enterprises say one hour of downtime costs more than $300,000, and 41% put it at $1 million to over $5 million (ITIC, 2024). High-impact outages carried a median cost of $2 million per hour in New Relic's 2025 survey.

- Mid-size and large enterprises where one hour of downtime costs over $300,000 (2024, Information Technology Intelligence Consulting (ITIC))
- Over 90%
- Enterprises saying one hour of downtime costs $1 million to over $5 million (2024, Information Technology Intelligence Consulting (ITIC))
- 41%
- Annual downtime cost for Global 2000 companies, up 50% in two years (2026 (Hidden Costs of Downtime 2026 edition), Splunk (Cisco Newsroom))
- $600B
- Average yearly downtime cost for U.S. Global 2000 companies (2024 (Hidden Costs of Downtime 2024 edition, superseded), Splunk (Cisco Newsroom))
- $256M
- Operators whose most recent major outage cost more than $100,000 (2025 survey (Annual Outage Analysis 2026), Uptime Institute)
- 57%
- Median cost per hour of a high-impact outage (2025 (Observability Forecast 2025 edition), New Relic)
- $2 million
- Annual median cost of high-impact IT outages per business surveyed (2025 (Observability Forecast 2025 edition), New Relic)
- $76 million
- Median annual downtime across all outage impact levels (2024 (Observability Forecast 2024 edition), New Relic)
- 77 hours
- Average cost per hour of a high-business-impact outage (2026 (Observability Forecast 2026 edition), New Relic)
- $1.85 million
- Annualized cost of high-impact outages for respondents, down from $76M in 2025 (2026 (Observability Forecast 2026 edition), New Relic)
- $73.5M
- Share of impactful outages caused by IT and networking issues (2024, Uptime Institute)
- 23%
An outage at a cloud provider or a SaaS tool you depend on rarely stays someone else's problem. Over 90% of mid-size and large enterprises told ITIC in 2024 that a single hour of downtime costs them more than $300,000. Splunk's 2026 research puts the bill for Global 2000 companies at $600B a year.
Most of that cost lands on the customer, not the vendor. Your software contract decides how much of it you can claw back, and the usual answer is very little. This page pulls together the cost and cause data, then shows what to check in your own agreements before the next outage.
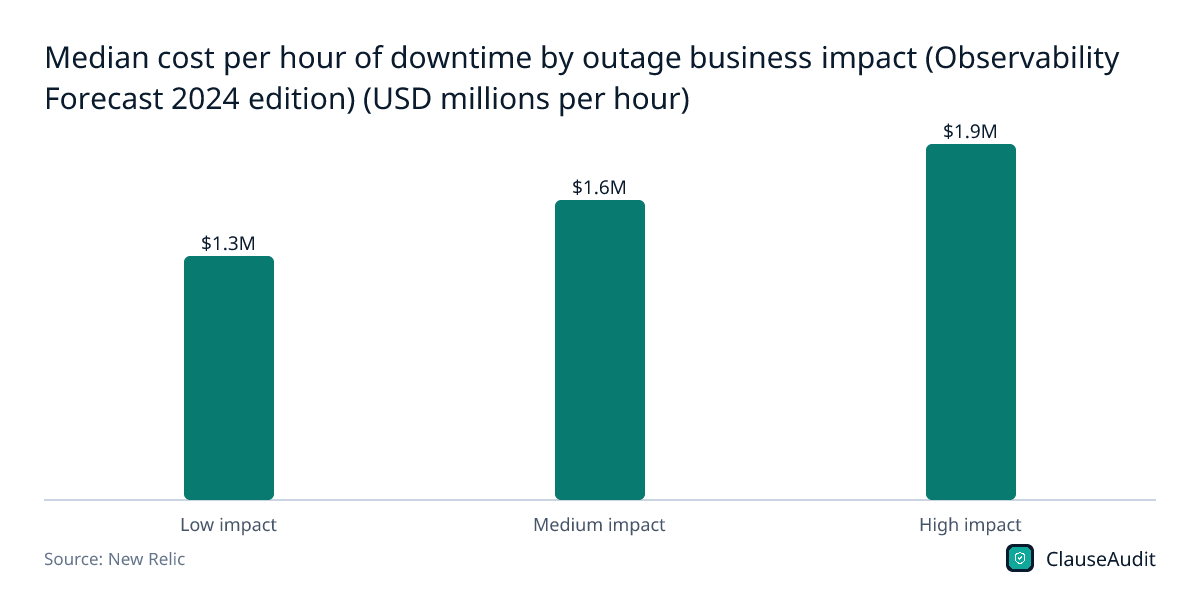
Median cost per hour of downtime by outage business impact (Observability Forecast 2024 edition) (USD millions per hour)
Chart data
| Label | Value (USD millions per hour) |
|---|---|
| Low impact | $1.3M |
| Medium impact | $1.6M |
| High impact | $1.9M |
Even a low-impact outage carried a median of $1.3M per hour in the 2024 survey, against $1.9M for high-impact events. The gap between the bars is smaller than most people expect, so a "minor" incident is still costly.
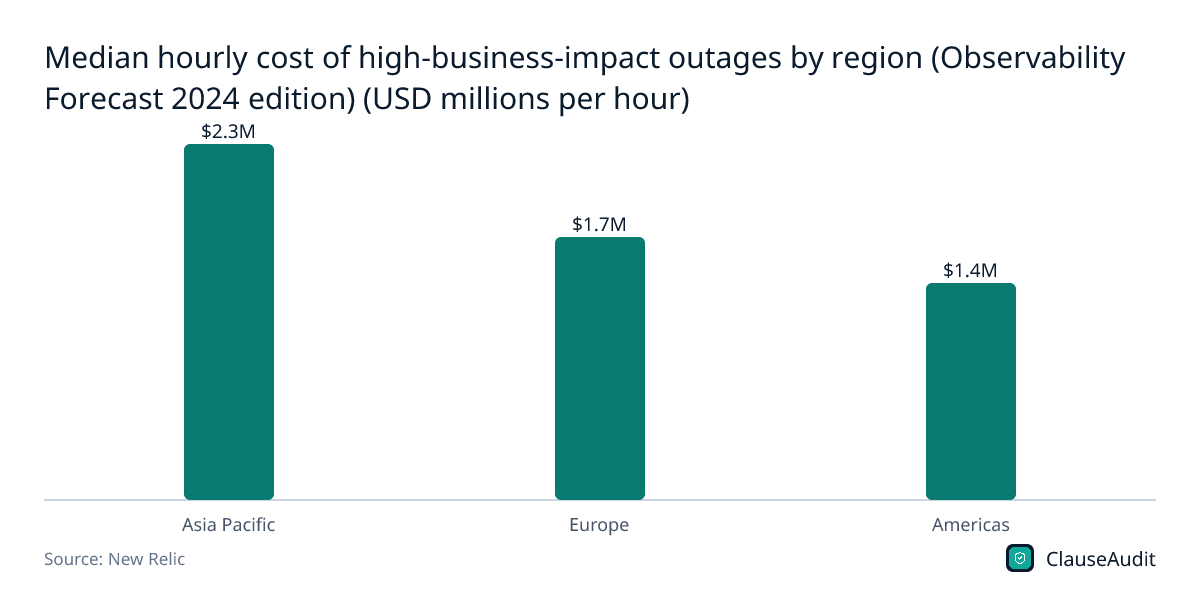
Download this chart (PNG)Median hourly cost of high-business-impact outages by region (Observability Forecast 2024 edition) (USD millions per hour)
Chart data
| Label | Value (USD millions per hour) |
|---|---|
| Asia Pacific | $2.3M |
| Europe | $1.7M |
| Americas | $1.4M |
Respondents in the Americas reported a lower median ($1.4M) than Asia Pacific ($2.3M) or Europe ($1.7M). These are survey medians for large organizations, not a price list for your business.
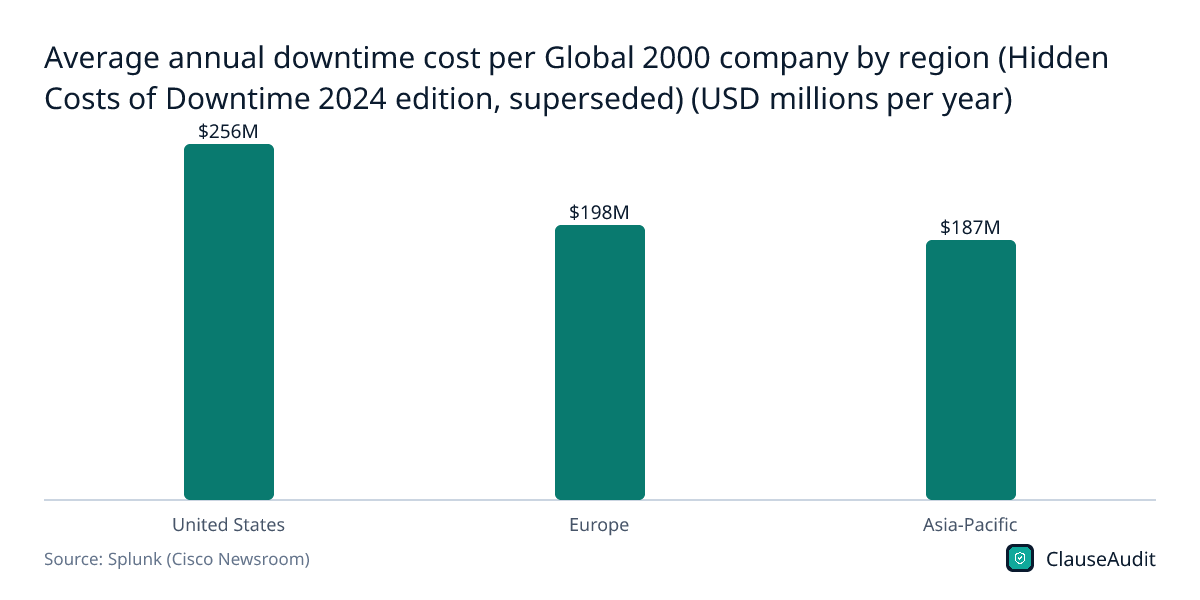
Download this chart (PNG)Average annual downtime cost per Global 2000 company by region (Hidden Costs of Downtime 2024 edition, superseded) (USD millions per year)
Chart data
| Label | Value (USD millions per year) |
|---|---|
| United States | $256M |
| Europe | $198M |
| Asia-Pacific | $187M |
U.S. Global 2000 companies averaged $256M a year in downtime costs, the highest of the three regions in the 2024 edition. No newer regional split has been published.
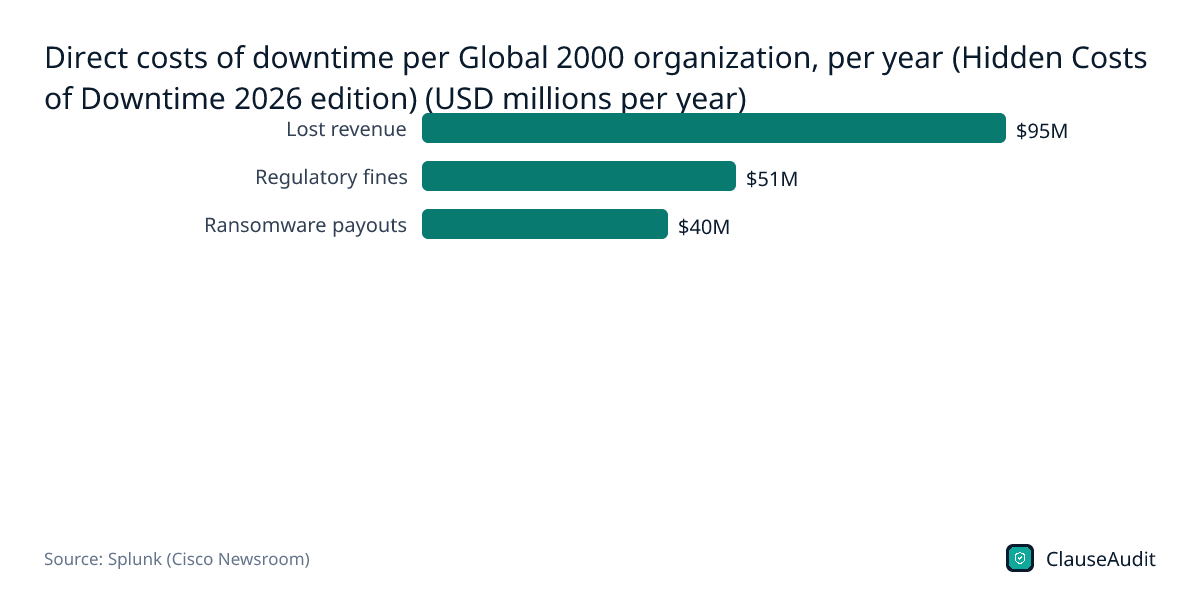
Download this chart (PNG)Direct costs of downtime per Global 2000 organization, per year (Hidden Costs of Downtime 2026 edition) (USD millions per year)
Chart data
| Label | Value |
|---|---|
| Lost revenue | $95M |
| Regulatory fines | $51M |
| Ransomware payouts | $40M |
Lost revenue ($95M) is the biggest line, but regulatory fines ($51M) and ransomware payouts ($40M) show how closely downtime is tied to security and compliance problems.
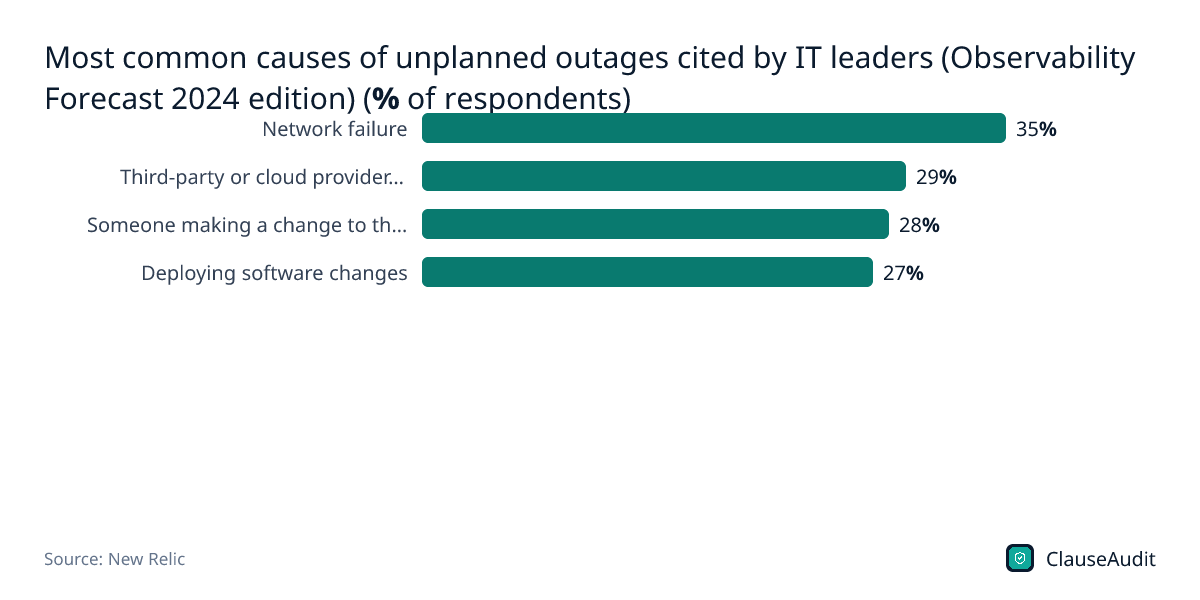
Download this chart (PNG)Most common causes of unplanned outages cited by IT leaders (Observability Forecast 2024 edition) (% of respondents)
Chart data
| Label | Value |
|---|---|
| Network failure | 35% |
| Third-party or cloud provider services failure | 29% |
| Someone making a change to the environment | 28% |
| Deploying software changes | 27% |
Third-party or cloud provider failures (29%) sit just behind network failure (35%). Nearly a third of IT leaders blame an outside vendor, which is exactly where your contract terms do the work.
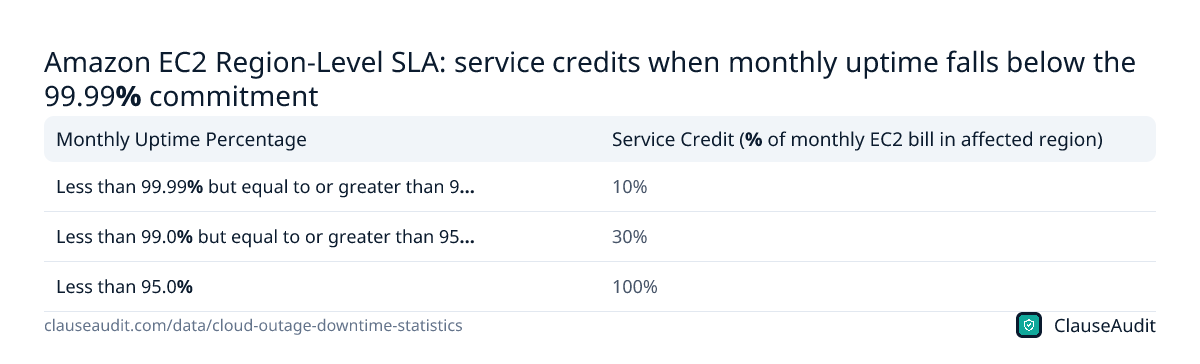
Download this chart (PNG)Amazon EC2 Region-Level SLA: service credits when monthly uptime falls below the 99.99% commitment
| Monthly Uptime Percentage | Service Credit (% of monthly EC2 bill in affected region) |
|---|---|
| Less than 99.99% but equal to or greater than 99.0% | 10% |
| Less than 99.0% but equal to or greater than 95.0% | 30% |
| Less than 95.0% | 100% |
Source: Amazon Web Services, Amazon Compute Service Level Agreement. Download as image
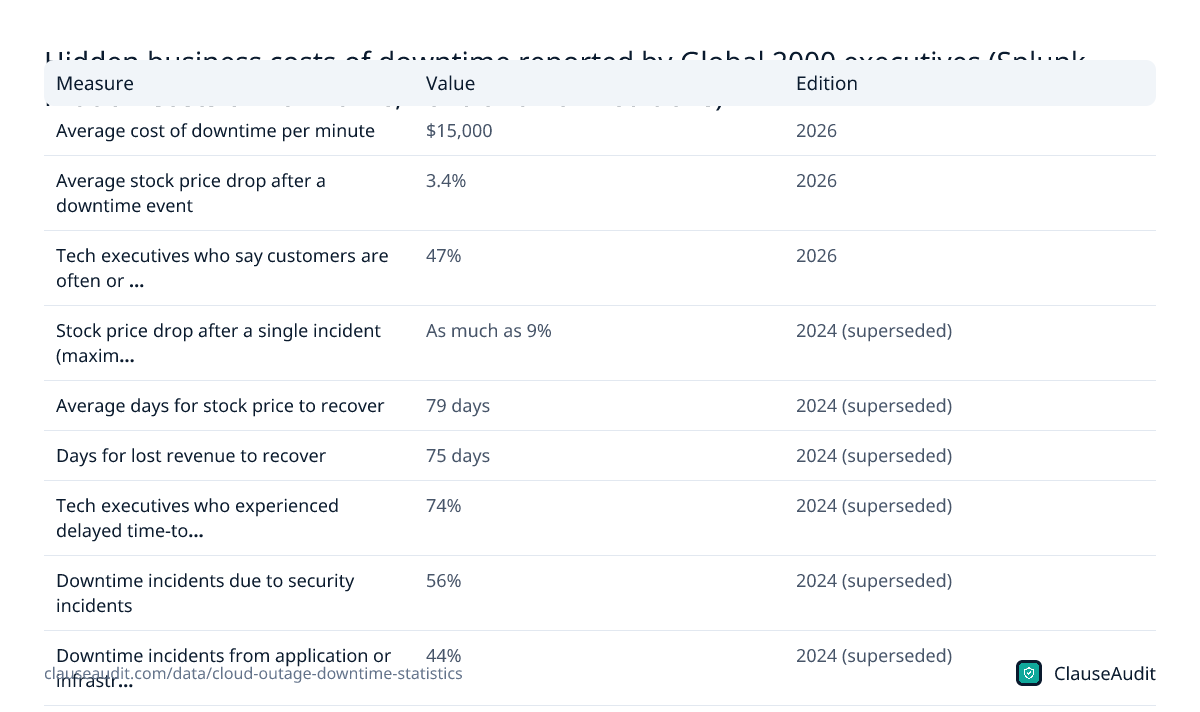
Hidden business costs of downtime reported by Global 2000 executives (Splunk Hidden Costs of Downtime, 2026 and 2024 editions)
| Measure | Value | Edition |
|---|---|---|
| Average cost of downtime per minute | $15,000 | 2026 |
| Average stock price drop after a downtime event | 3.4% | 2026 |
| Tech executives who say customers are often or very often first to detect service degradation or outages | 47% | 2026 |
| Stock price drop after a single incident (maximum, not average) | As much as 9% | 2024 (superseded) |
| Average days for stock price to recover | 79 days | 2024 (superseded) |
| Days for lost revenue to recover | 75 days | 2024 (superseded) |
| Tech executives who experienced delayed time-to-market | 74% | 2024 (superseded) |
| Downtime incidents due to security incidents | 56% | 2024 (superseded) |
| Downtime incidents from application or infrastructure issues | 44% | 2024 (superseded) |
Source: Splunk (Cisco Newsroom), The $600 Billion Wake-Up Call: New Splunk Research Reveals Downtime Is a Systemic Business Crisis (The Hidden Costs of Downtime 2026); Splunk (Cisco Newsroom), Splunk Report Shows Downtime Costs Global 2000 Companies $400B Annually (The Hidden Costs of Downtime, with Oxford Economics). Download as image
How much does an hour of downtime cost?
For large organizations, the surveys agree on the order of magnitude. ITIC found that over 90% of mid-size and large enterprises lose more than $300,000 per hour of downtime, and 41% lose $1 million to over $5 million. New Relic's 2025 survey put the median cost of a high-impact outage at $2 million per hour. Splunk's 2026 edition works out to about $15,000 per minute on average.
Read the 2026 New Relic figure carefully. It reports an average of $1.85 million per hour for high-impact outages, while the 2025 number was a median. They measure different things, so the lower figure is not proof that outages got cheaper.
You are probably not a Global 2000 company, and your hourly number will be smaller. The method is the same, though. Add up revenue you can't take while the tool is down, wages for staff who sit idle, refunds or credits you owe your own customers, and the overtime to clean up afterward. Do that math once for each system your business can't work without. It tells you which contracts deserve a hard look.
How often do cloud and SaaS services go down?
New Relic's 2024 survey found a median of 77 hours of downtime a year across all impact levels. That is a little over three full days lost to outages, small and large.
The causes are a mix of things you control and things you don't. Network failure was cited by 35% of IT leaders, third-party or cloud provider failures by 29%, someone changing the environment by 28%, and software deployments by 27%. Uptime Institute counted IT and networking issues behind 23% of impactful outages in 2024.
One more number should worry any team that sells online. In Splunk's 2026 research, 47% of tech executives said customers are often or very often the first to spot an outage. If your vendor's status page is green while your customers are emailing you, you need a contract that defines downtime by what you can measure as well as what the vendor reports.
Why won't a vendor's SLA credit cover my losses?
Because a service credit is a discount on your bill, not a payment for your loss. Amazon's EC2 regional SLA is a good example. If monthly uptime drops below 99.99% but stays at or above 99.0%, you get 10% of that month's EC2 bill for the affected region. Between 99.0% and 95.0% it rises to 30%. Only below 95.0% do you get the full month back.
Say you pay a few thousand dollars a month for hosting and lose a full business day. The credit is a slice of that bill. Your lost sales, idle staff and angry customers are not part of the formula.
Many SaaS contracts then add two more layers. The SLA often says credits are your "sole and exclusive remedy" for downtime, and the liability cap limits everything else, commonly to fees paid over a short window. Put those together and a vendor outage that costs you real money may entitle you to almost nothing. That is why the SLA, the remedy wording and the liability cap need to be read as one package.
What does downtime cost beyond lost revenue?
Splunk's 2026 edition breaks direct costs down per Global 2000 organization: $95M in lost revenue, $51M in regulatory fines and $40M in ransomware payouts each year. The last two lines are security and compliance costs, not technical ones. In the 2024 edition, 56% of downtime incidents traced back to security incidents, not hardware or bugs.
There are slower costs as well. Companies saw an average stock price drop of 3.4% after a downtime event in the 2026 research. The 2024 edition found lost revenue took 75 days to recover, and 74% of tech executives reported delays in getting products to market.
For a smaller business the equivalent is a lost client, a missed launch or a refund wave. Uptime Institute's 2025 survey found 57% of operators said their most recent major outage cost more than $100,000. A contract that only promises service credits does nothing for any of this.
Are outages getting more expensive?
On the broad measure, yes. Splunk's estimate for Global 2000 companies rose to $600B a year in 2026, a 50% jump in two years. Lost revenue per organization nearly doubled over the same stretch.
New Relic's annualized figure moved the other way, from $76M in 2025 to $73.5M in 2026, though the report doesn't say whether the newer number is a median or an average. The fair reading is that outage costs are high and not falling in any clear way. Plan as if the next one will cost at least as much as the last.
What should a business or freelancer do about outage risk?
You can't stop AWS or your payroll tool from going down. You can decide in advance who carries the cost and how fast you get your data back. Start with the tools that would stop work entirely if they failed.
- Map your critical vendors. List every SaaS and cloud service your revenue depends on and estimate what an hour without each one costs you.
- Read the SLA, not the marketing page. Check the uptime percentage, how downtime is measured, what counts as excluded maintenance, and whether you must file a claim to get a credit.
- Look for the "sole remedy" line. If credits are your only remedy, push for a right to terminate after repeated failures and a carve-out from the liability cap for data loss.
- Match what you promise downstream. Freelancers and agencies who host client sites or apps should never promise more uptime to a client than their own provider promises them.
- Get your data out on your terms. Make sure you can export your data at any time, in a usable format, while the contract is still running.
- Keep the incident trail. Save screenshots, timestamps and support tickets during an outage, because many SLAs require you to claim credits within a short window.
How ClauseAudit helps
Outage data shows the risk. Your contract shows who pays for it. Upload a SaaS, cloud or hosting agreement and ClauseAudit's automated review flags the clauses that decide what happens when the service goes down, explains them in plain English and suggests what to ask for.
It's built for owners, ops leads and freelancers who sign software terms without a lawyer on call.
- Uptime commitment, how downtime is measured and what maintenance is excluded
- Service credit amounts, claim deadlines and any "sole and exclusive remedy" wording
- Liability cap size and whether data loss or security breaches are carved out
- Your right to terminate after repeated outages without paying an early exit fee
- Data export and deletion terms if you leave after an outage
- Force majeure language that could excuse the vendor's own infrastructure failures
Frequently asked questions
What is the average cost of downtime per hour?
It depends on company size, but for large firms the numbers are high. ITIC's 2024 survey found over 90% of mid-size and large enterprises lose more than $300,000 per hour. New Relic's 2025 survey put the median for high-impact outages at $2 million per hour, and its 2026 edition reported an average of $1.85 million.
What is the cost of downtime per minute?
Splunk's 2026 Hidden Costs of Downtime research puts the average at $15,000 per minute for Global 2000 companies. Smaller businesses lose far less in absolute terms, but the share of daily revenue lost can be just as painful if a single tool runs sales, booking or payments.
How many hours of downtime does a typical company have per year?
New Relic's 2024 survey found a median of 77 hours of annual downtime across all business impact levels, roughly three days. Not all of that is a full outage. Some is partial slowdowns or failures in one feature, which many SLAs don't count as downtime at all.
What causes most cloud and IT outages?
In New Relic's 2024 survey, IT leaders most often cited network failure (35%), third-party or cloud provider failures (29%), someone making a change to the environment (28%) and software deployments (27%). Respondents could name more than one cause. Uptime Institute said IT and networking issues caused 23% of impactful outages in 2024.
Does AWS pay me if it goes down?
Not in cash. Under the Amazon EC2 regional SLA, you get service credits against your bill: 10% if monthly uptime falls below 99.99% but stays at or above 99.0%, 30% below 99.0%, and 100% below 95.0%. Credits cover your hosting bill only, never your lost revenue.
Can I sue a SaaS vendor for lost revenue after an outage?
Usually not for much. Many SaaS agreements exclude lost profits and other indirect damages, cap total liability at a small amount of fees, and make service credits the only remedy for downtime. Your options depend on the exact wording, which is why it pays to negotiate carve-outs before you sign.
Are outages getting more expensive?
Splunk's estimate for Global 2000 companies reached $600B a year in 2026, up 50% in two years. New Relic's annualized high-impact cost dipped from $76M in 2025 to $73.5M in 2026, but the two editions may not use the same measure. Overall, costs are high and not clearly falling.
What should I ask for in a SaaS SLA?
Ask for a clear uptime commitment, downtime measured from your side rather than only the vendor's dashboard, credits applied automatically, a right to terminate after repeated misses, and data loss carved out of the liability cap. Also confirm you can export your data at any time.
Use this data
Every chart and card below is free to reuse under CC BY 4.0. Download what you need and link back to this page.
 Stat cards
 Key findings card
 Infographic
 Median cost per hour of downtime by outage business impact (Observability Forecast 2024 edition) (USD millions per hour)
 Median hourly cost of high-business-impact outages by region (Observability Forecast 2024 edition) (USD millions per hour)
 Average annual downtime cost per Global 2000 company by region (Hidden Costs of Downtime 2024 edition, superseded) (USD millions per year)
 Direct costs of downtime per Global 2000 organization, per year (Hidden Costs of Downtime 2026 edition) (USD millions per year)
 Most common causes of unplanned outages cited by IT leaders (Observability Forecast 2024 edition) (% of respondents)
 Amazon EC2 Region-Level SLA: service credits when monthly uptime falls below the 99.99% commitment
 Hidden business costs of downtime reported by Global 2000 executives (Splunk Hidden Costs of Downtime, 2026 and 2024 editions)
Embed the infographic
Free to share on your site, blog or slides under CC BY 4.0. Please keep the credit link.
Sources and method
Every number on this page comes from the sources below, each opened and read on or before October 18, 2026. A second, independent review checked every figure against its source and corrected anything that did not match. Figures that could not be confirmed were left out.
- Information Technology Intelligence Consulting (ITIC), ITIC 2024 Hourly Cost of Downtime Report (September 3, 2024)
- Information Technology Intelligence Consulting (ITIC), ITIC 2024 Hourly Cost of Downtime Part 2 (September 10, 2024)
- Splunk (Cisco Newsroom), The $600 Billion Wake-Up Call: New Splunk Research Reveals Downtime Is a Systemic Business Crisis (The Hidden Costs of Downtime 2026) (May 19, 2026)
- Splunk (Cisco Newsroom), Splunk Report Shows Downtime Costs Global 2000 Companies $400B Annually (The Hidden Costs of Downtime, with Oxford Economics) (June 11, 2024 (2024 edition; superseded by the 2026 edition of May 19, 2026))
- Uptime Institute, Uptime Announces Annual Outage Analysis Report 2026 (8th Annual Outage Analysis) (May 13, 2026)
- Uptime Institute, Uptime Announces Annual Outage Analysis Report 2025 (7th Annual Outage Analysis) (May 6, 2025)
- New Relic, 2024 Observability Forecast: Outages, downtime and cost (2024 edition (superseded by the 2025 and 2026 editions; cited only for measures the 2026 edition does not report))
- New Relic, New Relic 2025 Observability Forecast press release (September 17, 2025)
- New Relic, New Relic 2026 Observability Forecast Report (2026 edition (PDF posted September 2026, © 2026))
- Amazon Web Services, Amazon Compute Service Level Agreement (Last updated May 25, 2022)
Cite this page
ClauseAudit, “SaaS and Cloud Outage Statistics: How Often Software Goes Down and What It Costs”, updated October 18, 2026, https://clauseaudit.com/data/cloud-outage-downtime-statistics. Free to reuse with a link back (CC BY 4.0).
This page summarises published data and law as checked on October 18, 2026. Figures are updated as new editions are released, and your own situation may differ. It is general information, not legal, tax or financial advice.